- Search Metals Mine
- 79 Results (2 Threads , 77 Replies )
-
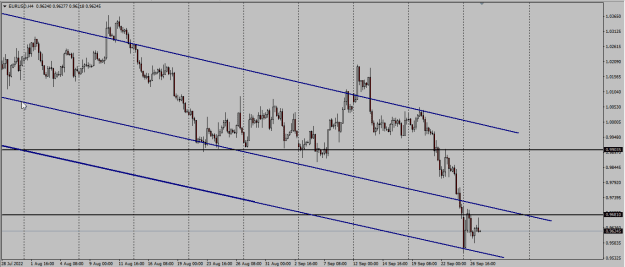
 fxanalysis replied Sep 27, 2022
As initially expected, after the break, market reached the next target @0.968. Now 0.968 is key level. image
EURUSD
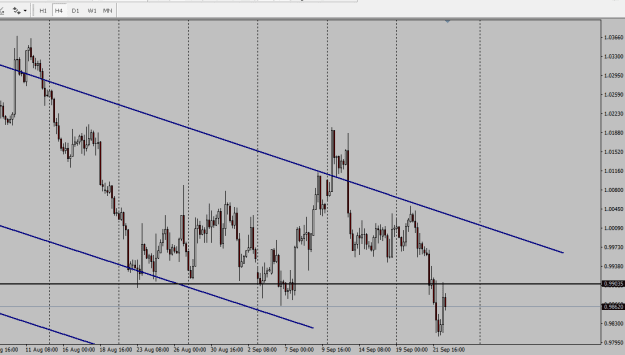
- fxanalysis replied Sep 9, 2022
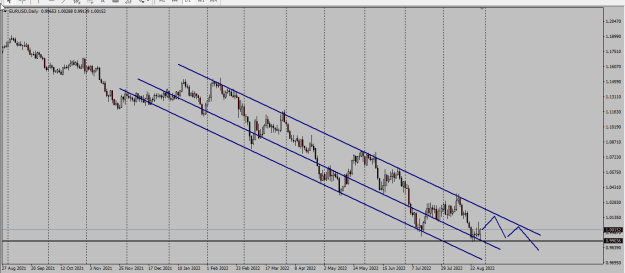
ECB rate hike, stronger Euro? I'm in doubts about that, I don't think that $ strength will disappear that soon. Looking for EU to break low and go for 0.968 Picture - Daily TF image
EURUSD
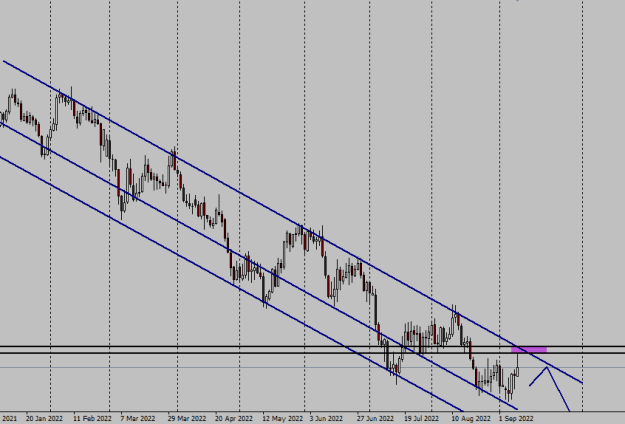
- fxanalysis replied Aug 29, 2022
And then ,on the break down, 0.968 H level can be the target. image
EURUSD
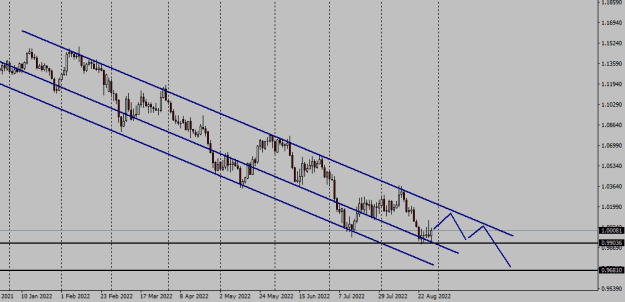
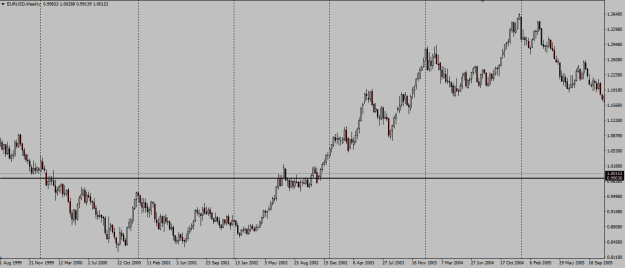
- fxanalysis replied Aug 29, 2022
EURUSD Weekly H level image But still trend on Daily is down. We may see descending triangle between trendline and H level and then most likely break down ( just because of fundamental - eurodollar shortage). image
EURUSD
- fxanalysis replied Dec 4, 2021
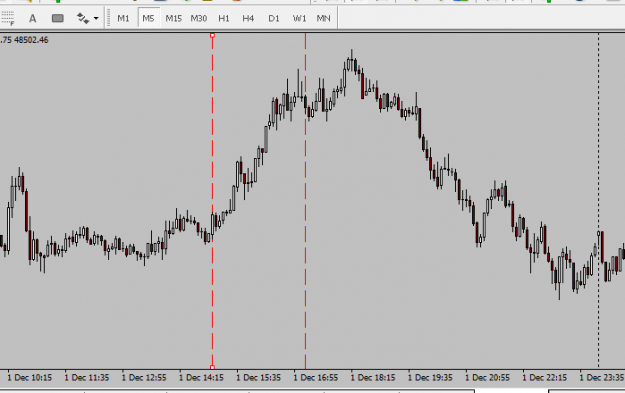
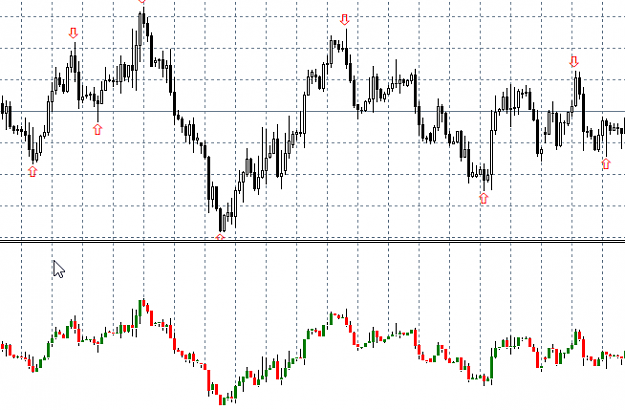
image image BTCUSD 5min chart trend signal (GMT +2)
Need Help : Merge 2 Loops into 1 Loop

- fxanalysis replied Nov 25, 2021
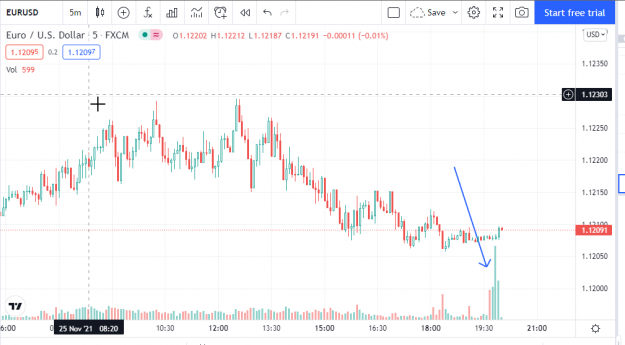
image Anyone has idea what happened here? where this volume came from?
EURUSD
- fxanalysis replied Nov 25, 2021
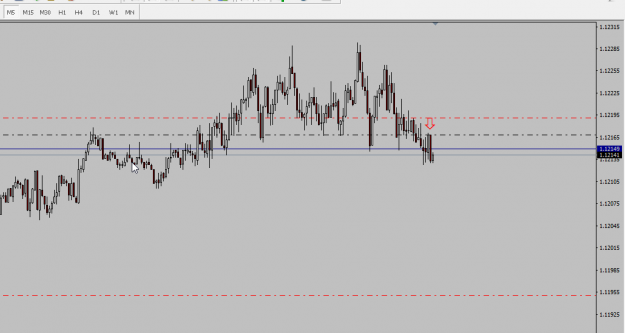
Market went the other way in last minutes of London session
EURUSD Prediction for close, off by 7 PIPs image
- fxanalysis replied Nov 25, 2021
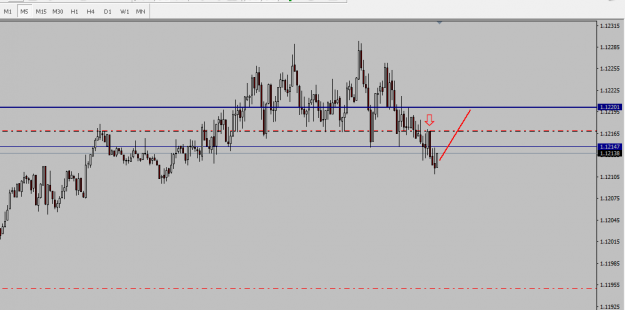
image Momentum lost, market reached SL, trade closed in profit RR 1:1 Now lets see if London session will close @1.1218
EURUSD
- fxanalysis replied Nov 25, 2021
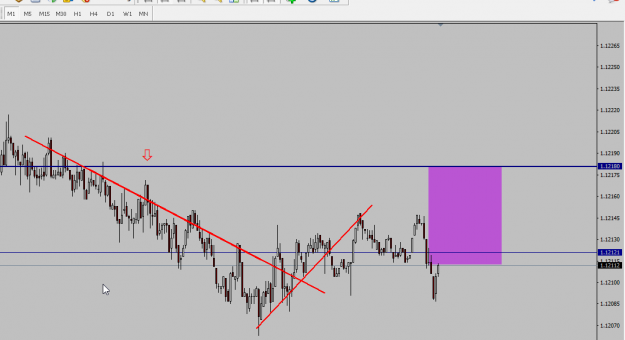
image It is possible that London will cut the exposure and close the session @ 1.1220 and this trade will go bust. I've moved the SL to break even and keep the trade only if there will be momentum to downside, if momemtum fades then most likely SL ...
EURUSD
- fxanalysis replied Nov 25, 2021
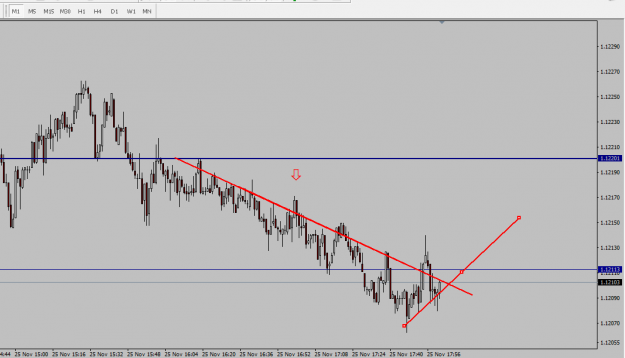
image EURUSD 5min chart Short position. Risk: 2PIPs (with spread only 1PIP)
EURUSD Target: will see..
- fxanalysis replied May 26, 2019
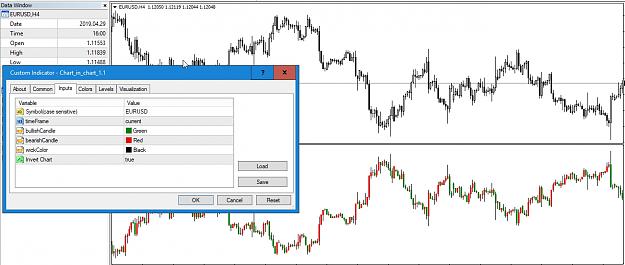
Update for Chart in Chart indicator. Added new input, invert chart. image
Indicators by fxanalysis
- fxanalysis replied May 25, 2019
Lets start with the positive. Yes,you are right there is something there and this indicator can be useful if used properly and in combination with other techniques and/or indicators. And now... "You can be sure that as long that number is that high ...
I will code your EAs and Indicators for no charge
- fxanalysis replied Jan 11, 2019
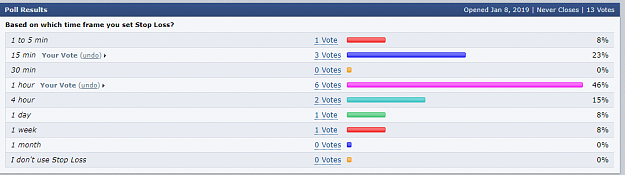
I made a pool in FF, unfortunately it didn't get large enough member interaction. Overall it seems that most of the retail traders are using "Small" time frames when setting SL levels, that is 15M and 1H. Pool had only 13 votes so results are not ...
Trading
- fxanalysis replied Dec 23, 2018
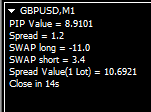
Tick value indicator update Added Spread value , now you can compare spread value for different pairs.Sometimes people only compare spread in PIPs not taking in account that currencies pair spread might be valued in different currency than other. ...
Indicators by fxanalysis

- fxanalysis replied Dec 23, 2018
Update for Chart in Chart indicator. Indicator automatically reads original chart background color image
Indicators by fxanalysis
- fxanalysis replied Nov 15, 2018
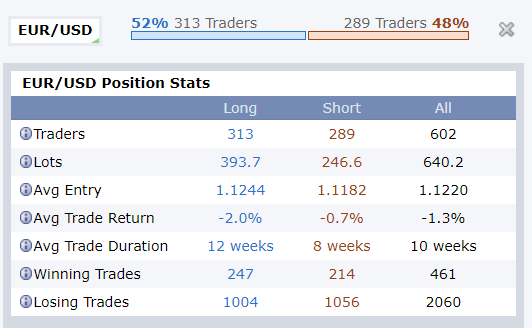
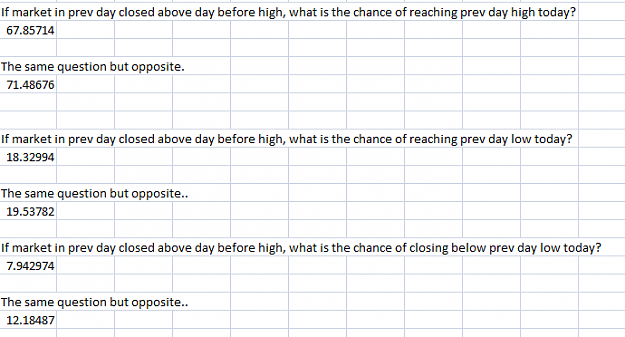
If I remember correctly then these are simple statistics on EURUSD from D1 H/L/O/C data. image
Trading
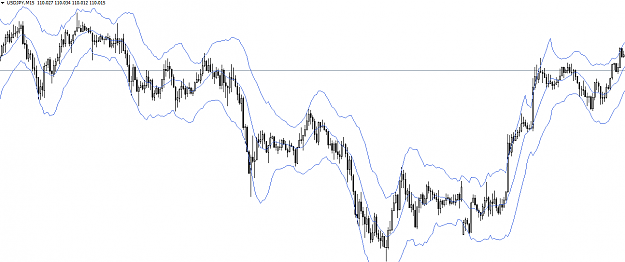
- fxanalysis replied Jun 11, 2018
Keltner Channels image " Keltner Channels are volatility-based envelopes set above and below an exponential moving average. This indicator is similar to Bollinger Bands, which use the standard deviation to set the bands. Instead of using the ...
Indicators by fxanalysis