- Search Metals Mine
- 16 Results
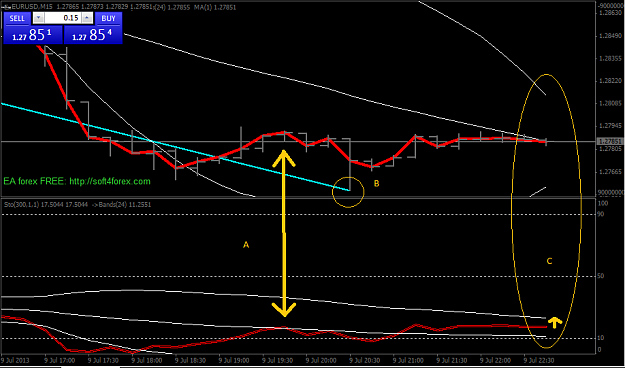
- fx_forever replied Jul 9, 2013
I see a dissimilarity a little bit earlier than crottsinabox Wainting for the future but volatility is low now.
The similarity system


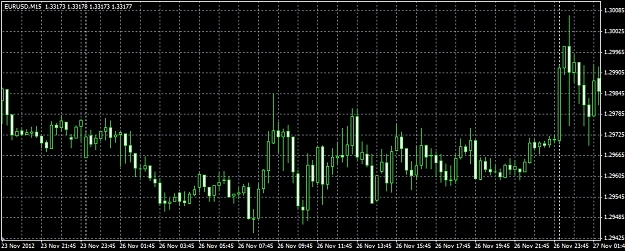
- fx_forever replied Jan 21, 2013
Ok, now at home... this is monday 26 november. Surprised by a half day converging triangle ?
EURUSD
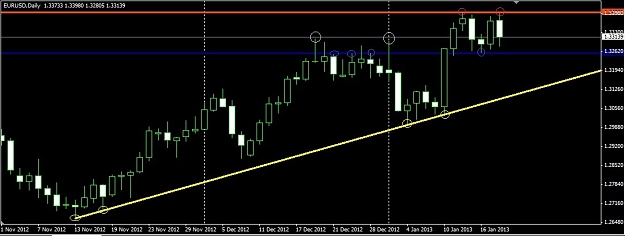
- fx_forever replied Jan 20, 2013
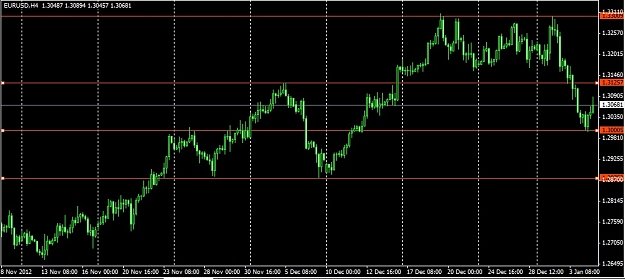
Some ideas (daily graph, day starts at 0h00 GMT): - Strongest support (most connexion points) is around 1.2850 - Down it will probably try to find its long-term strong support (yellow line) before probably reversing. - If it doesn't break 1.2850, it ...
EURUSD

- fx_forever replied Jan 13, 2013
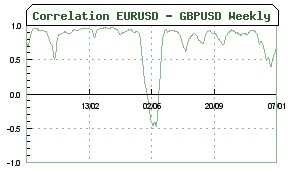
This is correlation between two pairs. Ok for that we have weekly correlation to show us that most of the time it is correlated and when it is not we can argue that it will be again soon. But USD index includes EUR, JPY, GBP, CAD, CHF and SEK... I ...
EURUSD
- fx_forever replied Jan 9, 2013
Key resistance for really going up is the very strong 1.3125 (i re-upload the old picture...).
EURUSD
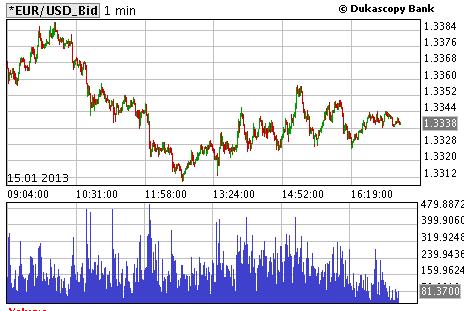
- fx_forever replied Jan 9, 2013
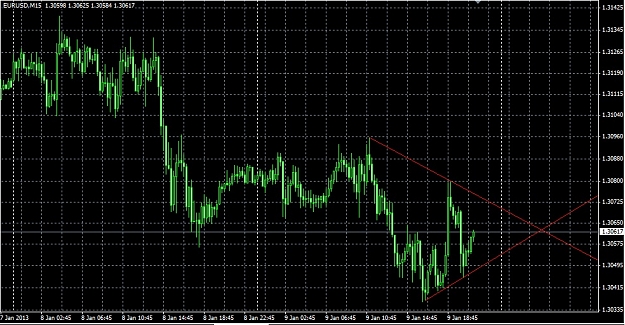
Maybe new price convergence. Wait for a high peak than bounces back from resistance to confirm the picture. But it's sideways ... i would not take any trade before ECB rate tomorrow. Moreover Asia is coming...
EURUSD
- fx_forever replied Jan 9, 2013
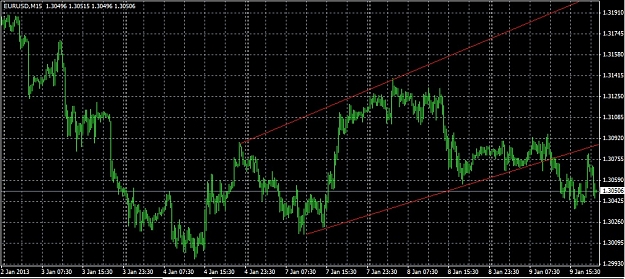
The better is to draw the lines on a chart and let them speak by themselves. If you put a picture, you can't claim for miracles before they come. This was the pullback and down again. It can be explained by the channel formation: it bounced back to ...
EURUSD
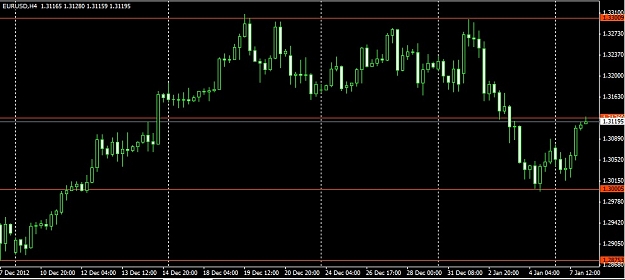

- fx_forever replied Jan 7, 2013
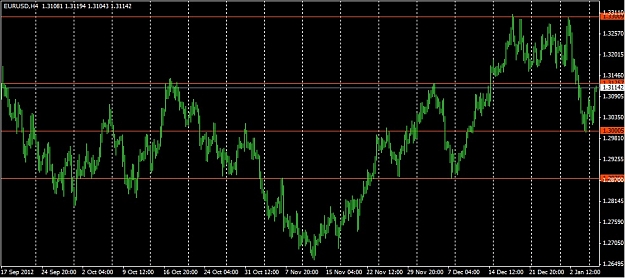
Hi all, Look at the H4 chart on EURUSD. AB-CD pattern after a beautifull bat. My levels are (draw horizontal lines): R1 - 1.3300 R2 - 1.3125 S1 - 1.3000 S2 - 1.2875 So this week i predicted to retrace up to 1.3125 (we are at 1.3120 until now) 1.3125 ...
EURUSD
- fx_forever replied Dec 27, 2012
This one is over also with success now... got it (thank you Mr Obama ?).
Extracted Thread (per thread starter's request)
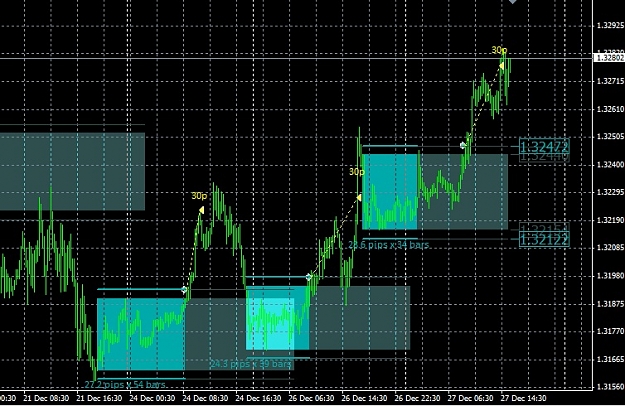
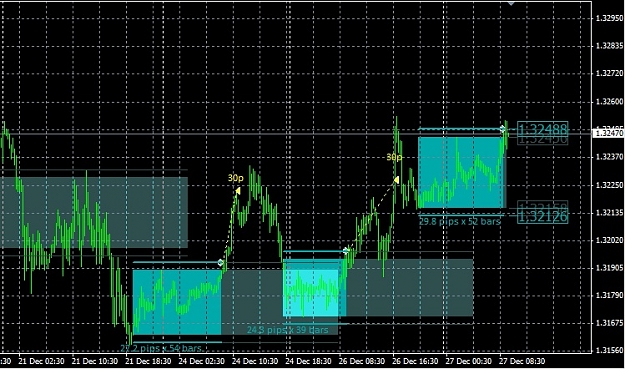
- fx_forever replied Dec 27, 2012
You're right. These are the first two ones i "missed" this week. In fact i didn't plan to start before 2013. I must say that i will not use the QuickTakeProfit feature : my first profit target is always the zone size. If the zone size is 24 pips, ...
Extracted Thread (per thread starter's request)
- Posts by Member Search: 'fx_forever'