- Search Metals Mine
- 62 Results
-
 fmsfx replied Apr 9, 2021
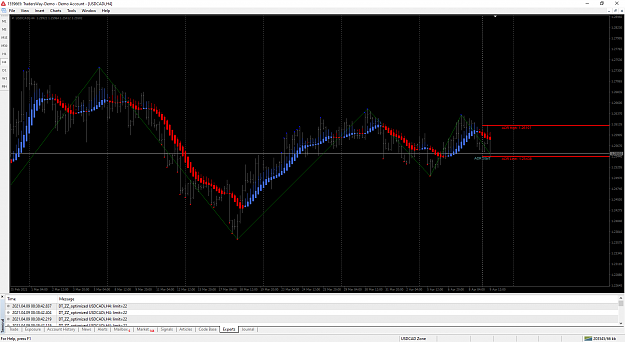
Hoping I could have someone take a look at this indicator to see if there is something wrong going on inside the indicator to constantly display (DT_ZZ_optimized USDCADi,H4: limit=22) in the Experts tab. Pic and indicator attached edit: I think it ...
I will code your EAs and Indicators for no charge
- fmsfx replied Mar 21, 2021
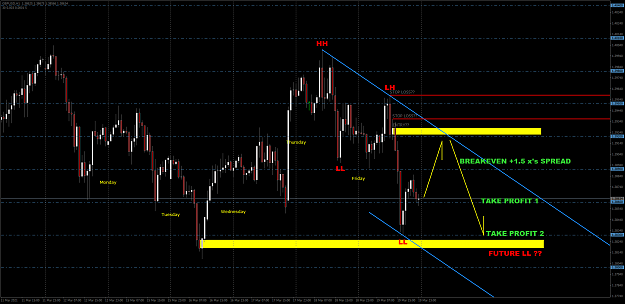
Great thread niko. Ive been trying to create my own type of Price Action system using some of your ideas for awhile now. Hope this pic dont derail your thread and if it does I will remove it if you see the need. Dave
Market Structure Only- keep your charts clean
- fmsfx replied Feb 4, 2021
Excellent idea Kis. I'm a big fan of the RSI and besides that I'm a fan of the little ones especially in needed. Hoping for all the best to you and yours. Dave
Multi Currency RSI average indicator for testing

- fmsfx replied Jul 5, 2020
Like to know if anyone could modify these two scripts to include adding Object Descriptions to the code so that once you use the Copy script it will also copy the Object Description of the line. Pic attached for visual. Dave
I will code your EAs and Indicators for no charge
- fmsfx replied Apr 29, 2020
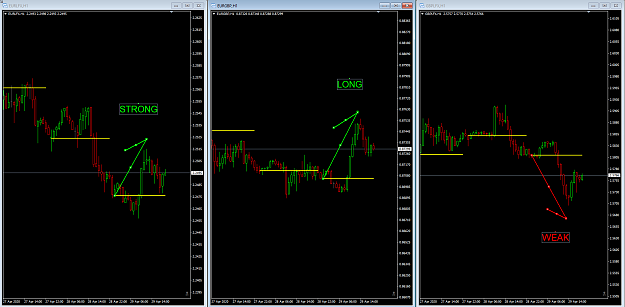
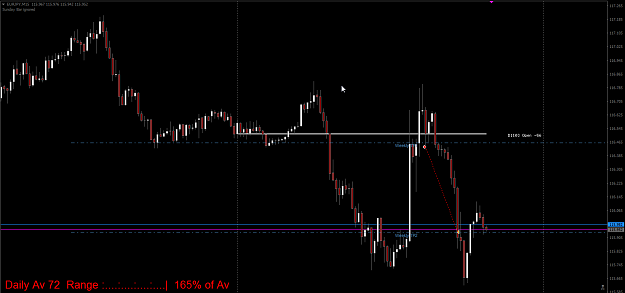
Just a quick pic of what I look for to determine the direction of the EurGbp in the hedging example in the previous post. This is simply identifying Strength/Weakness using the Daily Open as a reference point(just above or below the open). EurGbp ...
Real or Algo
- fmsfx replied Apr 28, 2020
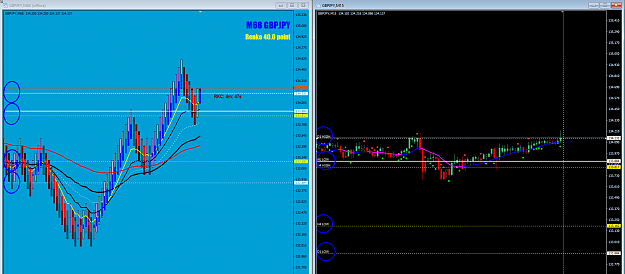
EurGbp is a cross pair. So "if" the EurUsd and GbpUsd are at certain areas of reversal it most likely is going to affect the EurGbp pair accordingly. Not 100% of the time but the majority of time. Attached an old pic from back in the ole basket ...
Real or Algo

- fmsfx replied Apr 23, 2020
Excellent thread Andy. I took the EurJpy today as well but only short 1 time. Missed the short from the high of the day but you can't sit in front of the computer all day. Or at least I cant anyway. A win is a win. Dave
Real or Algo
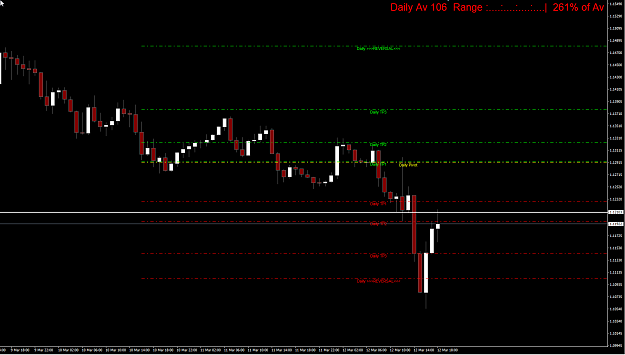
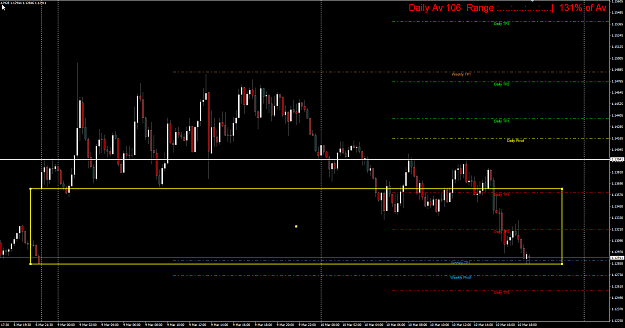
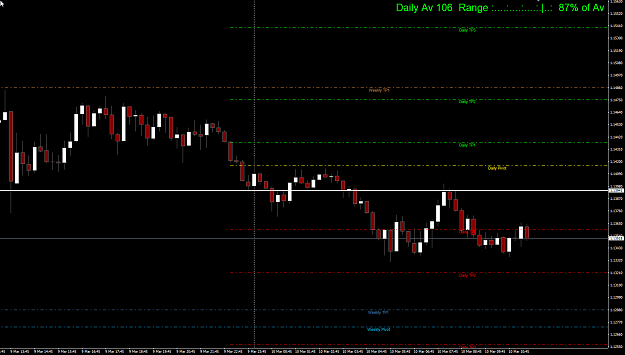
- fmsfx replied Mar 12, 2020
In this case, you can see the ADR is over 100%. However when the Dow futures were over -1200 points before the US market opened its a pretty good bet TP3 or even the Daily Reversal area will get tagged.
EURUSD Pro
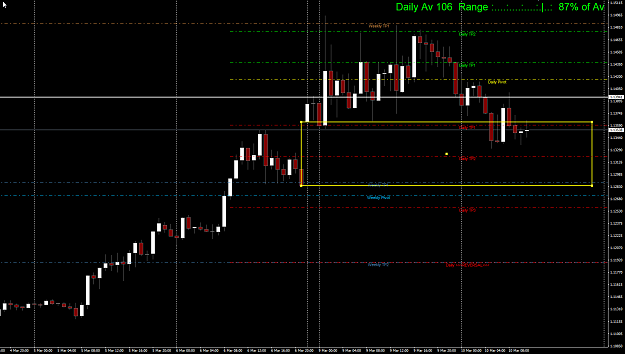
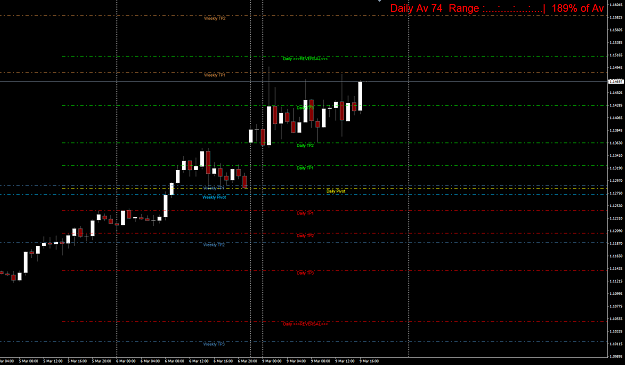
- fmsfx replied Mar 12, 2020
Tricky TP based on the daily range but will see which one it hits.
EURUSD Pro
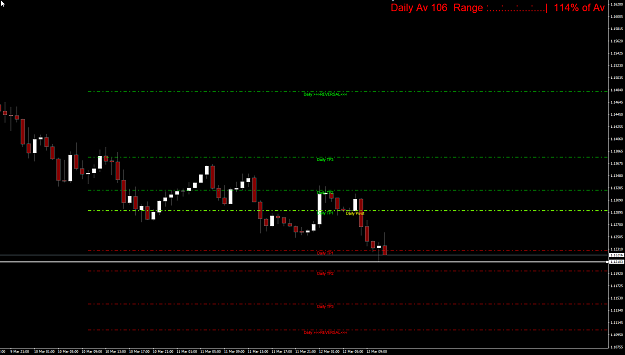
- fmsfx replied Mar 11, 2020
TP hit...close enough for me. Will it go down further...no clue. One thing I have learned with trading is always trade your plan and don't deviate from it. TP's will always be discretionary from trader to trader from system to system. In this trade ...
EURUSD Pro
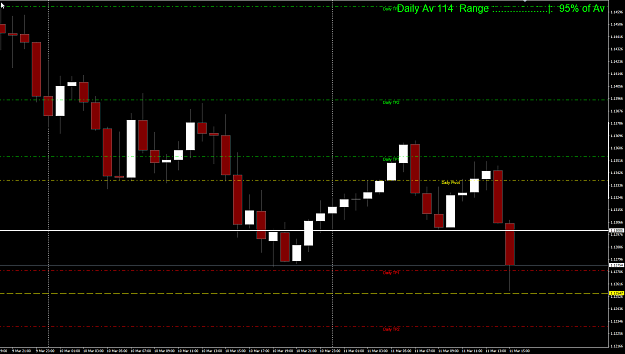
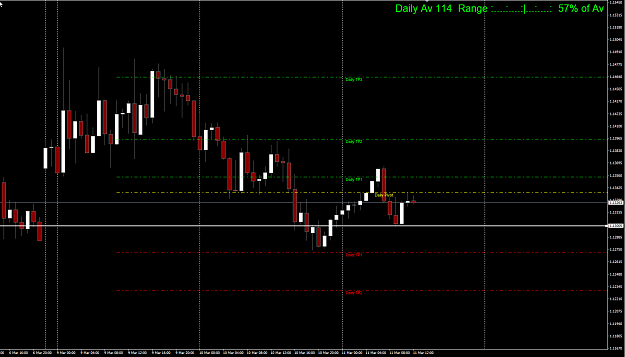
- fmsfx replied Mar 11, 2020
My next BO area South and TP once again take your pic. Personally I would target the Daily TP2 area. Edit: if it breaks my TP will be 1.12547
EURUSD Pro
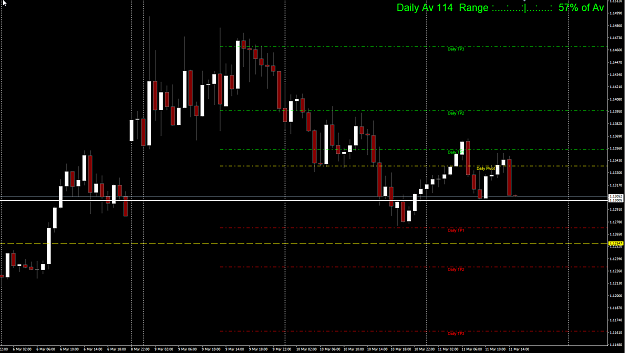
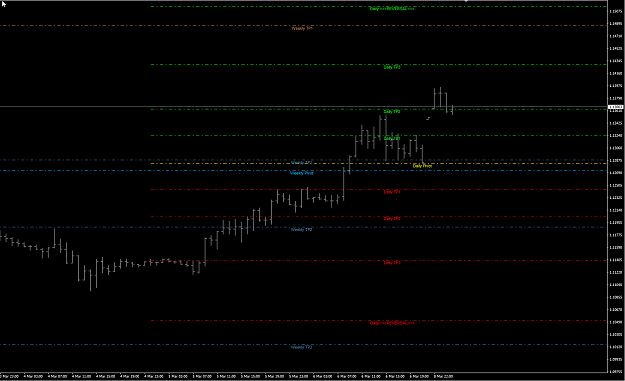
- fmsfx replied Mar 10, 2020
Little late posting this pic but I'm a BO trader so I was looking for a break below the White line. I know its painting the past and anyone can do that so I will try to post the Line sooner in case there are other BO traders around. Targets should ...
EURUSD Pro
- fmsfx replied Mar 8, 2020
Some levels I will be watching to enter and/or exit. Edit: H1 chart
EURUSD Pro
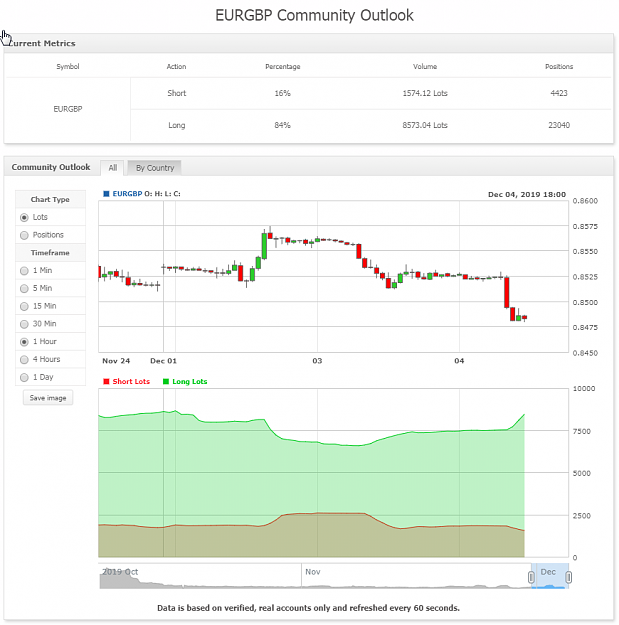
- fmsfx replied Dec 4, 2019
I have been trying to incorporate this info with my DC entries. You can see most retail traders are Long and I'm looking at this as a contrarian filter so short setups. Don't know if it will work but just watching for now. Dave
Basket Knights - A Basket Trading Round Table
- fmsfx replied Dec 2, 2019
Seen the same thing Lee and closed down my B10 for a few pips. Now I will just wait for the DC to rinse and repeat. I typically see around 250-350 pips on my B10 trades Dave
Basket Knights - A Basket Trading Round Table

- fmsfx replied Dec 2, 2019
My long still heading north for now. Dave
Basket Knights - A Basket Trading Round Table

- fmsfx replied Nov 28, 2019
Excellent Ty! More source code to the thread. Here is a great little indicator by one of the great contributors on FF. Little bit more "lipstick" but I find it useful as well. Swap data works just my demo broker don't send the info. Dave
Basket Knights - A Basket Trading Round Table
