- Search Metals Mine
- 26 Results (2 Threads , 24 Replies )
- Forgot how to add MA to Accumulative DistributionStarted Jul 20, 2013|Platform Tech|3 replies

It's been a long time since I used MT4. How do I add a SMA to the bottom indicator; Accumulative ...
-
 drick008 replied Jul 14, 2011
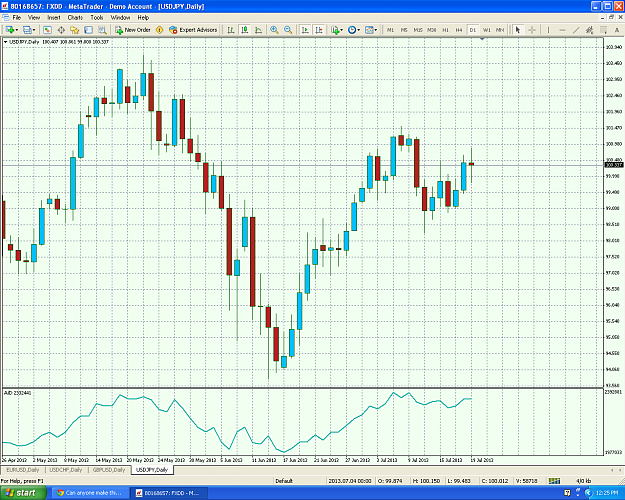
USD/CHF — I believe vickym is warning us about the daily bar. The day is not yet over, but we may want to be cautious on this one.
Trade What You See - Almost Naked Trading
- drick008 replied May 31, 2011
How's this? — I think this will work, it is Moving Average of Oscillators (OsMA). It should be in MetaTrader4 indicators...just change the colors. Rick
123 system filter?
- drick008 replied Oct 17, 2009
Comment on Daily EUR/JPY — Hi, I wonder if anyone have any comment on EUR/JPY Daily pin bar. Maybe just a coincidence, there was another pin bar last Aug. 24th and the Oct 16th pin bar is at similar location where I believe is a strong ...
james16 Chart Thread
- drick008 replied Jun 1, 2009
Daily Pin bar on EUR/USD and USD/CAD — Hi everyone, Just a follow up on these pin bars. I added CCI (14) and may indicate a good confirmation. We'll see how they develop, this is new to me and trying to learn more. Regards, Rick
james16 Chart Thread
- drick008 replied Mar 3, 2008
Update — EUR/AUD closed at SL: Squeeze-More Strategy: Start Feb. 25, 2007 Closed Trades: 2/25/2008 SHORT USD/CAD (+653 pips) LONG CAD/JPY (+379 pips) SHORT EUR/CAD (+423 pips) LONG USD/JPY (+87 pips) 2/26/2008 SHORT NZD/USD (-150 pips) 3 lots ...
DRICK's trading Journal.
- drick008 replied Mar 2, 2008
Since Stohastic oscillator is used, I need to understand it and how I could use it. INTRODUCTION: Developed by George C. Lane in the late 1950s, the Stochastic Oscillator is a momentum indicator that shows the location of the current close relative ...
DRICK's trading Journal.
- drick008 replied Mar 1, 2008
How does it look? — Here's how the chart looks like on my open trade: LONG EUR/AUD I waited for the stochastic to go pass 50, AC and AO green, previous EJ trend bars are green, and the entry bar was blue. Daily stochastic was pointing up, ...
DRICK's trading Journal.
- drick008 replied Jan 17, 2008
Update — Closed Short AUD/USD at 0.8790 with +14 pips. Reason: Initially did not break the trend line. See picture. Still open on Short EUR/USD and Short EUR/GBP.
DRICK's trading Journal.
- drick008 replied Jan 16, 2008
This is for my record. I noticed the EUR/AUD is in range for quite a while, so looks loke I should have waited for price to break the resistance. I have to check on my simulation for this situation. But other than that and the news, my entry ...
DRICK's trading Journal.
- drick008 replied Jan 16, 2008
Update — Thank you, Oromis, and yes I currently trade live. Long EUR/AUD stopped at 1.6610 with -174 pips image Reviewing my trade, the pair has been ranging and EUR got weak across the board. I can't find anything on my entry to tell me ...
DRICK's trading Journal.
- drick008 replied Jan 16, 2008
Another trade 1/16/08: Short AUD/USD at 0.8804 S/L 0.8900
DRICK's trading Journal.
- drick008 replied Jan 15, 2008
Here's a trade I placed earlier: 1/15/08 Long EUR/AUD at 1.6784 S/L 1.6610
DRICK's trading Journal.
- drick008 replied Jan 12, 2008
Not a PIP NAILER on my chart. — Bullish84, Here is the picture I have from your entry and exit. It is NOT a valid Pip Nailer in my chart. Unless someone else have a chart showing different. Let'e keep this thread simple by having the Pip ...
"The Pip Nailer". Any time frame, any pair
- drick008 replied Jan 11, 2008
Here's another in the GBP/USD monthly. Signal happened Dec 2007 and target is around 1.9083. This will be interesting to see.
"The Pip Nailer". Any time frame, any pair
- drick008 replied Jan 7, 2008
Update 1/7/08 — Open positions: Sell AUD/USD at 0.8717 S/L 0.8772 Buy USD/CAD at 1.0029 S/L 0.9921 New opened positions with charts: Buy USD/CHF at 1.1176 S/L 1.1090 Buy GBP/CHF at 2.1991 S/L 2.1843
DRICK's trading Journal.
- drick008 replied Jan 7, 2008
1HR charts for 1/07/08 — These charts are for my record to see if they result to good entry. All charts showed price passed 55SMA.
DRICK's trading Journal.
- drick008 replied Jan 5, 2008
Charts for GBP/JPY and USD/JPY — Here are the charts for GBP/JPY and USD/JPY. Reversal is still possible soon. Just wait for price pass the 55SMA.
DRICK's trading Journal.
- drick008 replied Jan 5, 2008
1/4/08 charts — Here are the charts for why I want to Short AUD/USD and Long USD/CAD.
DRICK's trading Journal.
- drick008 replied Jan 3, 2008
Possible reversal? — Here's what I see in the 1 HR charts. Price penetrated lower BB (BB%) twice but the CCI is weaker on the second: A Possible Bullish Pattern. Regards, Rick
Daily PIN Bars