- Search Metals Mine
- 34 Results
-
 dogbreath replied Apr 12, 2012
fibo fan weekly — just for interest On weekly - fibo fan
XAU/USD & XAG/USD - Gold & Silver Traders Thread
- dogbreath replied Apr 10, 2012
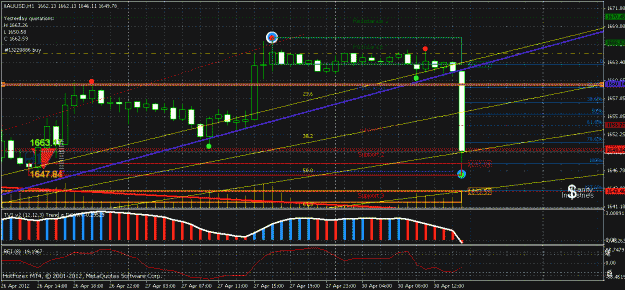
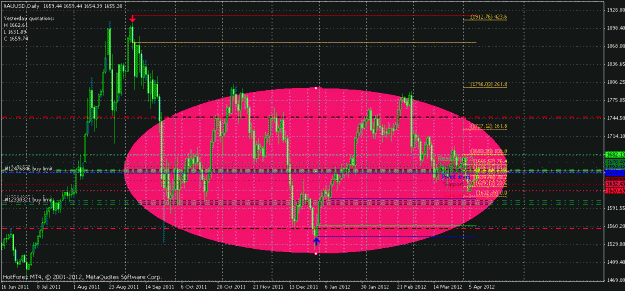
Daily - Inverse head and shoulders? — On the daily.....looks like we might have a huge inverse head and shoulders if it goes down to about 1600 next few days?? Anyone see that too?
XAU/USD & XAG/USD - Gold & Silver Traders Thread
- dogbreath replied Apr 5, 2012
Excellent write up beeb...easy to follow...very well written....thxs for sharing. I see what you were saying about the ABC...there seems to be no perfect downfork currently on the h4.....so..... Adjusted my h4 chart a little....took some "artistic" ...
XAU/USD & XAG/USD - Gold & Silver Traders Thread
- dogbreath replied Apr 5, 2012
Here is where I have them on the H4. Thanks for bringing them to our attention...they are very useful
XAU/USD & XAG/USD - Gold & Silver Traders Thread
- dogbreath replied Apr 5, 2012
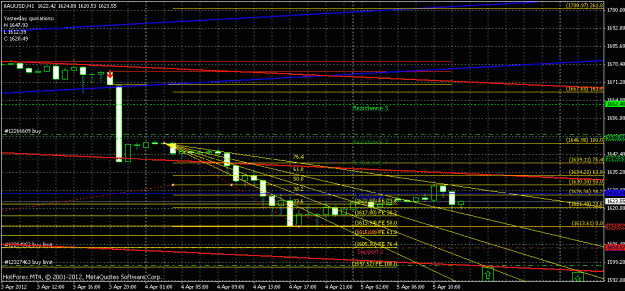
fib lines are predicting a low of around 1600 by the end if the us trading day. Chart is has a lot of clutter...but if you can follow it....the price retraced to the 50% fib...then headed down. The question is....where is it going to bottom out. The ...
XAU/USD & XAG/USD - Gold & Silver Traders Thread
- dogbreath replied Apr 4, 2012
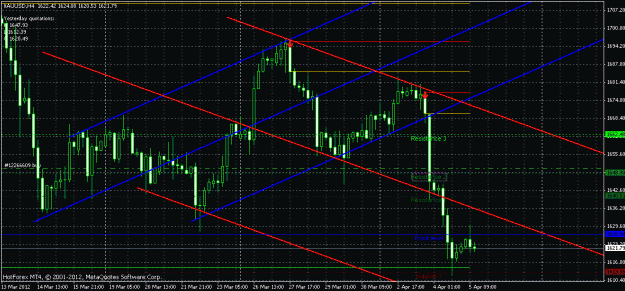
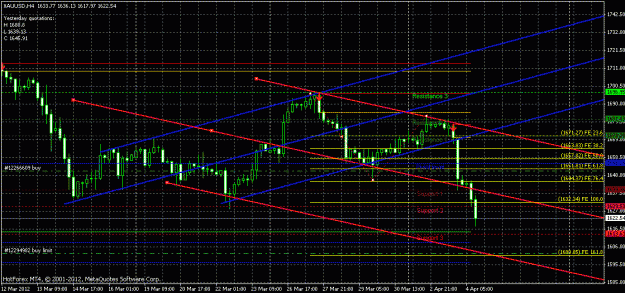
On H4 the fibo extension of 161.8 is exactly at 1600....as well as the bottom of the andrews pitch fork....we will likely hit 1600....before it turns around.
XAU/USD & XAG/USD - Gold & Silver Traders Thread
- dogbreath replied Apr 4, 2012
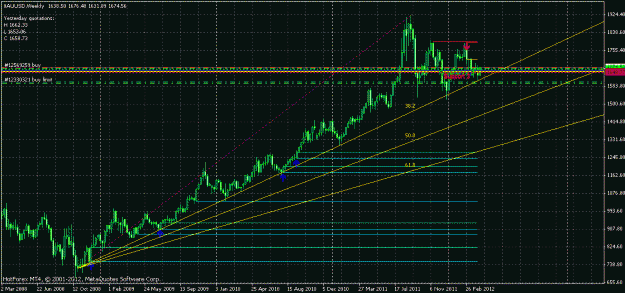
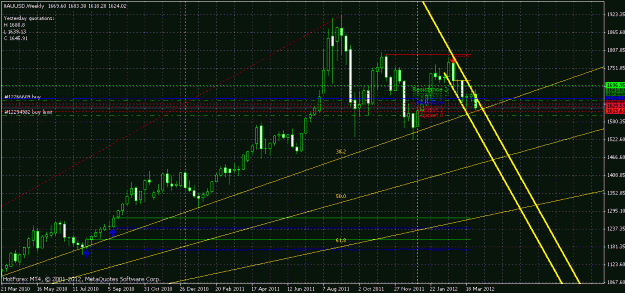
Looks like we are at the bottom on the weekly. has hit the 38.2 fibo fan line. Still in the yellow down channel. I am expecting pretty radical move up by the end of the week or starting next week. If it breaks below the 38.2 fib fan....we are diving ...
XAU/USD & XAG/USD - Gold & Silver Traders Thread
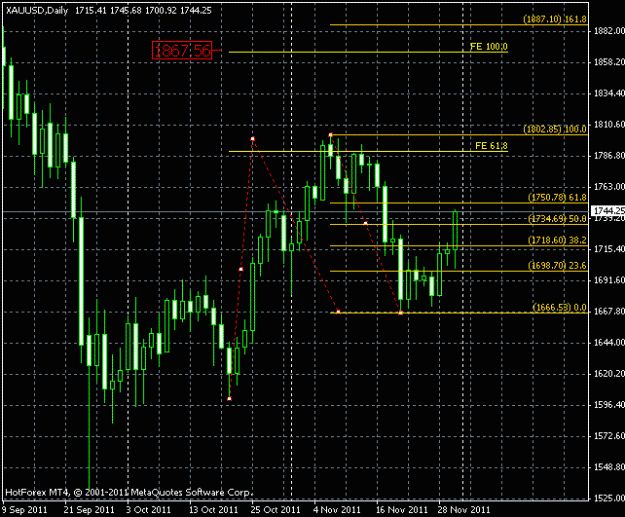
- dogbreath replied Mar 28, 2012
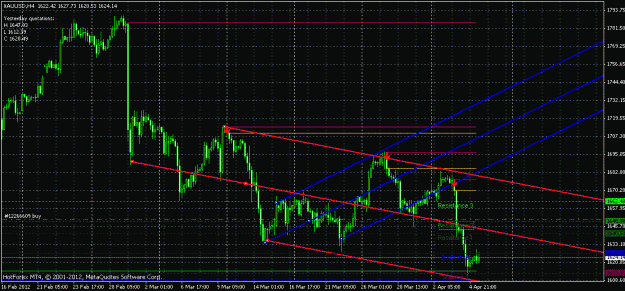
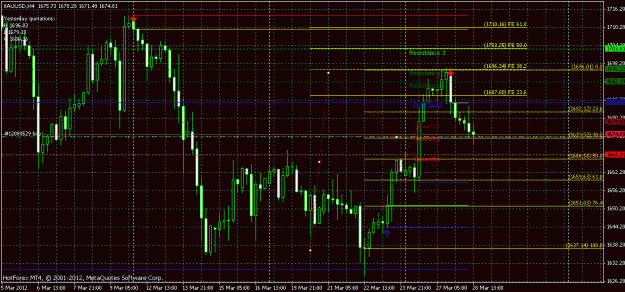
On H4 price is respecting 38.2 fibo retrace 1673.52...if it breaks thru...next stop is at the 50% retrace which would be 1666.58. Fibo expansion suggests a bullish break to the 50% fibo expansion...which would be 1703.25....which is also resistance ...
XAU/USD & XAG/USD - Gold & Silver Traders Thread
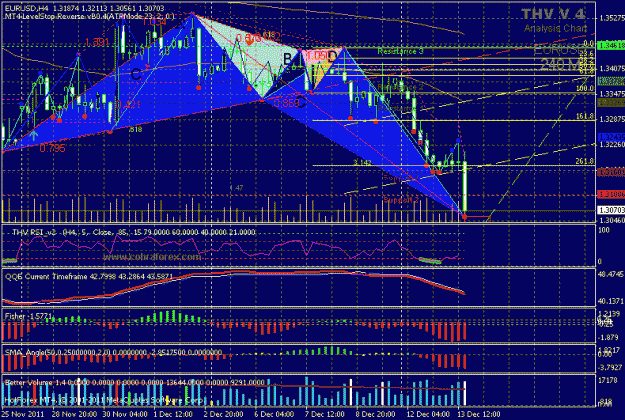
- dogbreath replied Dec 13, 2011
When you see a butterfly or bat wings.....They are blue triangles that are side by side. you should see one on the H4 chart right now....on eurusd That would be an indication for a buy.....you would wait until you are sure it has finished going down. ...
XAU/USD & XAG/USD - Gold & Silver Traders Thread
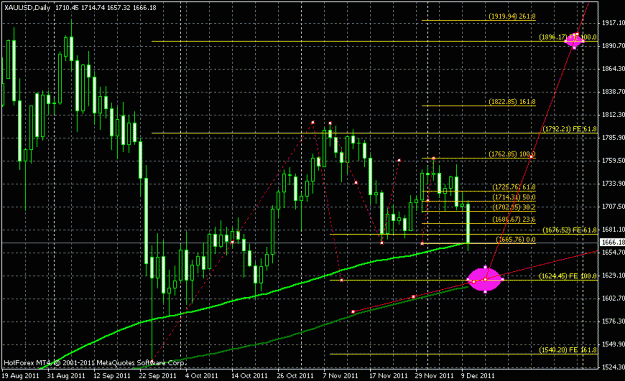
- dogbreath replied Dec 12, 2011
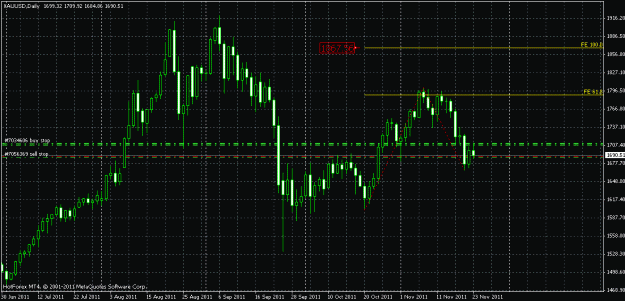
Looking at the daily chart: The fibo extension FE 100 is at around 1625....which would also line up with the 200dma on the 15th dec.....which is normally when it starts turning bullish...last 2 weeks in month. Since this is end of year too...I ...
XAU/USD & XAG/USD - Gold & Silver Traders Thread
- dogbreath replied Nov 30, 2011
Went long at 1735 on a retrace from the spike up. Has a $12 trailing stop on it....will TP at about 1750 resistance and wait for a retrace and sign to enter another long.....if I don't get in....will wait until 1752 to look for an entry point. TP ...
XAU/USD & XAG/USD - Gold & Silver Traders Thread
- dogbreath replied Nov 23, 2011
Daily chart It has retraced to the 61.8 fib ~ 1680. It is just above the 150sma....so I expect it could possible spike down to 1650 before it moves up. Resistance is at about 1725 the 38.2 fib....if it breaks thru that we should see a pretty steep ...
XAU/USD & XAG/USD - Gold & Silver Traders Thread
- dogbreath replied Nov 17, 2011
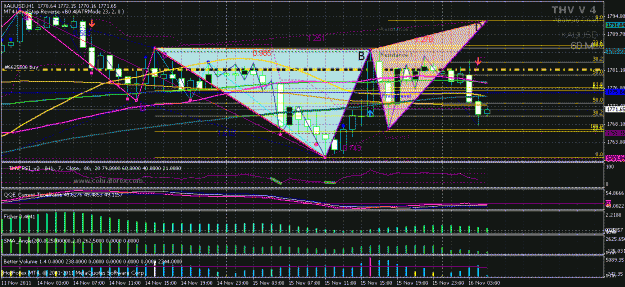
silver showing a fat butterfly too on the h4....so think you will be ok with your long.
XAU/USD & XAG/USD - Gold & Silver Traders Thread
- dogbreath replied Nov 17, 2011
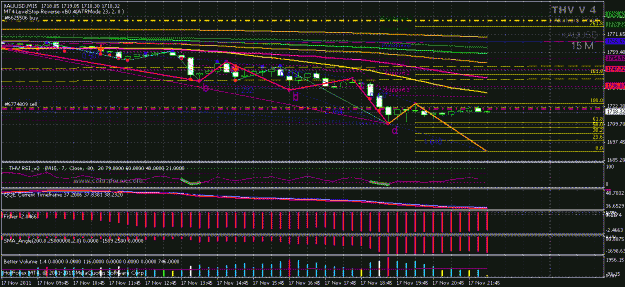
Looks like it wants to go down to 1700 on the 15min chart
XAU/USD & XAG/USD - Gold & Silver Traders Thread
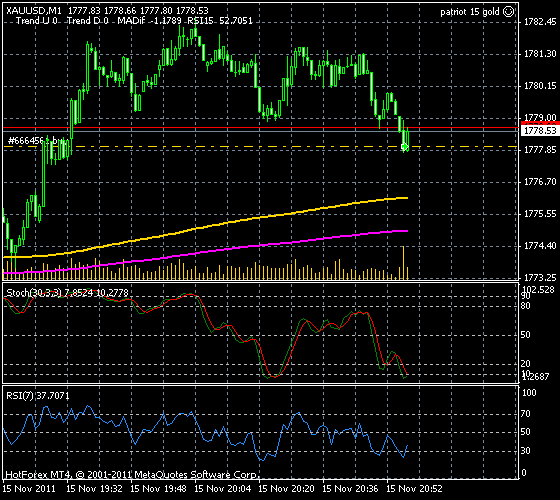
- dogbreath replied Nov 15, 2011
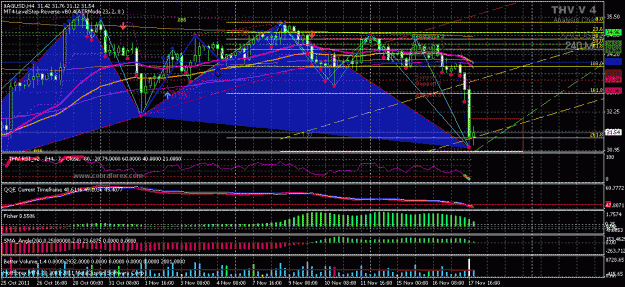
imho it is a little bit of a weak head n shoulders...but I do have a butterfly indicating that it will go up to 1793. but I also dont consider that butterfly to be too strong of an indication.
XAU/USD & XAG/USD - Gold & Silver Traders Thread
- dogbreath replied Nov 15, 2011
Opened another 2 buys...same criteria as above.
XAU/USD & XAG/USD - Gold & Silver Traders Thread
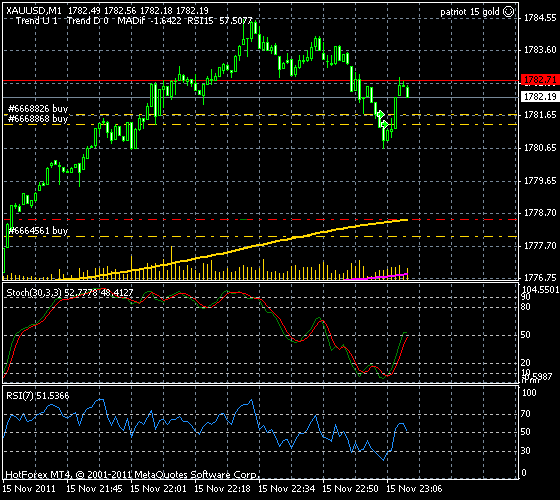
- dogbreath replied Nov 15, 2011
Opened a little scalp buy Based on: 15min RSI (period11) is >50 15min ema30-ema50>1.0 1min RSI(period 7)<30 1min Stoch(period 30)<10 Will ride it up with a 600pip trailing stop. Stop loss if 15min ema30<ema50
XAU/USD & XAG/USD - Gold & Silver Traders Thread
- dogbreath replied Nov 11, 2011
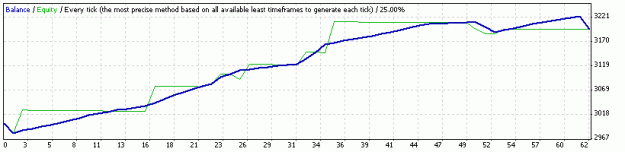
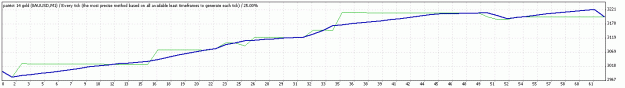
Or how about this one Rav....The month of august...starting with $10000. doubled my equity! What did you achieve in August?
XAU/USD & XAG/USD - Gold & Silver Traders Thread
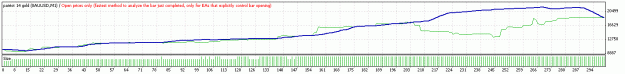
- dogbreath replied Nov 11, 2011
hehehe....I have developed a bot....it is doing well....it trades off of 1 min and 15min charts....so it scares me sometimes....but does a good job
XAU/USD & XAG/USD - Gold & Silver Traders Thread Basically the bullish or bearish trend is determined by the 30 and 50 exponential moving average ...