- Search Metals Mine
- 89 Results (3 Threads , 86 Replies )
-
 doctortyby replied Nov 19, 2012
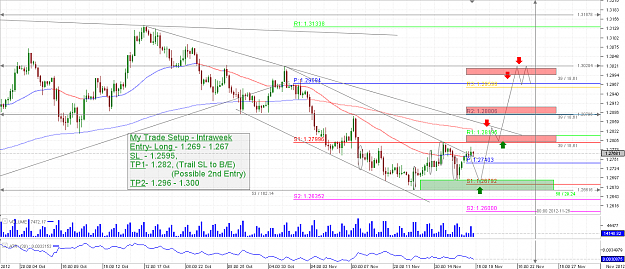
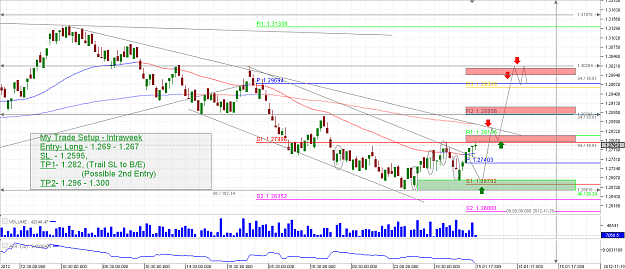
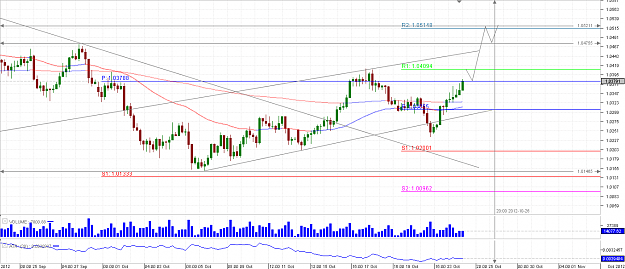
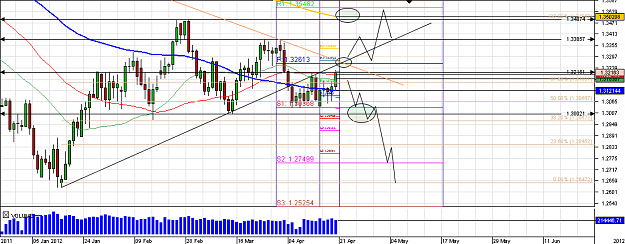
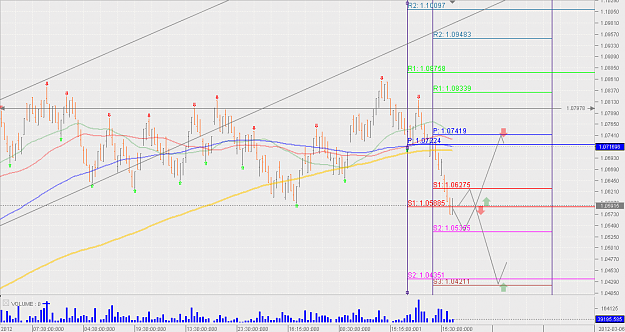
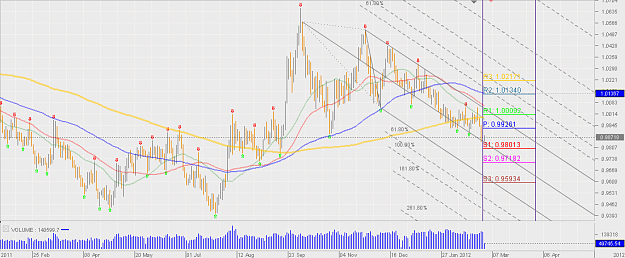
Eur/Usd 4 hours Chart analysis, outlook and trade setup
Outlook Webminars for Precious Metals and Majors
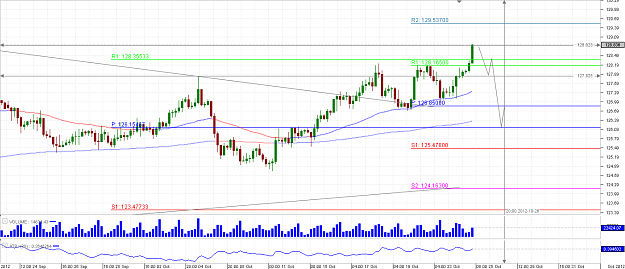
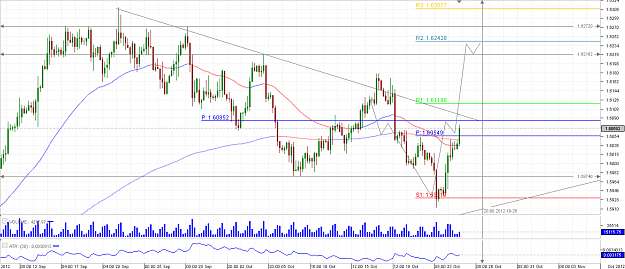
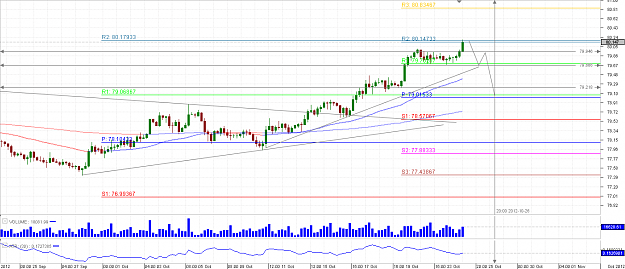
- doctortyby replied Oct 25, 2012
Webminar 25-26 October - Double Daily Outlook and Trade Setups — url Webminar 25-26 October - Double Daily Outlook and Trade Setups for Thursday and Friday - Technical analysis, - Fundamental analysis, - ORDER FLOW BOOK ANALYSIS - ...
Outlook Webminars for Precious Metals and Majors
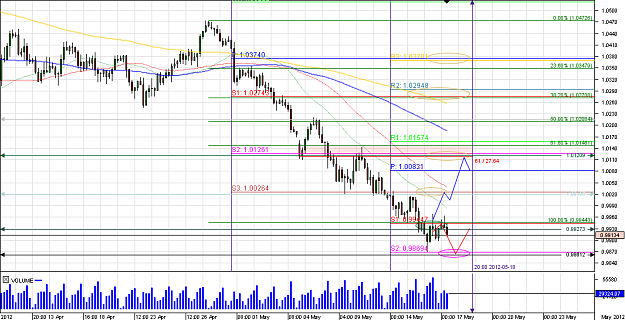
- doctortyby replied May 17, 2012
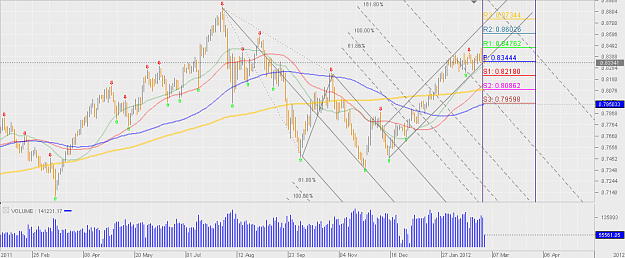
>> 5) Eur/Usd - 4 hours Chart - (17.05.2012 Update) — >> 5) Eur/Usd - 4 hours Chart - (17.05.2012 Update)>> Bearish Probability Key Levels: >>1.285 - 1.282 area -Weekly S1 Pivot and the Monthly S2 Pivot. (1st Level Key Level), >>1.276 - ...
Analysis for Major Pairs with Charts (eur/usd,usd/jpy,usd/chf,gbp/usd..)

- >> 5) Eur/Usd - 4 hours Chart - (17.05.2012 Update)Started May 17, 2012|Commercial Content|0 replies

>> 5) Eur/Usd - 4 hours Chart - (17.05.2012 Update)>>- Bullish Probability Key Levels: >>1.285 - ...
- doctortyby replied May 17, 2012
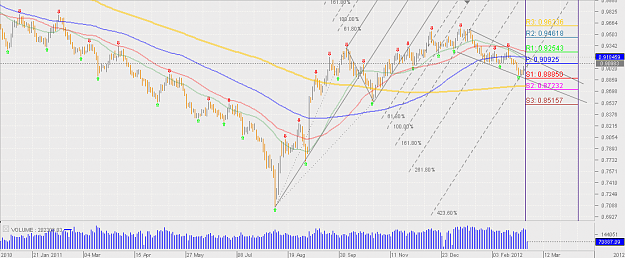
>> 4) Aud/Usd - 4 hours Chart - (17.05.2012 Update) — >> 4) Aud/Usd - 4 hours Chart - (17.05.2012 Update)>> - Bullish Probability Key Levels: >>0.994 - 0.993 area -resistence from the 9th of August 2011, Weekly S1 Pivot, >>1.002 - ...
Analysis for Major Pairs with Charts (eur/usd,usd/jpy,usd/chf,gbp/usd..)
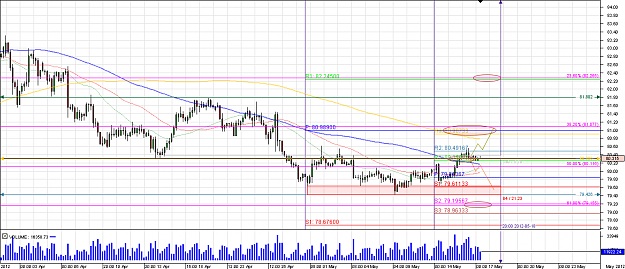
- doctortyby replied May 17, 2012
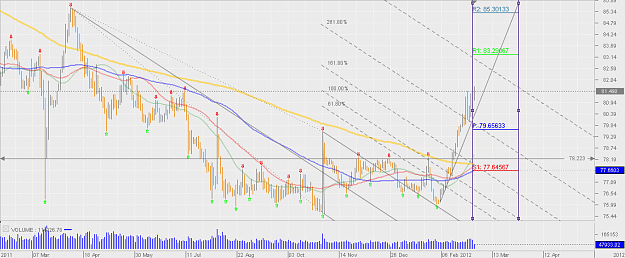
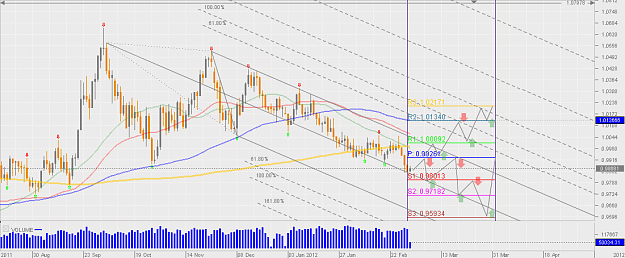
>> 3) Usd/Jpy - 4 hours Chart - (17.05.2012 Update) — >> 3) Usd/Jpy - 4 hours Chart - (17.05.2012 Update)>> - Bullish Probability Key Levels: >>80.49 - Weekly R2 Pivot, >>80.90 - 81.00 area - Key confluence between the 200 SMA, Weekly R3 ...
Analysis for Major Pairs with Charts (eur/usd,usd/jpy,usd/chf,gbp/usd..)
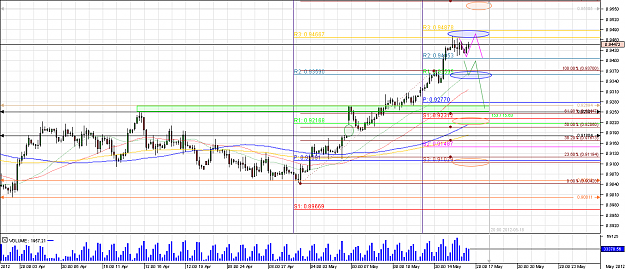
- doctortyby replied May 17, 2012
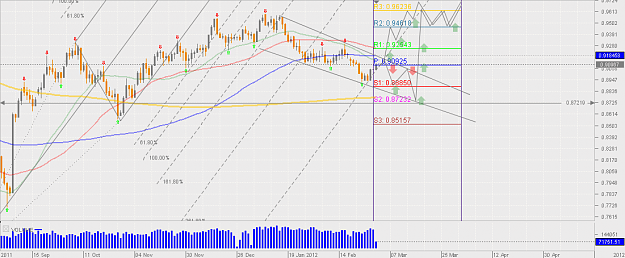
>> 2) Usd/Chf - 4 hours Chart - (17.05.2012 Update) — >> 2) Usd/Chf - 4 hours Chart - (17.05.2012 Update)>>- Bearish Probability Key Levels: >>0.940 - Weekly R2 Pivot Point, >>0.936 - Weekly R1 Pivot and the Monthly R2 Pivot, (1st Level ...
Analysis for Major Pairs with Charts (eur/usd,usd/jpy,usd/chf,gbp/usd..)
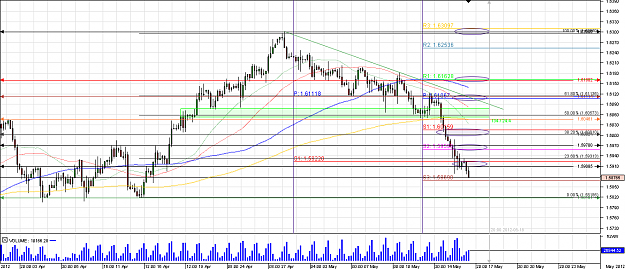
- doctortyby replied May 17, 2012
1)Gbp/Usd - 4 hours Chart - (17.05.2012 Update) — 1)Gbp/Usd - 4 hours Chart - (17.05.2012 Update) - Bullish Probability Key Levels: >>1.611 -Monthly Pivot, Weekly Pivot, the Minor Trend Trendline,61.8% Fibonacci, (2nd Level Key Level) >>1.616 ...
Analysis for Major Pairs with Charts (eur/usd,usd/jpy,usd/chf,gbp/usd..)
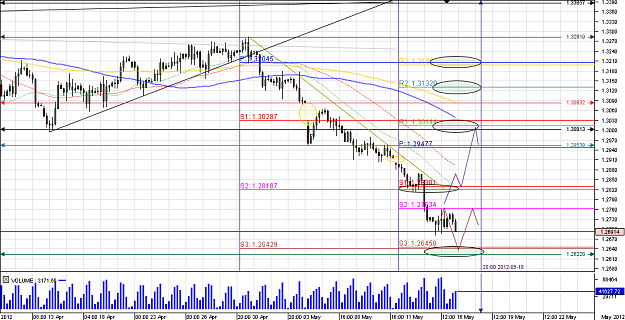
- doctortyby replied Apr 22, 2012
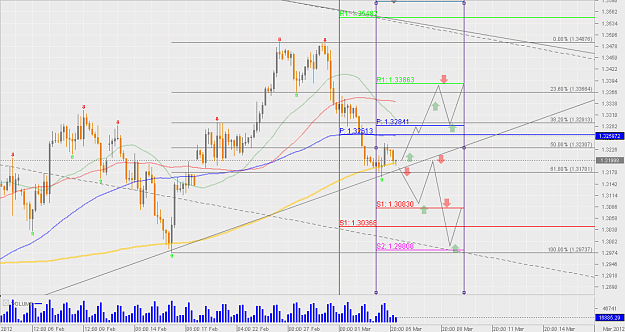
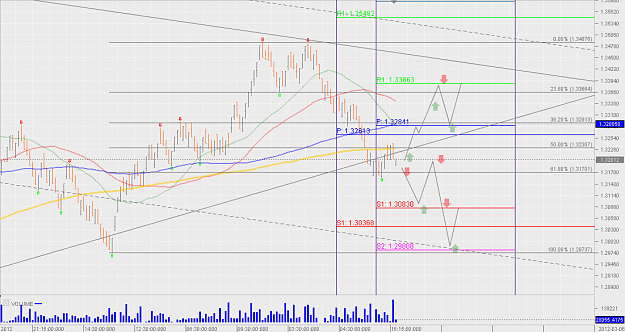
1)Eur/Usd-Daily chart (23.04 Update) — 1)Eur/Usd-Daily chart (23.04 Update)- Bullish probability - KEY LEVELS to watch >> 1.321 (1st level Key-Level, the last Resistence, confluence with the 50 DMA)<<, >> 1.326 (2nd level Key-Level, confluence ...
Analysis for Major Pairs with Charts (eur/usd,usd/jpy,usd/chf,gbp/usd..)
- doctortyby replied Mar 6, 2012
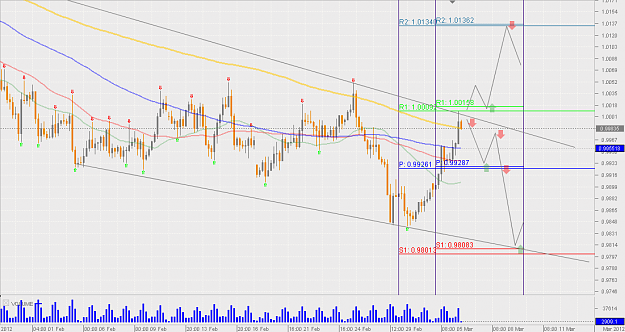
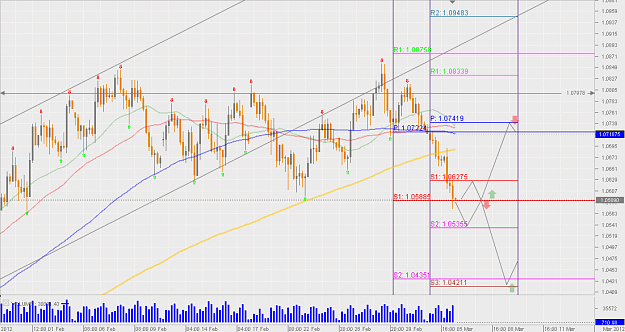
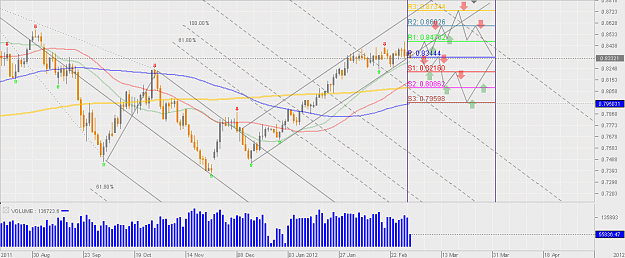
2) USD/Chf -4 Hours Chart in analogy with the 35 Pips Range Bars Chart. — >> 2) USD/Chf - Weekly View - 06-09th of March - 4 Hours Chart in analogy with the 35 Pips Range Bars Chart. Bullish Probability - The Important Key level that holds the ...
USD/CHF
- doctortyby replied Mar 6, 2012
7) Nzd/USD-4 Hours Chart in analogy with the 35 Pips Range Bars Chart. — >> 7) Nzd/USD - Weekly View - 06-09th of March - 4 Hours Chart in analogy with the 35 Pips Range Bars Chart. Bearish Probability - If 0.816 Level (Weekly S2 Pivot) will ...
NZD/USD
- doctortyby replied Mar 6, 2012
6) USD/Cad -4 Hours Chart in analogy with the 35 Pips Range Bars Chart. — >> 6) USD/Cad - Weekly View - 06-09th of March - 4 Hours Chart in analogy with the 35 Pips Range Bars Chart. Bearish Probability - if price will find resistence at 1.00 ...
USD/CAD
- doctortyby replied Mar 6, 2012
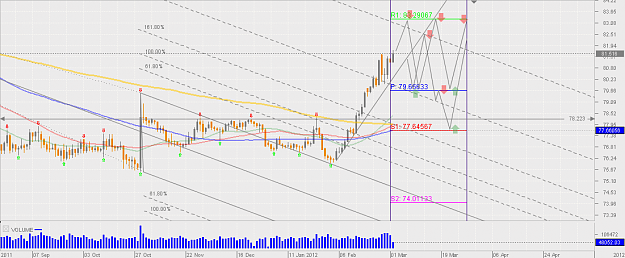
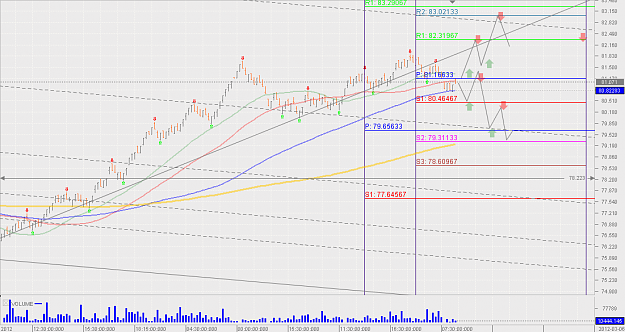
Usd/Jpy -4 Hours Chart in analogy with the 15 Pips Range Bars Chart. — >>5) USD/JPY - Weekly View - 06-09th of March - 4 Hours Chart in analogy with the 15 Pips Range Bars Chart. Bearish Probability - If the breakout of the 81.17 Level (Weekly ...
USD/JPY Discussion
- doctortyby replied Mar 6, 2012
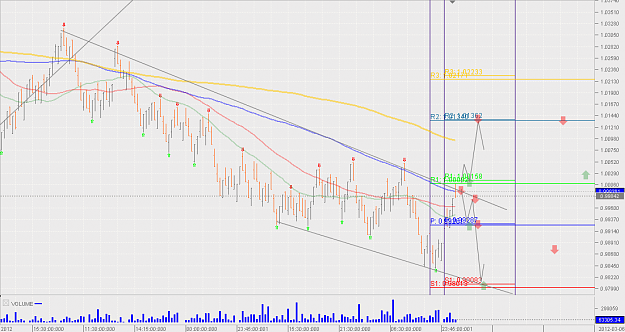
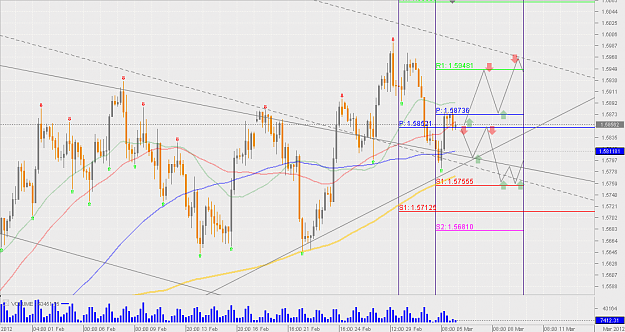
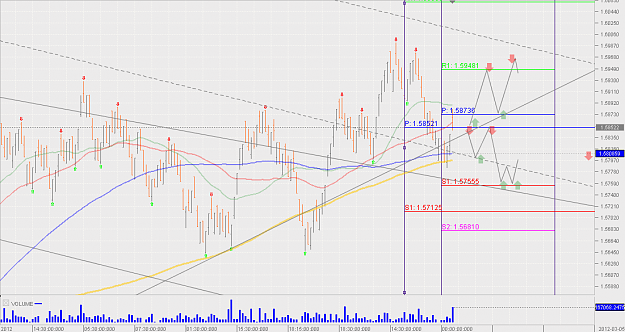
3) GBP/USD -4 Hours Chart in analogy with the 35 Pips Range Bars Chart. — >> 3) GBP/USD - Weekly View - 06-09th of March - 4 Hours Chart in analogy with the 35 Pips Range Bars Chart. Bearish Probability - Price is trending between 1.585-1.587 ...
Cable Update (GBPUSD)
- doctortyby replied Mar 6, 2012
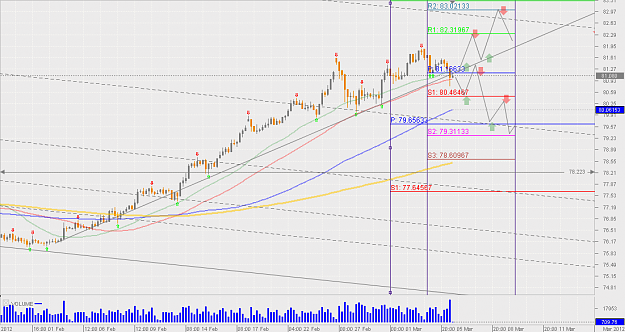
4) Aud/USD -4 Hours Chart in analogy with the 35 Pips Range Bars Chart. — >> 4) Aud/USD - Weekly View - 06-09th of March - 4 Hours Chart in analogy with the 35 Pips Range Bars Chart. Bearish Probability - Price has been moving sideways in the ...
AUD/USD
- doctortyby replied Mar 6, 2012
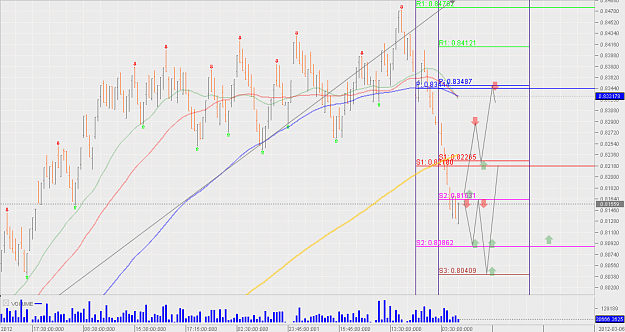
EUR/USD -4 Hours Chart in analogy with the 35 Pips Range Bars Chart. — >> 1) EUR/USD - Weekly View - 06-09th of March - 4 Hours Chart in analogy with the 35 Pips Range Bars Chart. Bearish Probability - We can clearly see an important Key Area ...
EurAnalysis
- doctortyby replied Mar 3, 2012
7) Nzd/USD - Monthly view - March - Daily Chart, — 7) Nzd/USD - Monthly view - March - Daily Chart, To your success, Doctortyby - Tiberiu
NZD/USD
- doctortyby replied Mar 3, 2012
4) USD/ Chf - Monthly View - March - Daily Chart, — 4) USD/ Chf - Monthly View - March - Daily Chart, To Your success, Doctortyby - Tiberiu
USD/CHF
- doctortyby replied Mar 3, 2012
6) USD/Cad - Monthly View - March - Daily Chart, — 6) USD/Cad - Monthly View - March - Daily Chart, To your success, Doctortyby - Tiberiu
USD/CAD
- doctortyby replied Mar 3, 2012
5) USD/JPY - Monthly View- March - Daily Chart, — 5) USD/JPY - Monthly View- March - Daily Chart, To Your success, Doctrotyby - Tiberiu
USD/JPY Discussion