- Search Metals Mine
- 30 Results
-
 dljonesFan replied Jun 28, 2017
Good entry Evak! image greets C
Auction Market Value Theory & Analytics
- dljonesFan replied Oct 21, 2016
But it is good criticism. Its not to offend you. You will get better if you understand that.
Auction Market Value Theory & Analytics Your quote is from the cbot market profiling manual. Thats mp trading method. Have you read the "Value-Based Power Trading" book by Jones? There you ...
- dljonesFan replied Oct 1, 2016
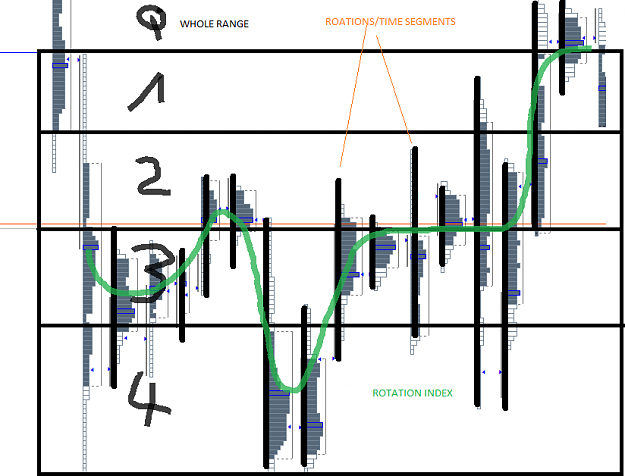
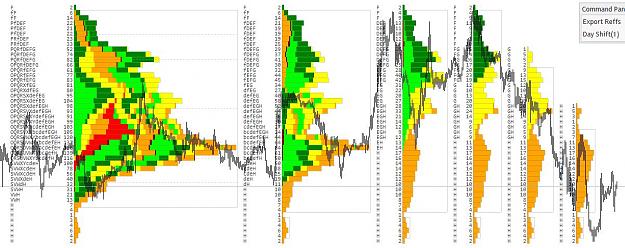
Dear Jer21, ROTATION INDEX PRINCIPLE in pic: image Q="quadrant of close"-> quadrant of the whole range or range/4= 4 equal ranges within the whole range. Measured from day 1 to 4 (for example). Daily Rotations=daily ranges from high to low, ...
Auction Market Value Theory & Analytics
- dljonesFan replied Jul 15, 2016
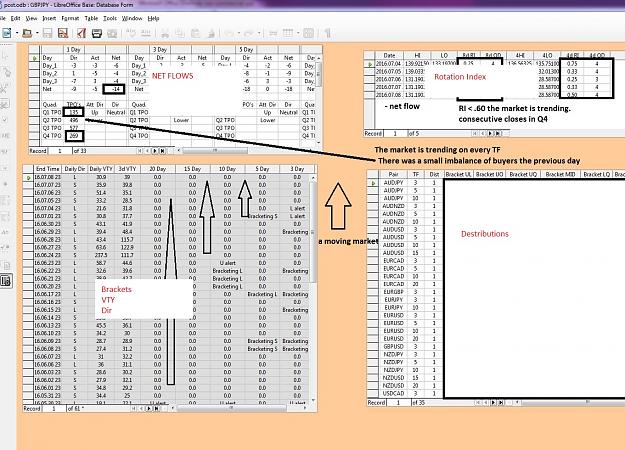
I think JP is asking for the tables, presented by Mzvega here in this forum. For example daily net low, bracketing table... "I think it may be easy if I address my questions relating to the spread sheet, that way it will shorten my learning curve ...
Auction Market Value Theory & Analytics
- dljonesFan replied May 2, 2016
Ok then I have to adjust my settings every day. image
Auction Market Value Theory & Analytics
- dljonesFan replied Apr 29, 2016
It looks like standard settings... image
Auction Market Value Theory & Analytics
- dljonesFan replied Mar 21, 2016
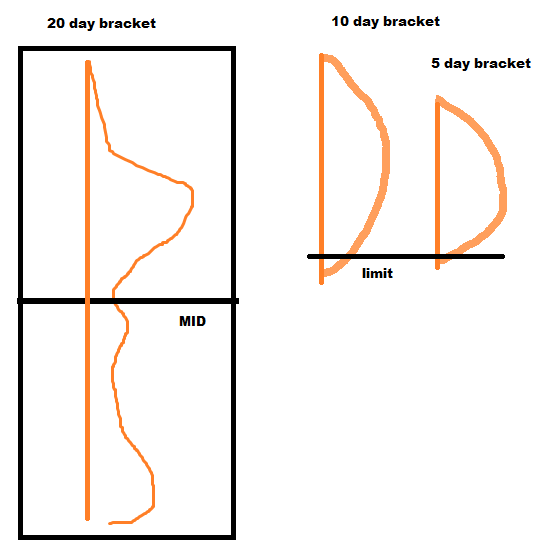
Hey Mzvega, hope you had a nice weekend. I have a question. Responsive trading=Selling Upper quadrant to the MID of the bracket (MID=target). If the 20,10 and 5 are bracketing and the 10 and 5 brake down from the top to the bottom of a expanded 20 ...
Auction Market Value Theory & Analytics
- dljonesFan replied Mar 8, 2016
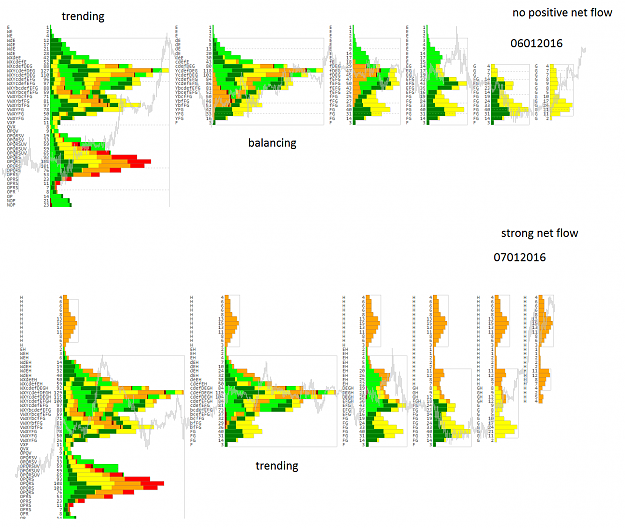
1. These "ebb & flow patterns" are the waves? Markets move in waves/units as Jones would say. So you detect them on the market flow data is that right? Because I think Jones dont use graphical patterns like Steidelmayer do (P and b patterns). 2. I ...
Auction Market Value Theory & Analytics
- dljonesFan replied Jan 13, 2016
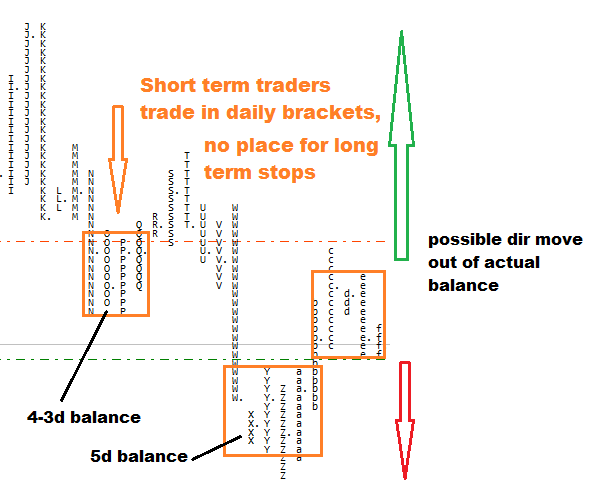
Thank you Mzvega. The 3 questions are all about the details in bracket breakout trading. Or in other words I want to get better in the timing of breakouts. 1. Can you explain to me why greater TFF = activity+1 (daily net flow)? Isnt greater tff a ...
Auction Market Value Theory & Analytics
- dljonesFan replied Jan 8, 2016
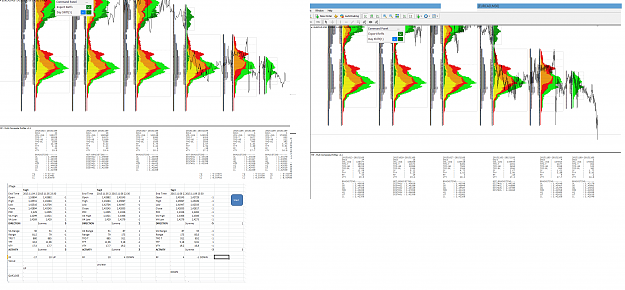
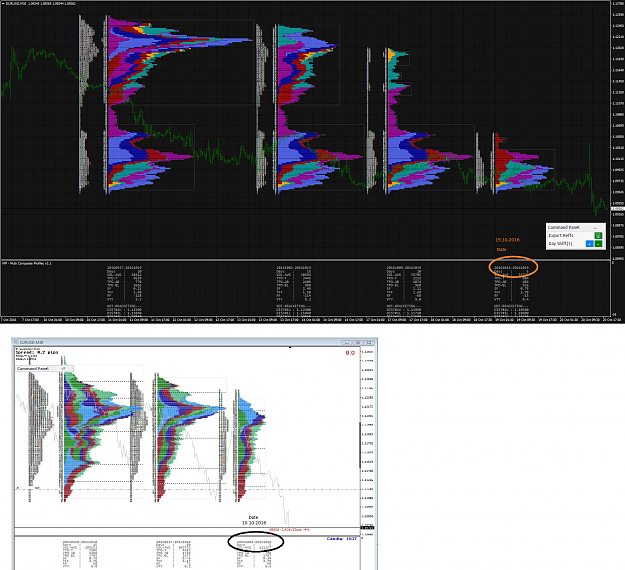
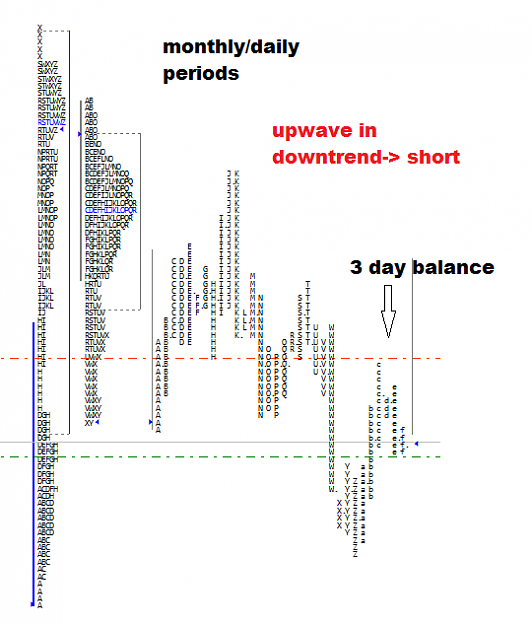
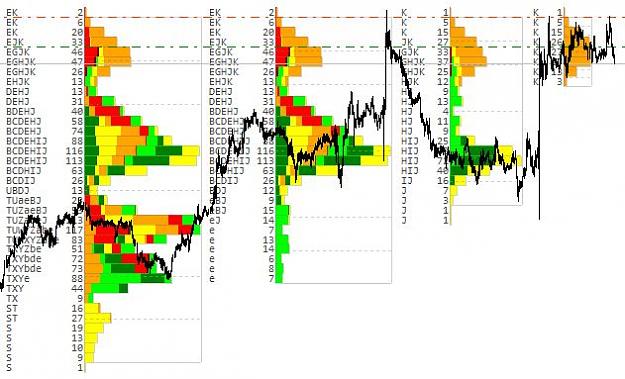
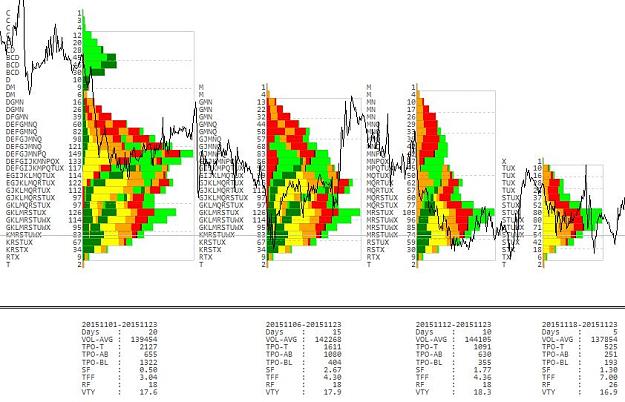
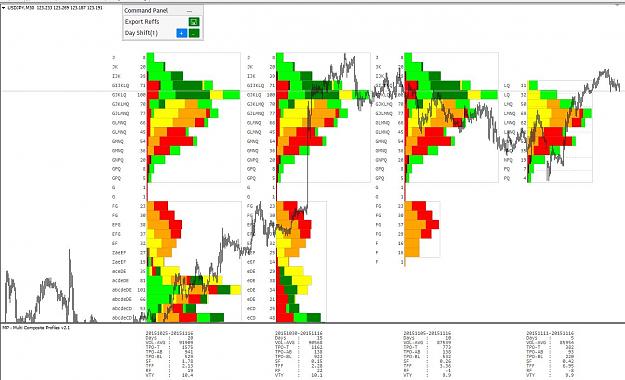
Thank you. Ok then I will work on my analysis skills. Would you trade 20day bracket breakouts with trending 10 and 5? Or wait for 5 day bracket after the 20 day breakout? For example there is a 20day test CADCHF: image Iam not shure how to deal ...
Auction Market Value Theory & Analytics
- dljonesFan replied Dec 11, 2015
Hi mzvega, nu=nzdusd(?) is not on my list for breakout, because shows signs of responsive selling (seller tpos), upper tail (could be a sign of inituative selling) and buying activity is shutting down. The market is currently in short term hands, ...
Auction Market Value Theory & Analytics
- dljonesFan replied Dec 10, 2015
Wont happen here Mzvega, we will stick to Jones method. Observed aud/cad but missed entry. I forgot to set the orders.
Auction Market Value Theory & Analytics I take my profits on uj, because the 5day last node upper limit getting touched. aj and nj showed me strong "corrections" in ...
- dljonesFan replied Dec 9, 2015
Hi! usd/jpy looks nice for days, finally breakdown... image greetings C
Auction Market Value Theory & Analytics
- dljonesFan replied Dec 7, 2015
Mzvega, thank you for posting!
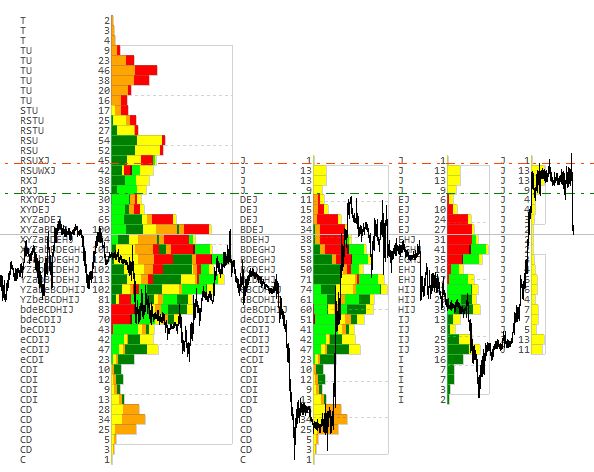
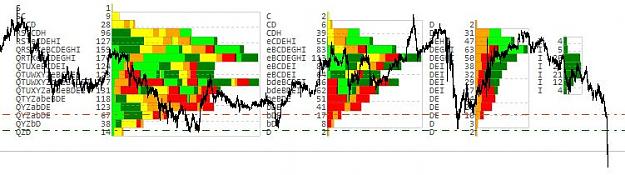
Auction Market Value Theory & Analytics I have read all the excerpts. This week I will go back into live trading... USDCAD looks interesting... image greetings Chris
- dljonesFan replied Nov 24, 2015
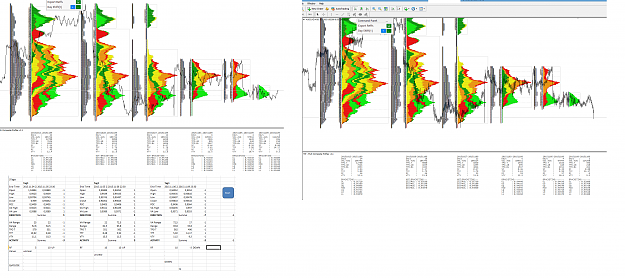
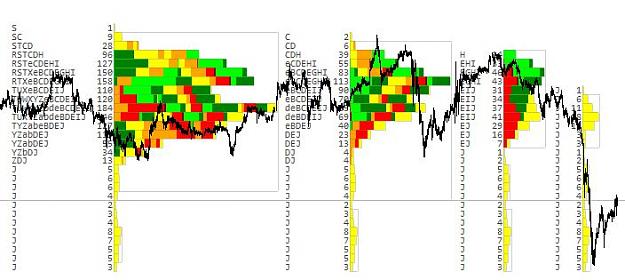
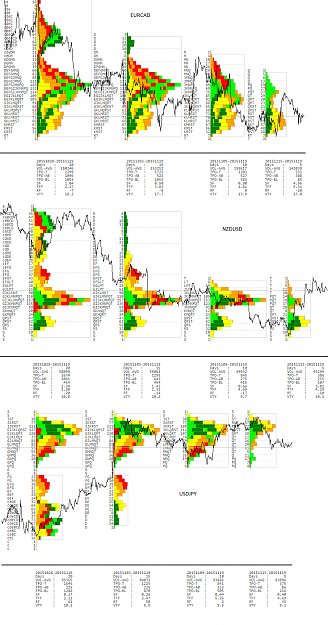
Hi, I think eurcad looks interesting, because of its high TFF. VTY is low and stable, "Vol" down, the bell looks good and buyer -seller tpos nearly balanced. With some activity that one could be a nice trade. What do you think? image still ...
Auction Market Value Theory & Analytics
- dljonesFan replied Nov 22, 2015
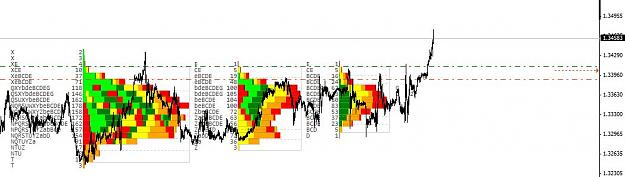
Hi, from my analysis today these ones looking good: eurcad,nzdusd,usdjpy. Thier behaviour suggest a change in value in the next time. So I think thier is an opportunity. image greetings c
Auction Market Value Theory & Analytics
- dljonesFan replied Nov 17, 2015
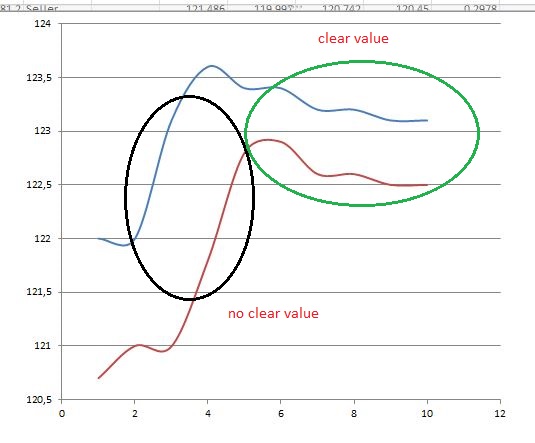
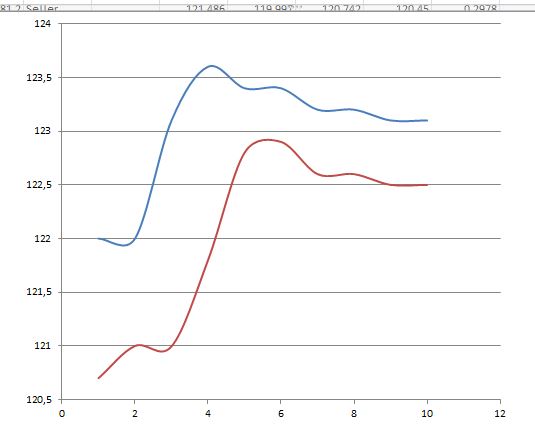
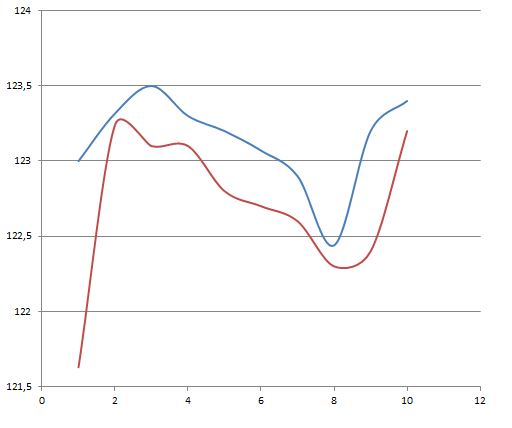
Thank you mzvega! I think that value rule is perfectly proved by the grapihc and makes it visible: image The "value is hunting" the price. Price leads. After the trend, price stopps, value can be calculated.
Auction Market Value Theory & Analytics
- dljonesFan replied Nov 17, 2015
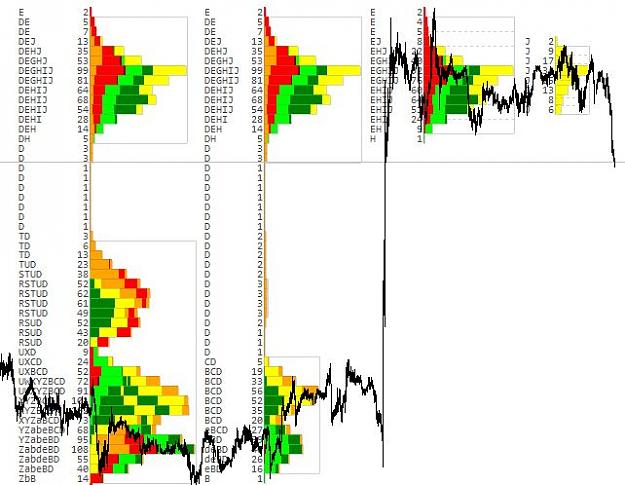
USD/JPY 3 day net flow/ Diret.: UP, Act.: DOWN 17.11.2015 day flow compared to last 20 day range Range Ext: UP TPO Balance: clear Seller, too few buyer "Vol": Decreasing-> no continuation Val: UP ValRange: Decreasing, near 20 low extreme POC:UP RF - ...
Auction Market Value Theory & Analytics
- dljonesFan replied Nov 17, 2015
"5day correction vty is less then 20day avg [...]" (Evak) If the VTY would be higher, then its a sign for breakdown? "Flow down for the last 3 days but value contracting on top of a larger uptrend move[...]" (Evak) How do you analyse your value ...
Auction Market Value Theory & Analytics
- dljonesFan replied Nov 10, 2015
Hi mzvega, thank you for that information. Today I viewed some programming languages. I think JAVA is nice. Python seems a little bit confusing to me.
Auction Market Value Theory & Analytics In the next days I will try to get some skills in JAVA. But the most importand thing for me ...