- Search Metals Mine
- 182 Results
- clc4x replied Apr 28, 2016
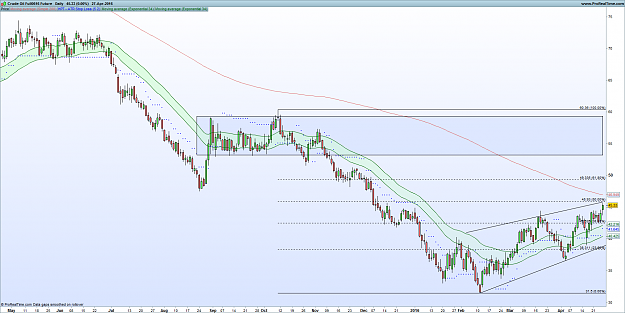
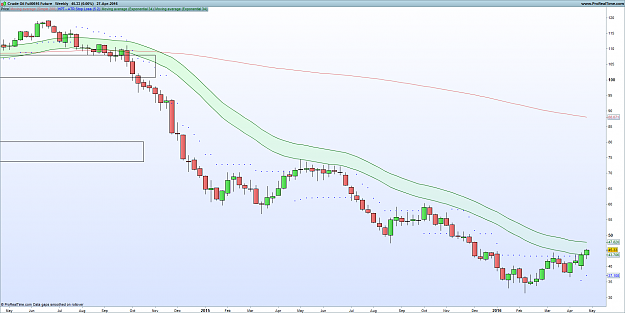
Source: url image The above is the daily chart of Crude Oil. Few observations on crude oil price movement: In the daily chart, Crude Oil formed an ascending channel which indicates an uptrend. Nevertheless, if we look at the weekly chart as ...
Trading Crude Oil with price action + indicator
- clc4x replied Feb 9, 2012
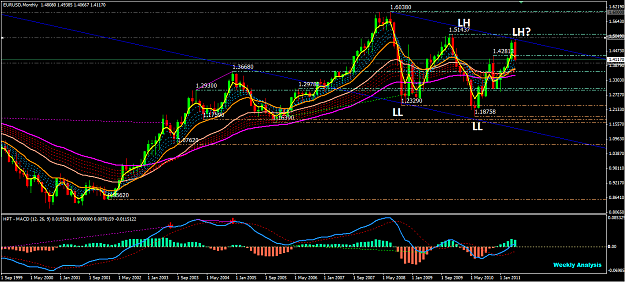
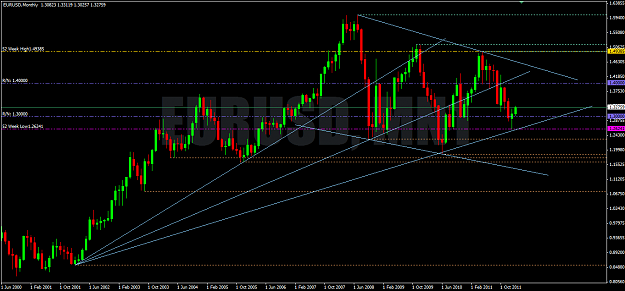
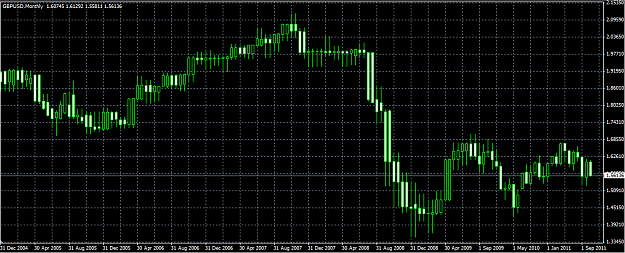
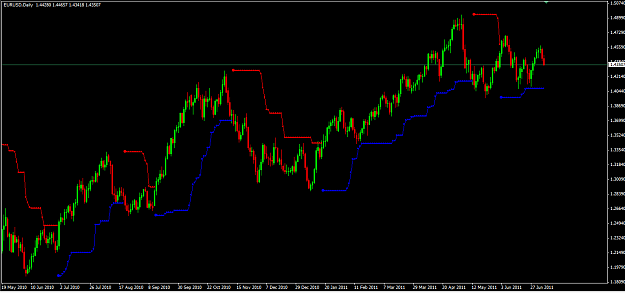
Different perspective in analysis may yield different view. If we refer to the following monthly chart, is EUR/USD bull or bear? image
Sonic R. System
- clc4x replied Dec 14, 2011
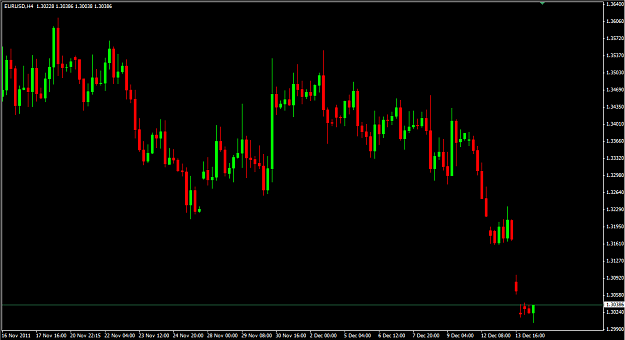
Data feed problem — When I connect to FXCM-USDDemo01, image Basically, all major pairs got very big gaps. Looks like your data feed got problem. As for FXCM-AUDDemo01, there is no problem. image
FXCM Discussion
- clc4x replied Dec 7, 2011
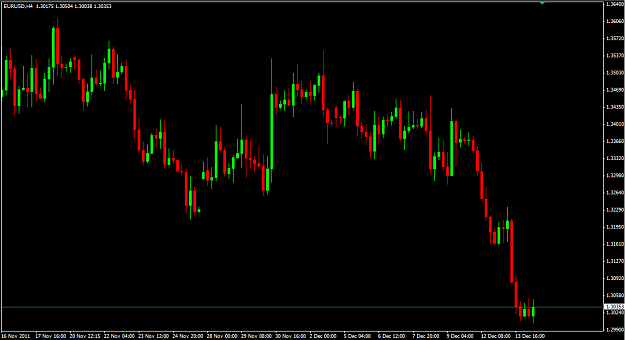
Monthly Chart - Duplicate Data — I am trying "FXCM MT4 powered by BT". I found that some data in the monthly chart are duplicate. image I deleted the history data and reload the chart. Still the same. image
FXCM Discussion
- clc4x replied Aug 22, 2011
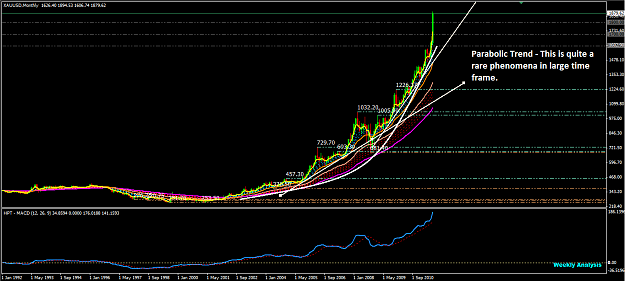
Gold - Parabolic Trend (Monthly Chart) — image
XAU/USD & XAG/USD - Gold & Silver Traders Thread
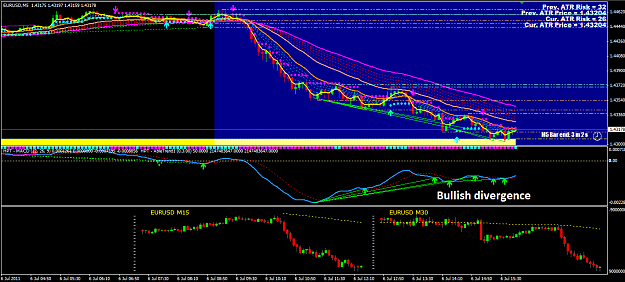
- clc4x replied Jul 6, 2011
something to share with you guys which is equivalent to Donchian image
Trading using Donchian Channels

- clc4x replied May 13, 2011
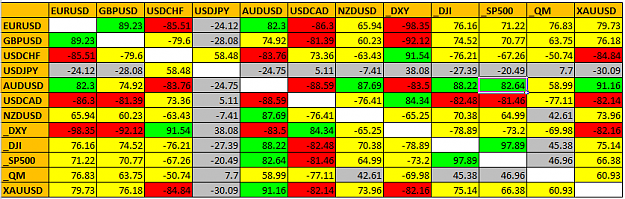
Updated Correlation Heat Map (as of 14 Mar 2011) — image
Hedge and Correlation Strategy