- Search Metals Mine
- 27 Results
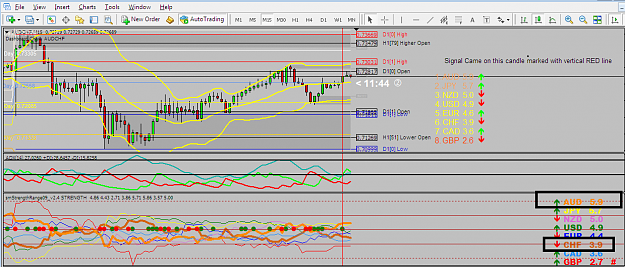
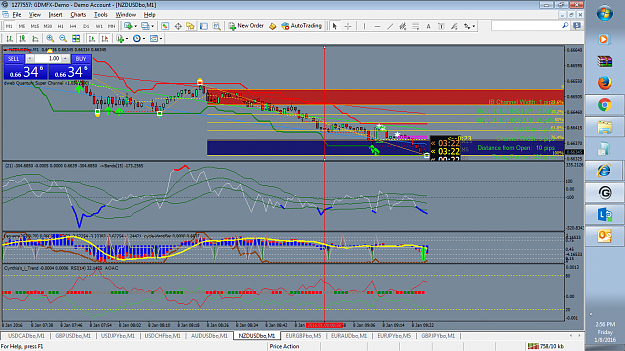
- bedayan replied Jun 24, 2016
Hi Swingman, I was just testing scalping strategy which you developed. I think signal is not getting filtered with currency strength. When signal comes both currency in the pair should be top 3 or bottom 3 currency in the table. For example check ...
As complicated as necessary: Highest Open / Lowest Open Trade
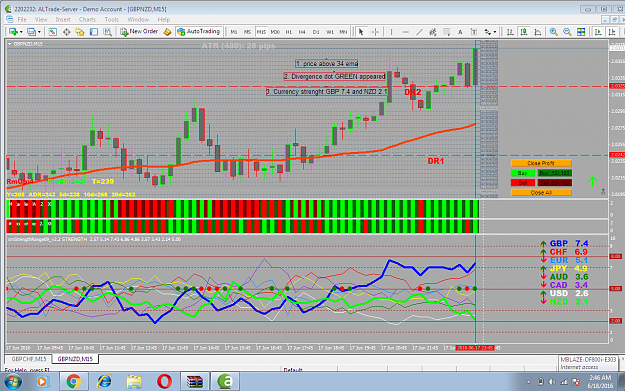
- bedayan replied Jun 17, 2016
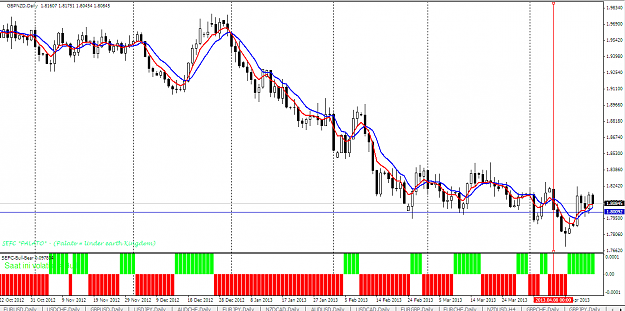
Hi Check this GBPNZD vertical line. Call trader. In binary option 15 min call trade will work very well. But singal should come moment divergence dot comes with satisfied with other criteria. If we wait for candle close then that will be too later. ...
As complicated as necessary: Highest Open / Lowest Open Trade
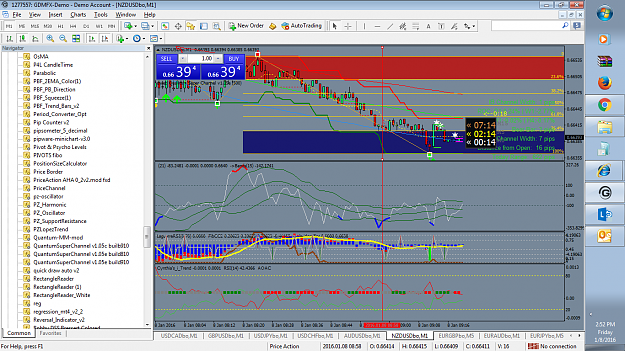
- bedayan replied Jan 8, 2016
Hi Sriloba, I have one question regarding Cynthia I trend. When you put another screen beside its showing overbought. but when put in full screen chart its not showing overbought. Can you suggest what needs to be done in this case. For example see ...
Come Surfing Fx With Me System
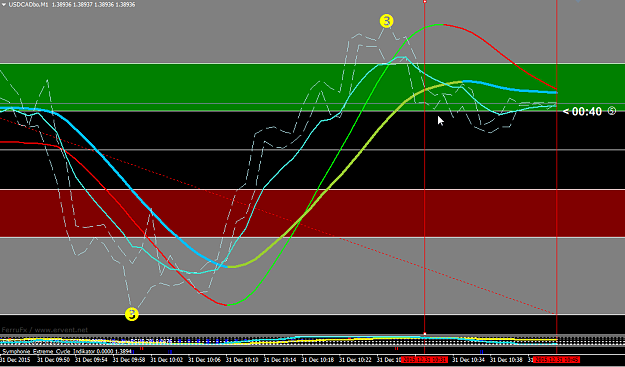
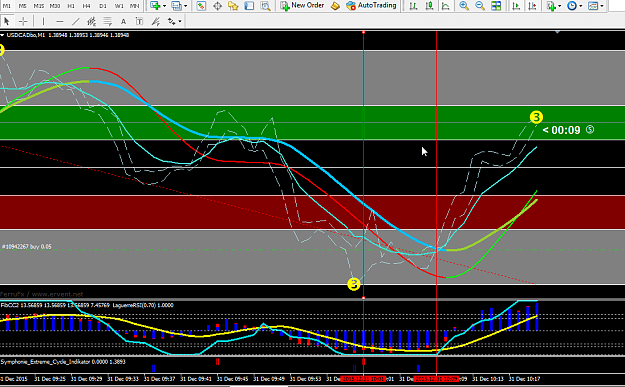
- bedayan replied Dec 31, 2015
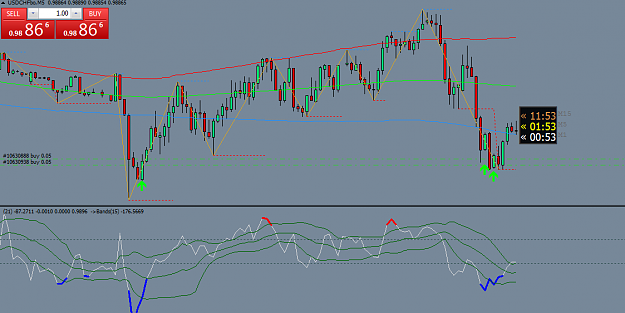
Another win put USDCAD 15 min. Entry first RED and line Exist second RED line.Want to know more about higher time frame context. I have taken all this trade because in 5 minute chart price is near overbsold or overbaought zone. So taken this call ...
Forex | The World of Johnny Kobol 007
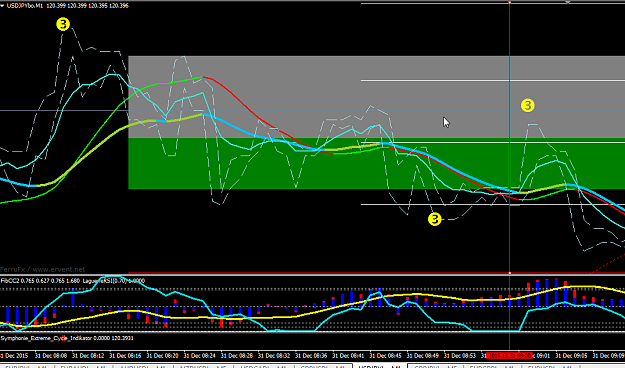
- bedayan replied Dec 31, 2015
I am following landline way of trading only doing reversal. Yesterday I was 8-3 today 5-1 in binary option 15 min expiry in 1 min chart. I think it will work on less expiry also. But went through the thread. But dot understand what context you are ...
Forex | The World of Johnny Kobol 007
- bedayan replied Dec 16, 2015
Hi Sriloba, Its drawing one line at top and one line in bottom. Not so many lines. Please see below screenshot. How so many lines are drawn?
Forex | The World of Johnny Kobol 007
- bedayan replied Apr 21, 2014
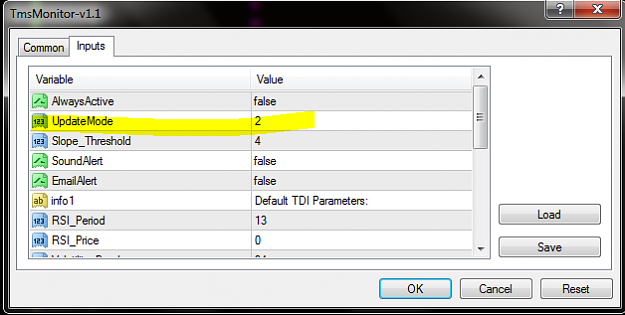
Hi Emmanuel, what is the purpose update mode in the following screenshot? I marked with yello. its seems it updating always real time. If I want it to update only after candle close then what setting I need to do?
Monitor for 'Trading Made Simple' system
- bedayan replied Apr 21, 2014
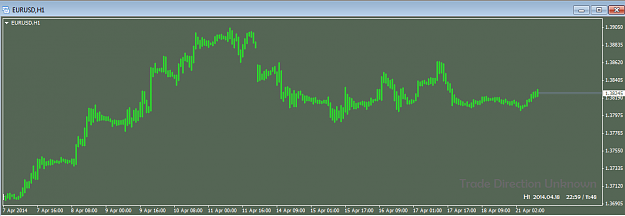
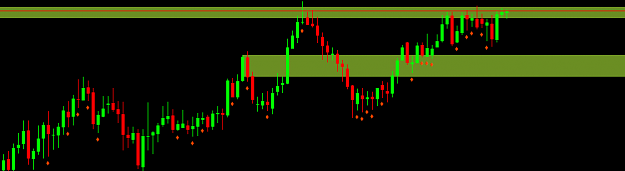
Hi Dada, I dot see Red and other candles as you shown in earlier chart. I only can see green candle. I am using FXDD MT4 platform
Price Action in Day Trading by Dadas
- bedayan replied Oct 21, 2013
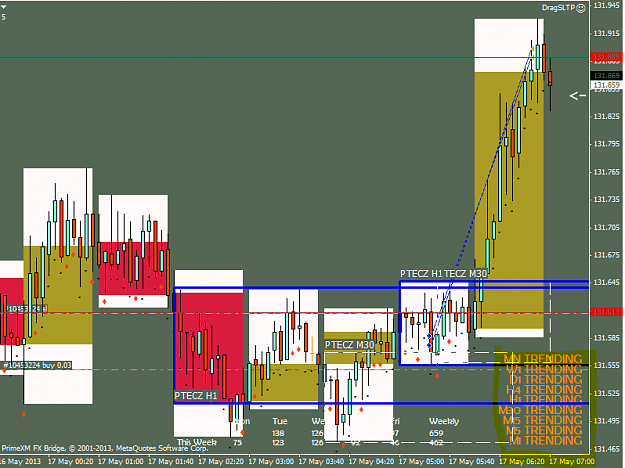
Hi Dadas, What do you say about my PTECZ plotting.I am looking for short from above PTECZ and long from below PTECZ. For short PTECZ I went back till 30.09.2011 to plot it. Your comments are welcome
Price Action in Day Trading by Dadas
- bedayan replied Oct 21, 2013
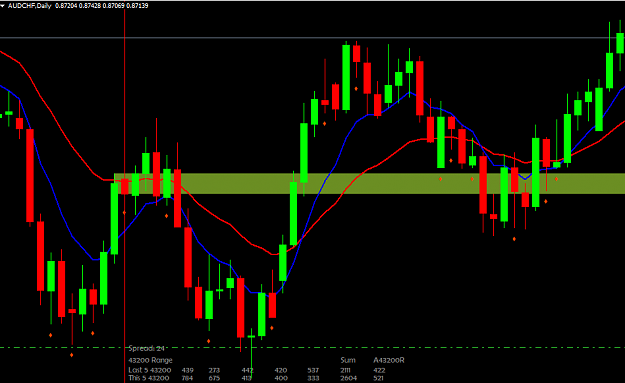
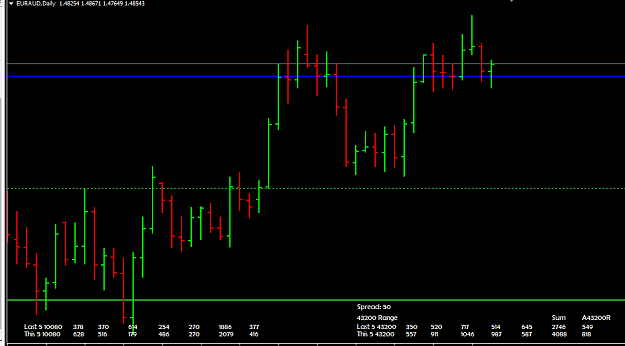
Hi All, I do not understand what do you mean by high to low till previous trend candle.I just try to use it in AUDCHF daily chart and plot on a ptecz candle as show in screenshot.But zone plotted fro high of previous trend candle till close of the ...
Price Action in Day Trading by Dadas
- bedayan replied Sep 10, 2013
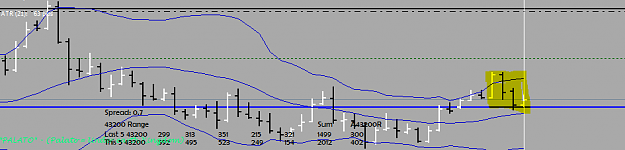
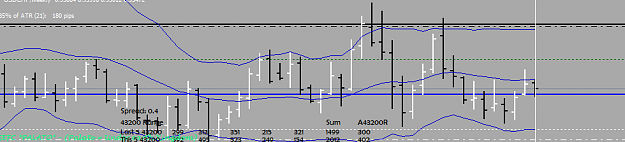
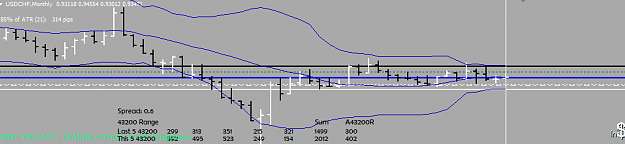
Hi 60 Minuteman, I have a question regarding your chart analysis.As first screenshot in daily chart its two bar engulfing in USDCHF But in Weekly chart in second screenshot previous bar is close up candle. In monthly previous month candle close up ...
H4 Power
- bedayan replied Aug 31, 2013
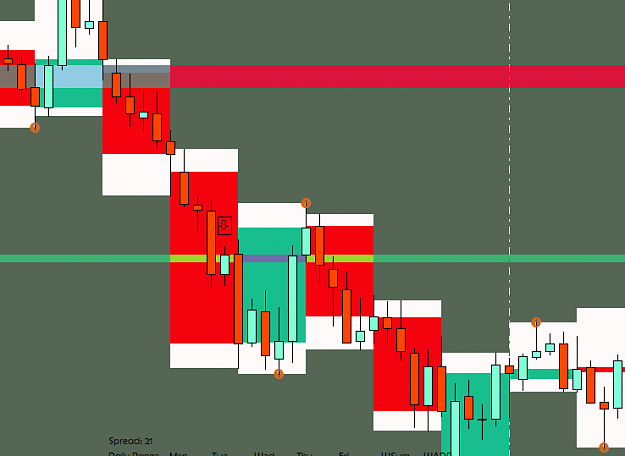
Hi Dadas, Thanks for the indicator.In daily chart I am not able to plot both weekly and monthly level.when I am trying to plot weekly was overridden by monthly.Is it possible we can plot weely and month both together.You can see following example ...
Price Action in Day Trading by Dadas
- bedayan replied May 28, 2013
Hi Dadas, In following chart when marked arrow section first its formed inside bar.Inside bar candle initially a PTECZ candle.Then breakout of this candle happend. So in this case PTECZ candle is changed to TBCZ candle? is my analysis correct? Its ...
Price Action in Day Trading by Dadas
- bedayan replied May 28, 2013
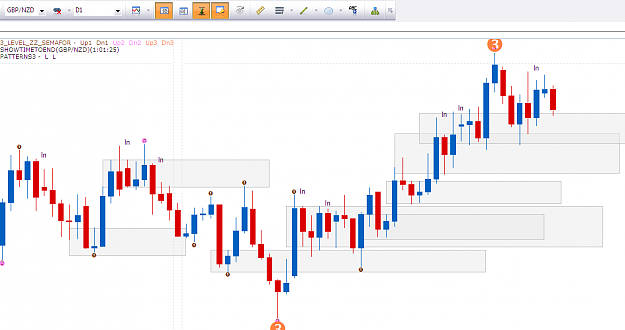
Hi Dadas Some of the ptecz I have identified in GBPNZD daily chart.Let me know whether they identified correctly. image
Price Action in Day Trading by Dadas
- bedayan replied May 17, 2013
Hi Dark040, Thanks but I am using all this indicators from firt page.Neither of them showing the values which are showing in your chart right hand side bottom.Can you please check.Please see below screenshot.I have marked with yellow which I am ...
Price Action in Day Trading by Dadas
- bedayan replied Apr 21, 2013
Hi 60minuteman, I have a couple of question regarding your this strategy. 1. Regarding your above chart what do you mean by closing above H4 support resistance?Are you considering closing above previous H4 bar open ,high ,low , close or closing only ...
H4 Power
- bedayan replied Apr 11, 2013
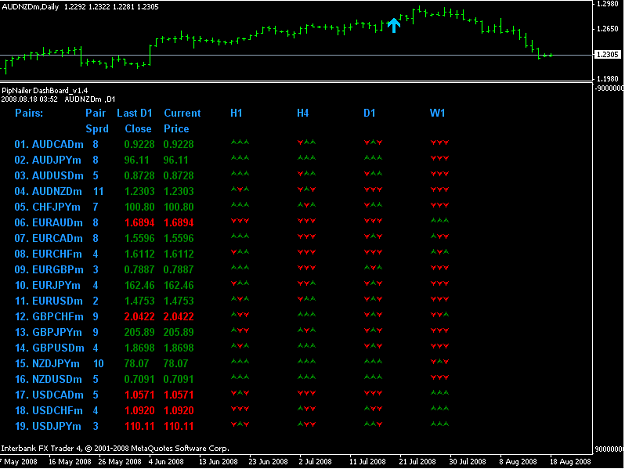
actually looking for dashboard for moving average crossover.This indicator I am having.I trade only in daily time frame. It will list all the pairs in one screen. image
Simple 5 / 8 moving average crossover
- bedayan replied Apr 5, 2013
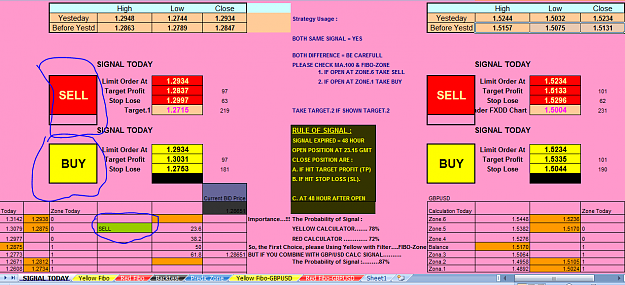
Hi Rstranger, I have one question . suppose red fibo given Red signal Yello fibo given buy signal How do yo decide the third signal? I am confused of selecting third signal? If I select following three it should be sell signal for EURUSD. But you ...
(binned per thread starter’s request) Fibo zones - the relation b
- bedayan replied Apr 5, 2013
Hi Rstranger, which values for fibonacci calculator you are considering for zone6 and zone1? Left value or right value which are marked with orange.Please see below screenshot.Because I dot see the zone 6 value which you mentioned in the chart? ...
(binned per thread starter’s request) Fibo zones - the relation b

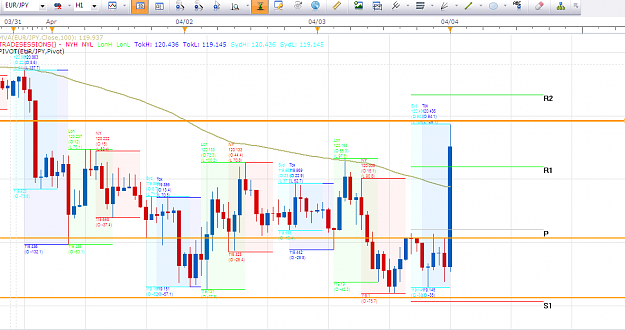
- bedayan replied Apr 4, 2013
Hi, Loo at the EURJPY trade today.Three buys.According to the first excel if you put you entry order and take profit you are well in profit.Please see below screenshot. image
(binned per thread starter’s request) Fibo zones - the relation b