- Search Metals Mine
- 11 Results
- allngap replied May 1, 2017
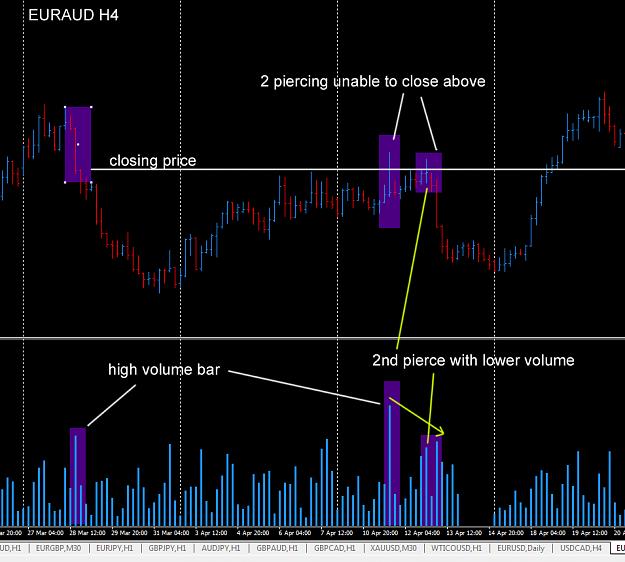
Hi TEB63, thanks for sharing all the great insight with us. i tried to study VSA but i'm still very confused with the terms. i use volume to trade as well, so i would like to confirm the method with you. am i drawing the right thing ?? image
VSA and VRA - TEB Basic Analysis
- allngap replied Jul 12, 2011
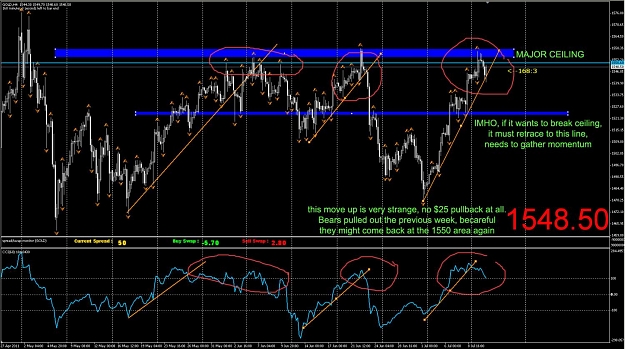
Becareful. From COT data, bears pulled out since options expiration period (2weeks ago). During this move up, there is hardly any $25 pullback along the way. from my perspective, this tug of war is unhealthy due to the absence of bears. Bears might ...
XAU/USD & XAG/USD - Gold & Silver Traders Thread
- allngap replied Jun 28, 2011
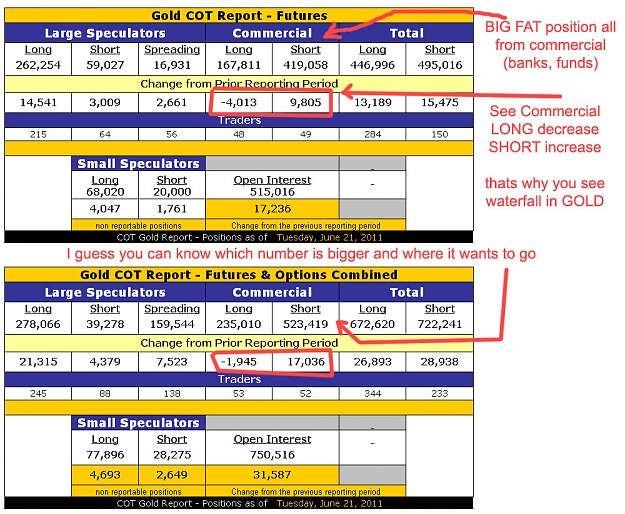
image COT data. SHORTS overwhelm LONG position in commercial. unfortunately, this report is a weekly data and it is lagging. beware this wednesday. If commercial wants to whack it down, it'll most probably happen during FOMC, Crude oil and ...
XAU/USD & XAG/USD - Gold & Silver Traders Thread
- allngap replied Jun 27, 2011
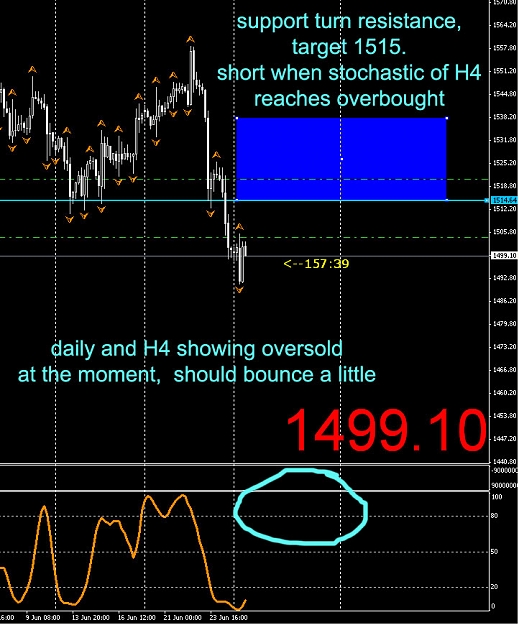
wonder how high it might go up before getting hammered again waiting for short entry image
XAU/USD & XAG/USD - Gold & Silver Traders Thread
- allngap replied Jun 26, 2011
1. who's gonna pay for US's deficit if there is no QE3 ? US pension funds ? China ? or US private companies ? IMHO, political wise, QE2 has been getting a lot of negative responds from the voters as well as the american people. QE2 Another round of ...
XAU/USD & XAG/USD - Gold & Silver Traders Thread
- allngap replied Jun 23, 2011
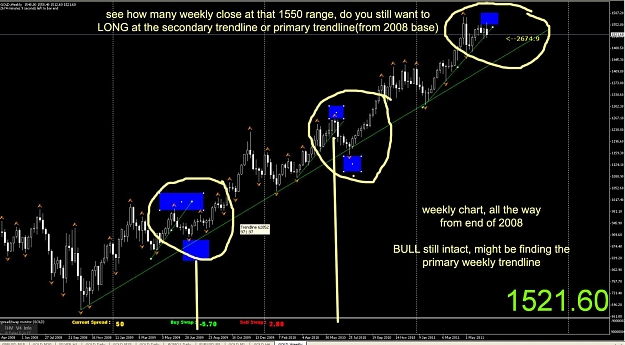
important weekly trendline charts. just look at the previous 2 year patterns. i'm selling the rallies until the price reaches the primary trendline from 2008 bottom
XAU/USD & XAG/USD - Gold & Silver Traders Thread
- allngap replied Jun 23, 2011
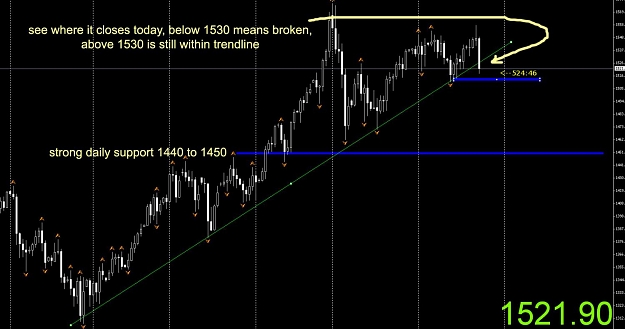
image see the uptrend trendline broken. not advisable to take long position anymore
XAU/USD & XAG/USD - Gold & Silver Traders Thread
- allngap replied Jun 23, 2011
Please note that the trendline from the 1315 has officially been breached !!! image
XAU/USD & XAG/USD - Gold & Silver Traders Thread

- allngap replied Jun 23, 2011
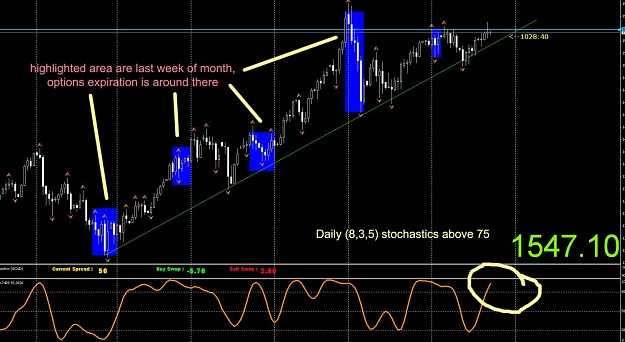
please read this well documented article. options expiration movement url url important expiration dates, metals expires on 28June (early next week) becareful....
XAU/USD & XAG/USD - Gold & Silver Traders Thread
- allngap replied Jun 10, 2011
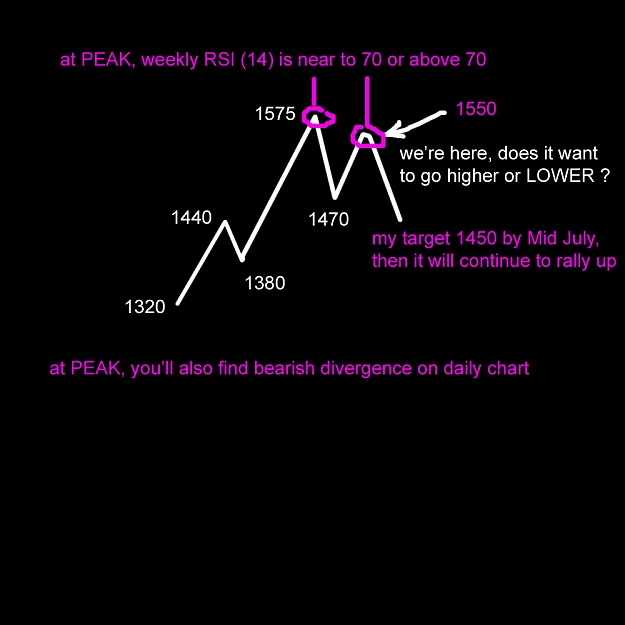
see the danger when RSI 14 @ weekly is at >70, we are now at that level and the price is capped at 1550.
XAU/USD & XAG/USD - Gold & Silver Traders Thread
- allngap replied Jun 10, 2011
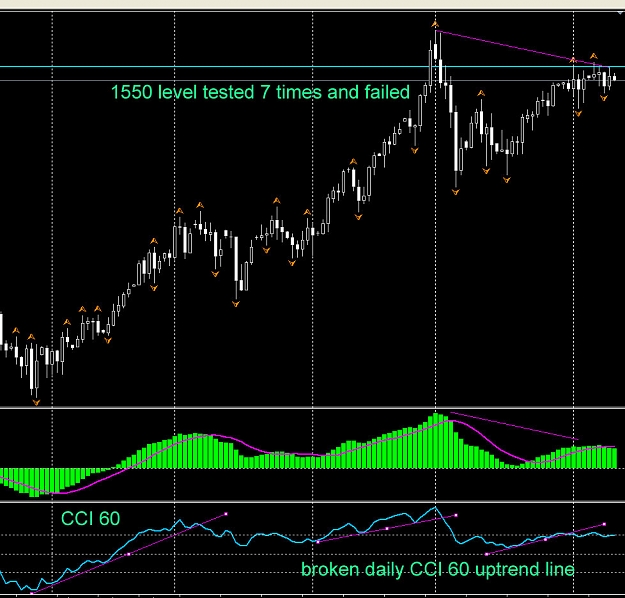
GOLD charts — Daily CCI 60 uptrend line broken, please refer back to the previous 3 trendline break. CCI(60) is 3months data and if the uptrend trendline is broken, it might be ugly to take LONG. i'm slowly building up my short position ...
XAU/USD & XAG/USD - Gold & Silver Traders Thread
- Posts by Member Search: 'allngap'