- Search Metals Mine
- 2,116 Results (1 Thread , 2,115 Replies )
-
 _BBKing_ replied Apr 23, 2024
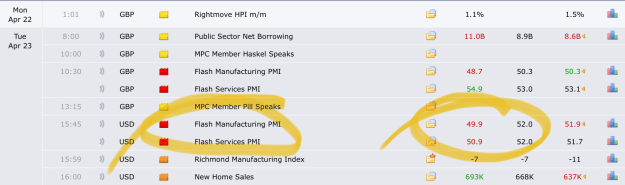
really? image non sense the previous release! non sense this one!
Cable Update (GBPUSD)
- _BBKing_ replied Apr 19, 2024
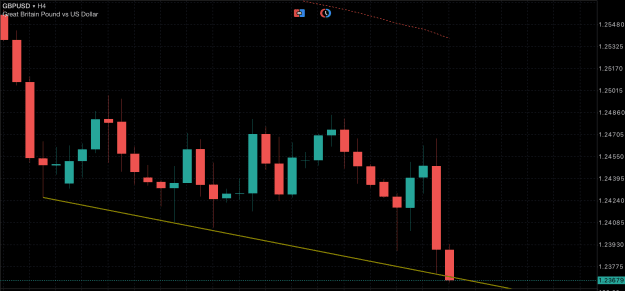
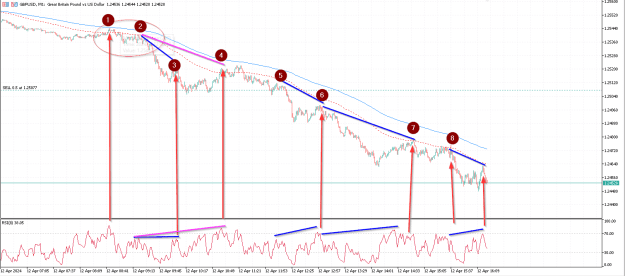
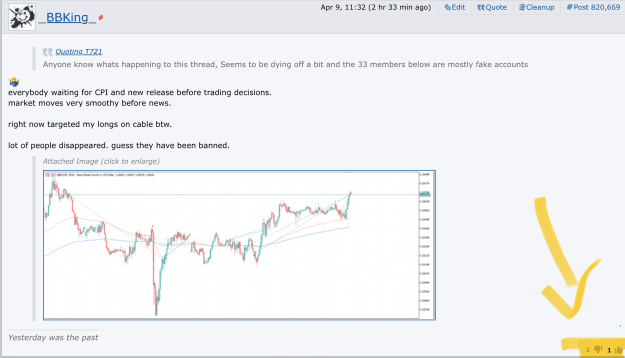
image came around to post this. I don’t remember when, but I’ve already seen a similar setup and price kept falling. Before end of the day, price tanked 150pips straight. Maybe not today same scenario. But be careful. market does not like the ...
Cable Update (GBPUSD)
- _BBKing_ replied Apr 12, 2024
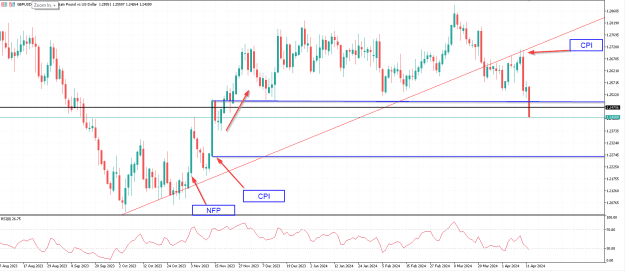
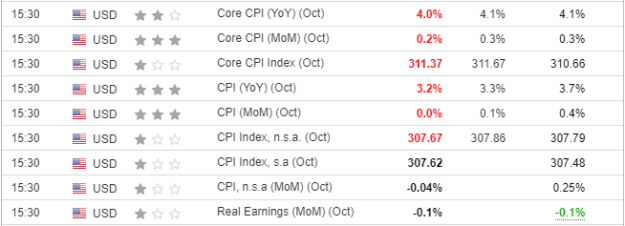
took the time to check what was that move back in nov2023 see chart below image the first push up came because of very disappointing NFP the second strong push was when CPI came back red after a long time printing a 0% increase M/M sending Y/Y ...
Cable Update (GBPUSD)
- _BBKing_ replied Apr 12, 2024
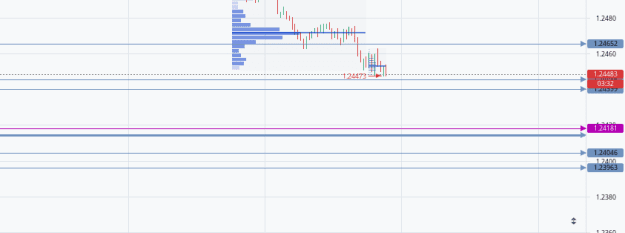
added entry trailing SL 13pips will cut if gets higher than 2471 edit: typo
Cable Update (GBPUSD)
- _BBKing_ replied Apr 12, 2024
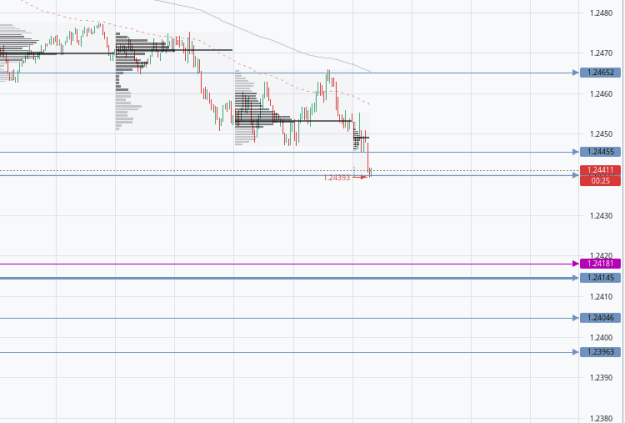
I have a 2440/45 possible pullback lower is 2415/20 more lower 2395/2405
Cable Update (GBPUSD)
- _BBKing_ replied Apr 12, 2024
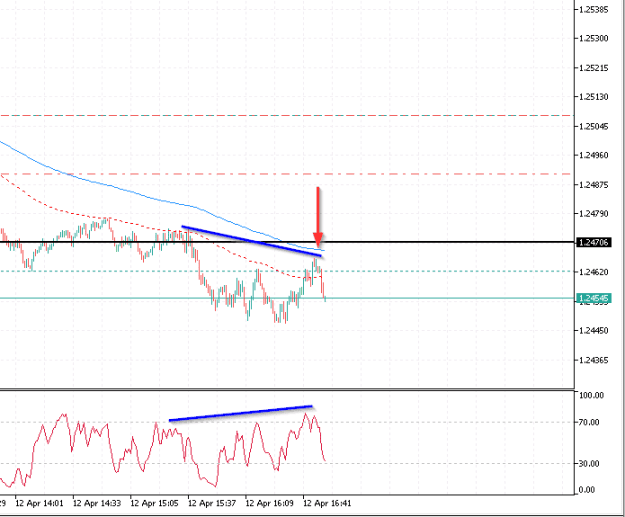
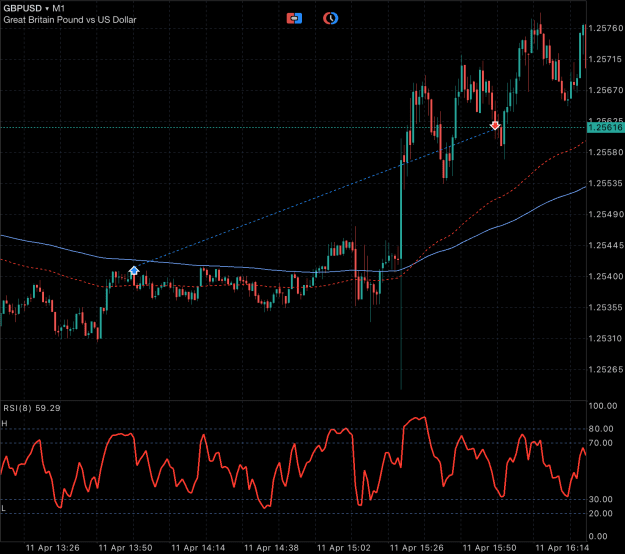
I sometimes get more confortable by looking at RSI in 1m or 5m so if I want to entry short in the middle of a move, far from the EMA and maybe between a support and a resistance, I wait for the RSI to be oversold/overbought or at least a divergence ...
Cable Update (GBPUSD)
- _BBKing_ replied Apr 12, 2024
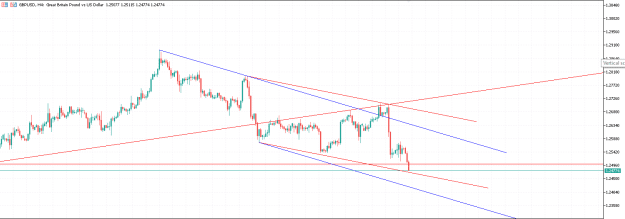
the drawing tool in MetaTrader5 is unbelievably shitty took me a while to draw these 2 channels. which one fits better? blue or red? image image
Cable Update (GBPUSD)

- _BBKing_ replied Apr 12, 2024
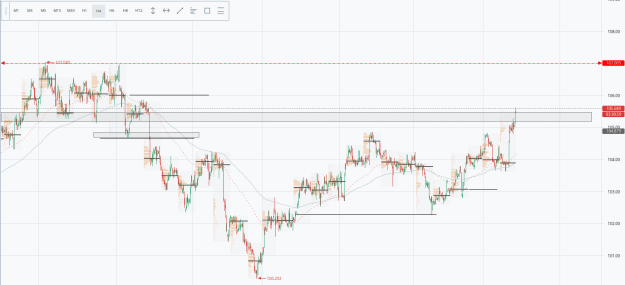
Looking to the left we have to go back in November to find when price was these levels image
Cable Update (GBPUSD)
- _BBKing_ replied Apr 12, 2024
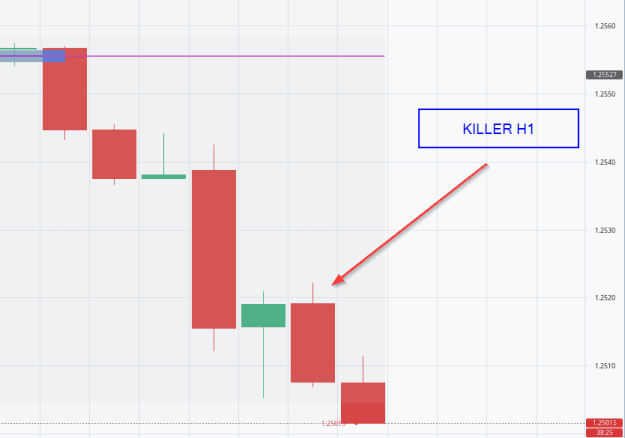
Love to see the killer candles back on market image
Cable Update (GBPUSD)
- _BBKing_ replied Apr 12, 2024
doesn't really seem to be a good setup buy not yet
Cable Update (GBPUSD)
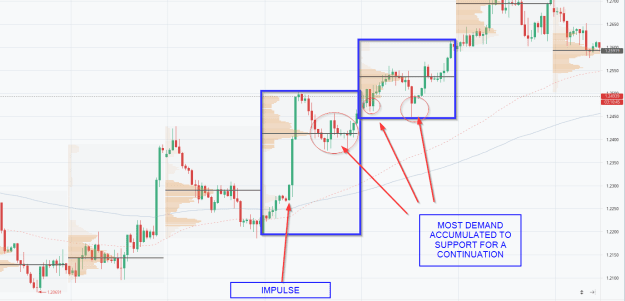
 seems to me what is developing is as seen in the chart could be wrong of course. no advice at all I'm not in any position yet
- _BBKing_ replied Apr 12, 2024
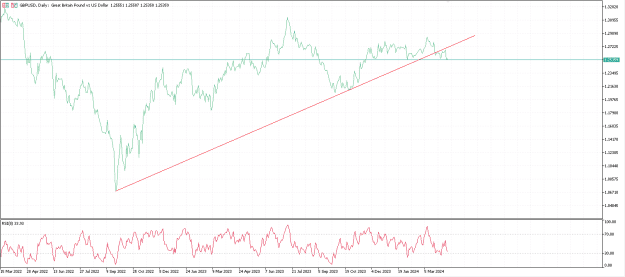
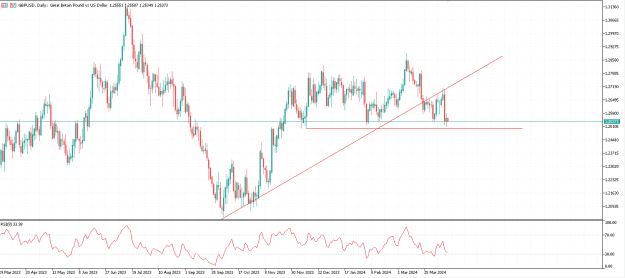
Daily line chart image Seen in candles image I don't mean we go straight down, but really things are quite different now compared to February when the 1.25 supported the price since still within an uptrend. My question is: what could be the ...
Cable Update (GBPUSD)
- _BBKing_ replied Apr 11, 2024
I'm still out of cable, not feeling it. Got a pre news scalp today 2535-2562 image Will probably have a rest tomorrow. Sometimes it’s required. Then monday new week starts
Cable Update (GBPUSD)
- _BBKing_ replied Apr 10, 2024
short story of the day and a word to the wise invisible users image invisible dislikes image no worries: I will disappear soon again as I always did in the past and come back in some months to find new invisibles, new users, new likers, new ...
Cable Update (GBPUSD)
- _BBKing_ replied Apr 10, 2024
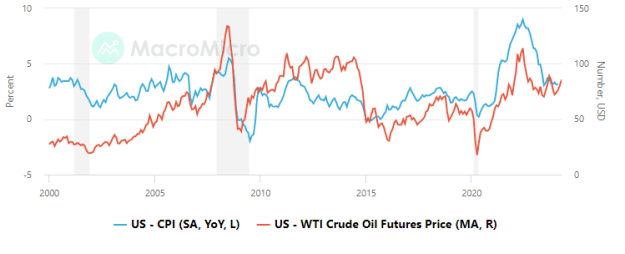
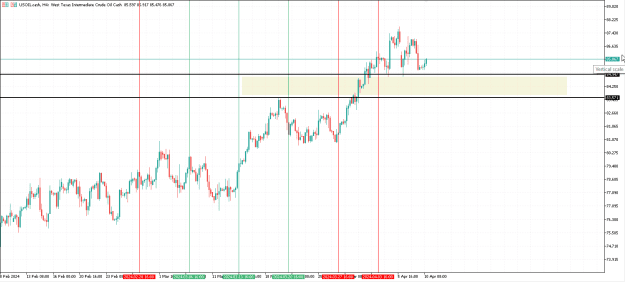
I mean, this is quite a good comparative chart I found on the web showing the path of WTI and US CPI image As long as OIL price will keep rising, will trail up inflation forcing Govs and Central Banks to keep interest rates high. For what I see, ...
Cable Update (GBPUSD)
- _BBKing_ replied Apr 10, 2024
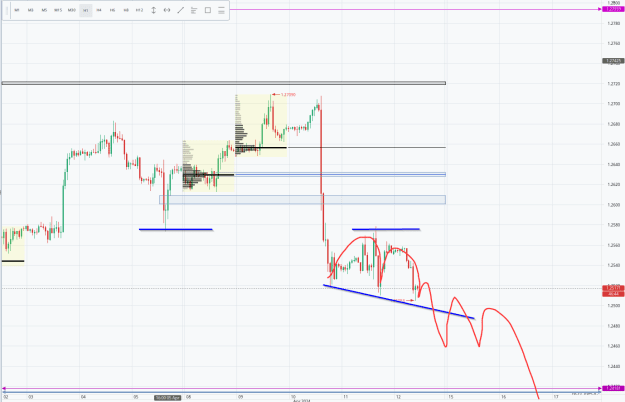
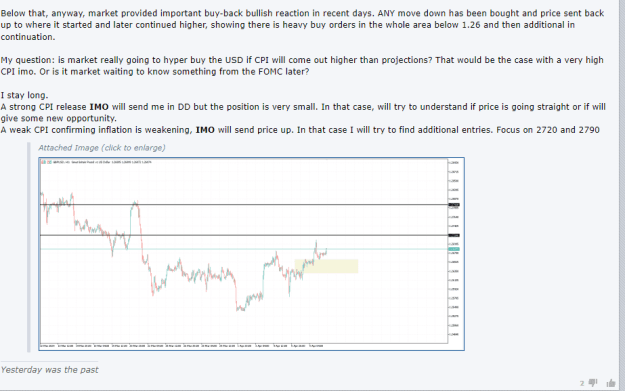
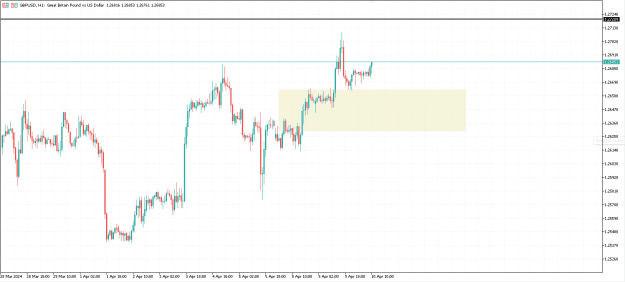
H1 Chart That yellow rectangle shows the area to be broken as bearish to go further down. Maybe CPI and FOMC will tell USD strength so we go straight below it without any re-test (really?) image Below that, anyway, market provided important ...
Cable Update (GBPUSD)
- _BBKing_ replied Apr 9, 2024
let me post a chart so the thread will be more eye-friendly
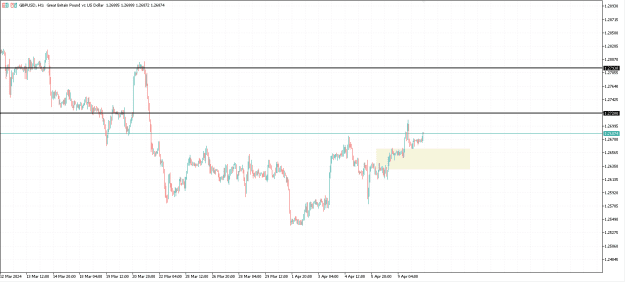
Cable Update (GBPUSD) EDIT: the chart says "nearest important confluence is 1.2720"
- _BBKing_ replied Apr 9, 2024
Funny you cannot know who actually disliked a post. Makes not sense to me as long as likes are visible also dislikes should be, so one can observe who liked and who disliked a post in order to better understand forum participants and their behavior ...
Cable Update (GBPUSD)
- _BBKing_ replied Apr 9, 2024
That was quick. took few hours to switch to the verification phase image
Scramble Journal