- Search Metals Mine
- 20 Results
- Yoki replied Aug 14, 2019
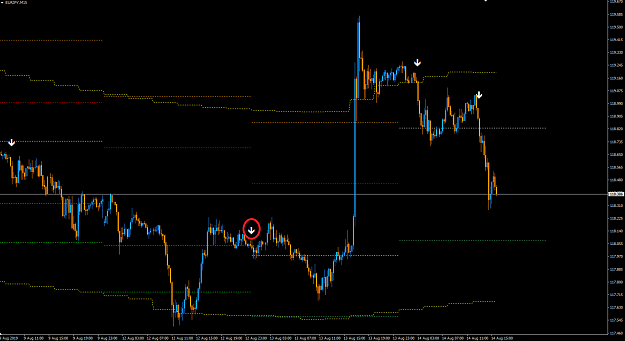
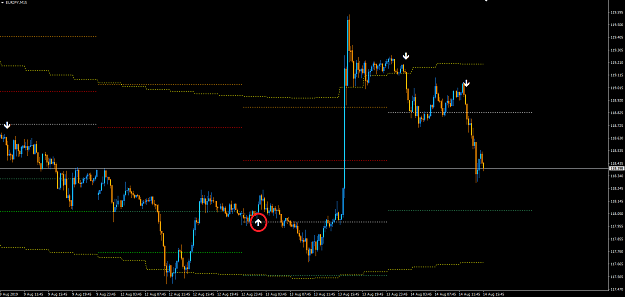
I checked on another broker and didn't get the same signal Broker 1 (original): image Broker 2: image
(binned per thread starter's request) Beat The Market strategy
- Yoki replied Aug 13, 2019
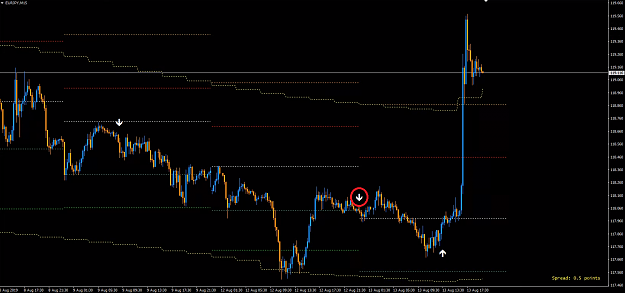
Was this a good trade? Entered short at the baseline. Got stopped out unfortunately. image
(binned per thread starter's request) Beat The Market strategy
- Yoki replied Oct 17, 2018
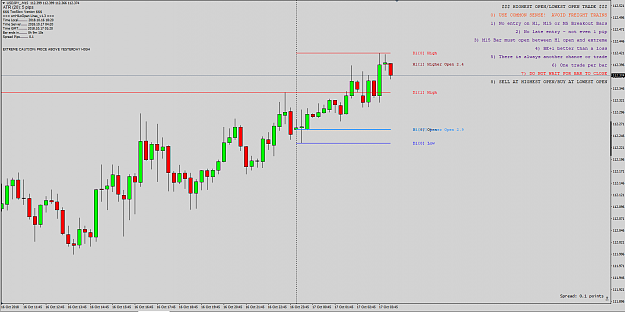
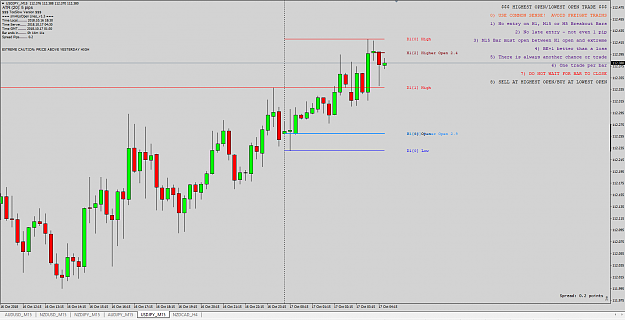
This would have been trade number 3 of 10 but got home from work late today. Would have produced positive pips. Rule #5 Before: image After: image
Highest Open / Lowest Open Trade
- Yoki replied Oct 16, 2018
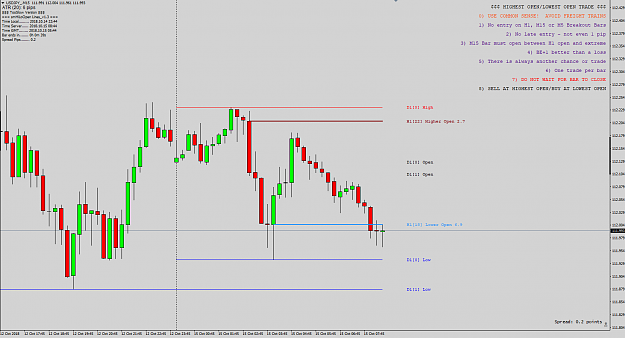
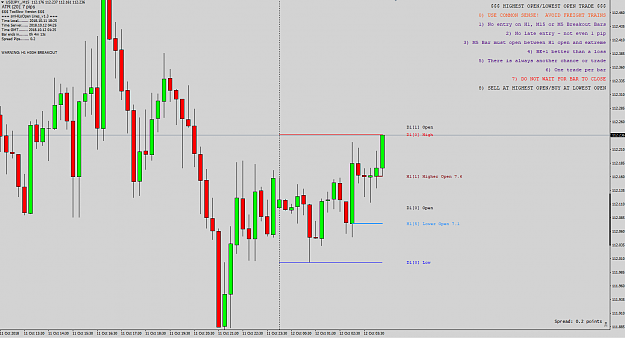
Well no trades today or yesterday. One potential trade did happen yesterday that I saw right before I went to bed but didn't take it. Here's a before and after: Before: image After: image Maybe PA wasn't ideal hear. 7 small bear candles. Then 3 ...
Highest Open / Lowest Open Trade
- Yoki replied Oct 11, 2018
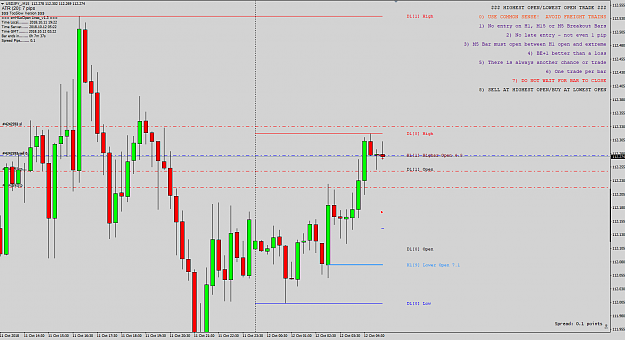
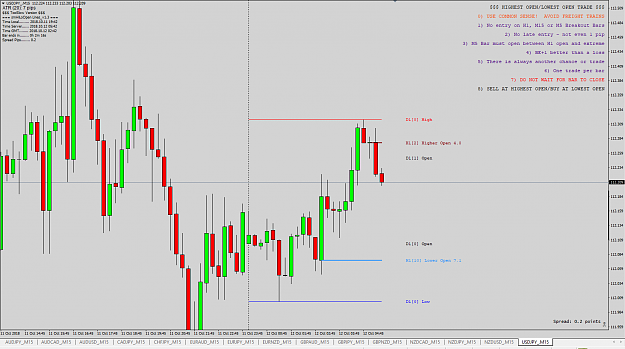
USDJPY M15 only Trade 2 of 10: Pips: +11 (two positions: +4 and +7) Entry: image Exit: image Notes: Was still showing HHs and HLs. Possibly a risky setup based on my previous trade even though this was by the rules
Highest Open / Lowest Open Trade
- Yoki replied Oct 11, 2018
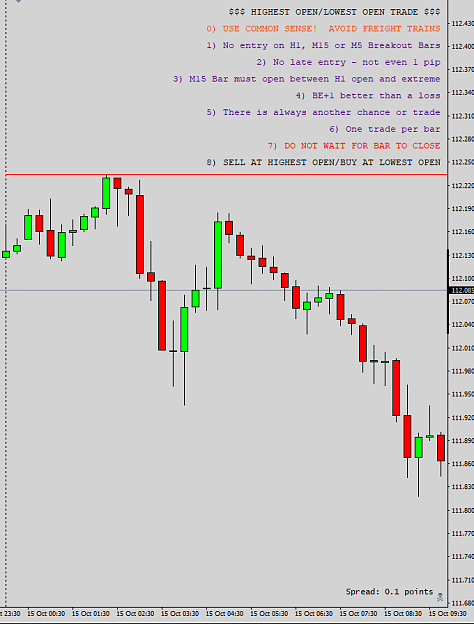
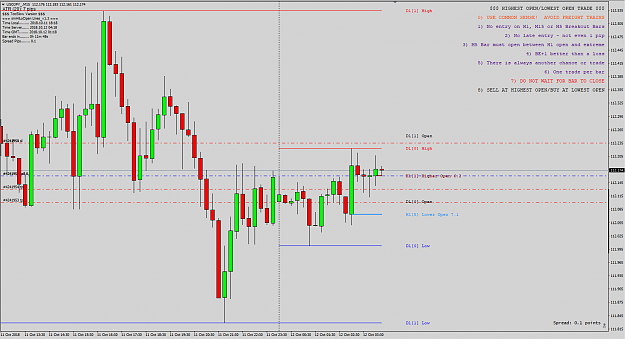
USDJPY M15 only Trade 1 of 10: Of course my first one is a loser lol. After 5 winning demo trades in a row. Pips: -14 (two positions) Entry (just barely touched it): image Exit: image Something to possibly take away from this is that M15 PA was ...
Highest Open / Lowest Open Trade
- Yoki replied Mar 15, 2018
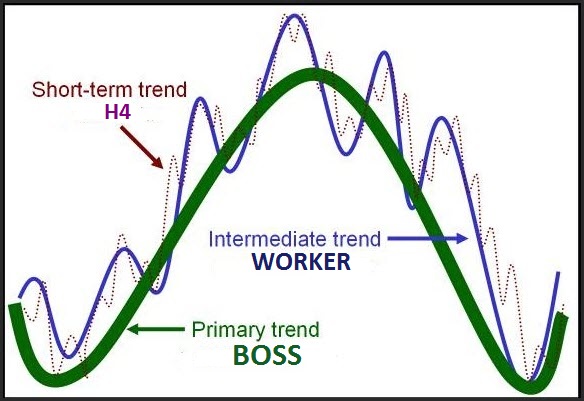
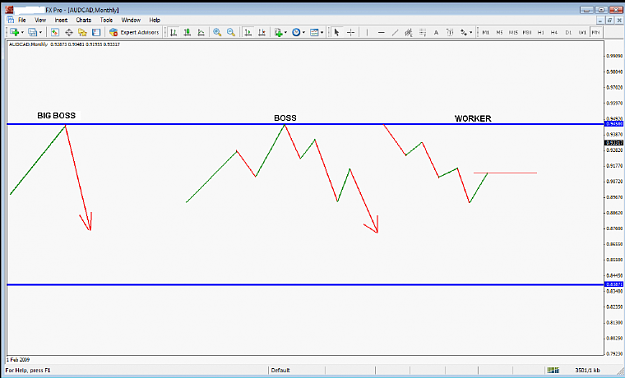
Hey BeeCee, I hope you or Strat don't mind me attempting answer this since it's directed to him. I don't think it's a sill question. See the chart below (from Strat's other thread) image We look at the boss to see what it's doing. If it's going up ...
Strat's PASR Long Term, Stress Free Trading
- Yoki replied Mar 15, 2018
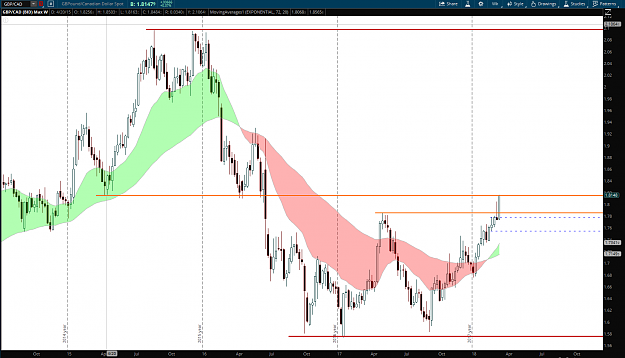
Hey BeeCee, Yes, I see the resistance area you're talking about bit I'm looking at the boss to see it. It's also in line with April of 2015. I think you're right. Waiting for a close above that resistance area around 1.815 on the boss would be would ...
Strat's PASR Long Term, Stress Free Trading
- Yoki replied Mar 14, 2018
Hey BeeCee, I've had my eye on this pair too. What's stopping me personally from trading it at the moment is the boss SS at weekly resistance. Boss is in an uptrend but I'm going to wait to see if the boss can at least close above the weekly ...
Strat's PASR Long Term, Stress Free Trading
- Yoki replied Mar 13, 2018
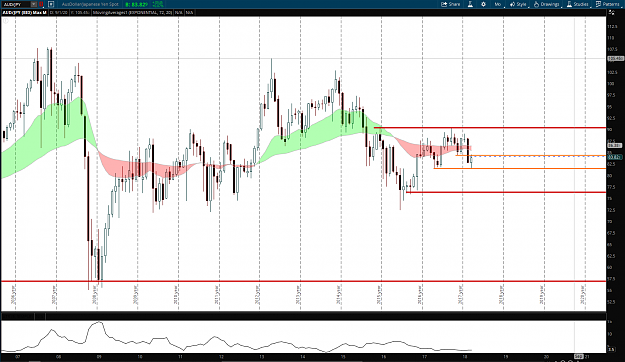
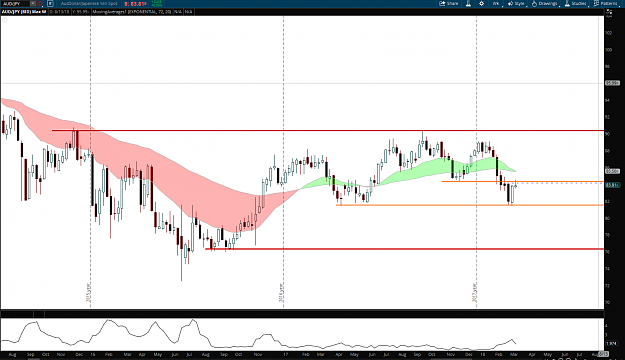
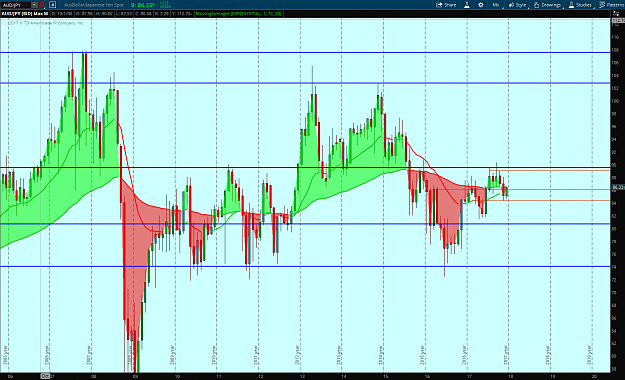
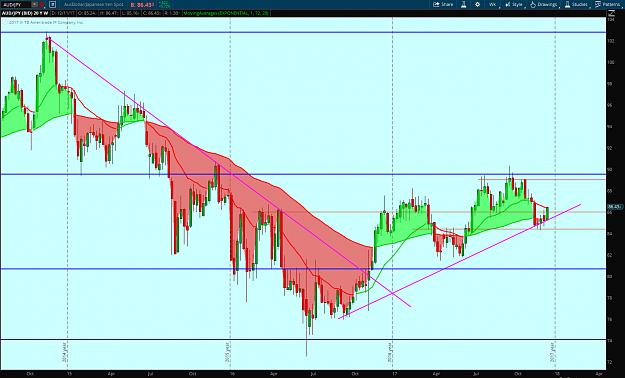
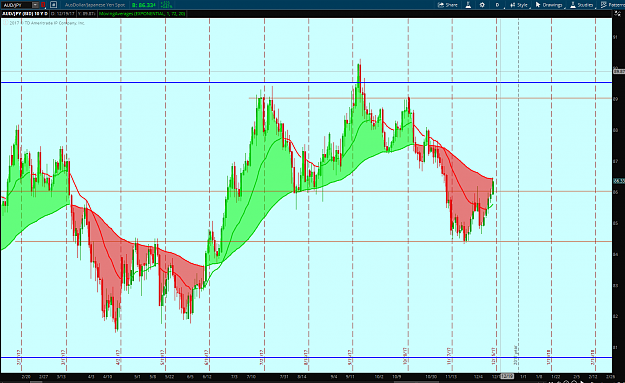
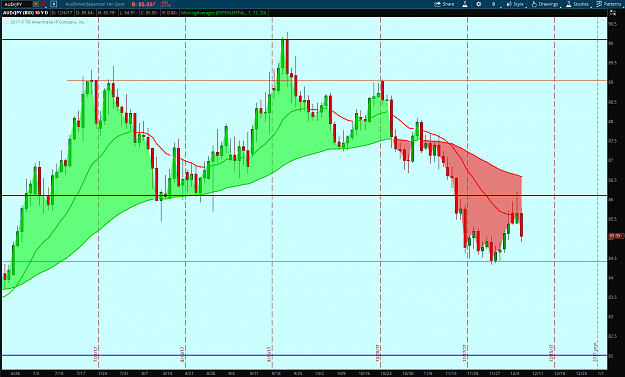
AUD/JPY Hi Strat and everyone, Still reading the other thread. Thought I'd share my analysis for this pair. Big Boss: Relatively large bearish candle for the month of Feb. Price looks like it wants to go further down. image Boss: Primary trend is ...
Strat's PASR Long Term, Stress Free Trading
- Yoki replied Feb 7, 2018
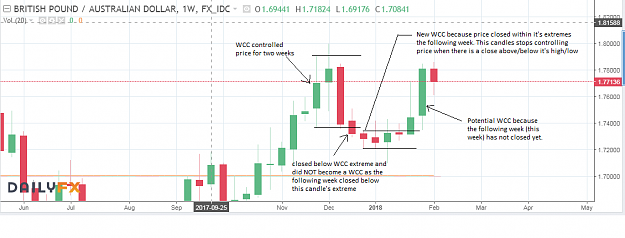
Totally agree, pictures are way better. Here's a chart I just marked up quickly: image
Strat's PASR Long Term, Stress Free Trading
- Yoki replied Feb 3, 2018
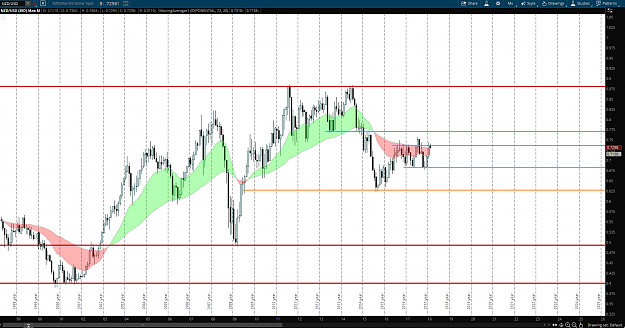
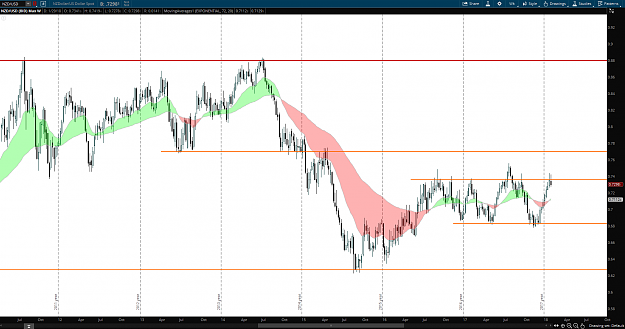
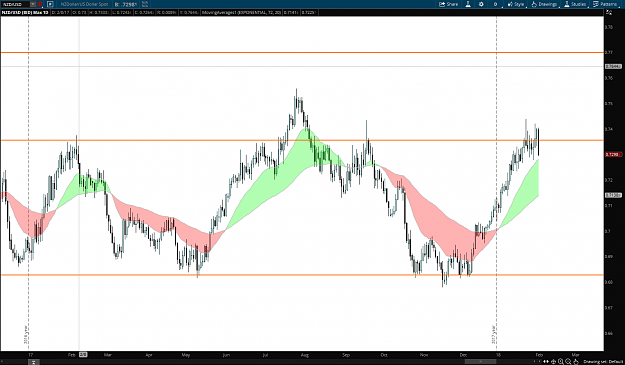
NZD/USD Hey Trogger, I know this is a bit late and a may seem like a hindsight trade, but I did take a short position below the SS on 1/24. I haven't been posting because I've been busy with work, and with my free time living on Strat's other thread ...
Strat's PASR Long Term, Stress Free Trading
- Yoki replied Jan 4, 2018
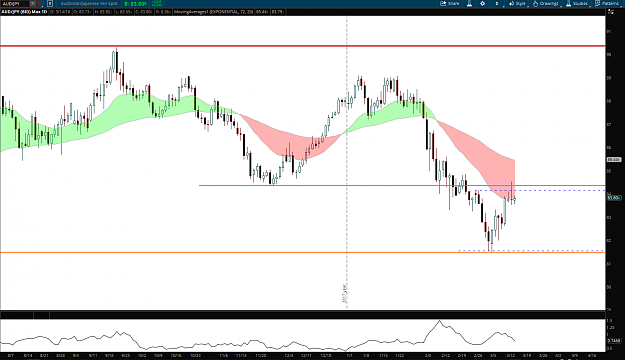
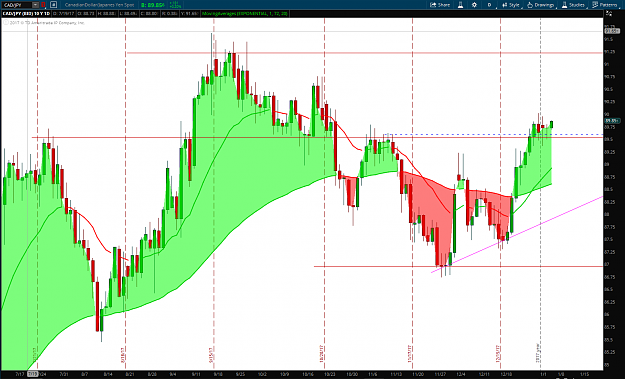
Here's CAD/JPY Last week's weekly bar broke out of the WCC resistance area. Now, the daily bars have built some nice support (the triple bottom) above the previous WCC resistance (dashed blue line) and the daily S/R line I have drawn. Yesterday's ...
Strat's PASR Long Term, Stress Free Trading
- Yoki replied Dec 20, 2017
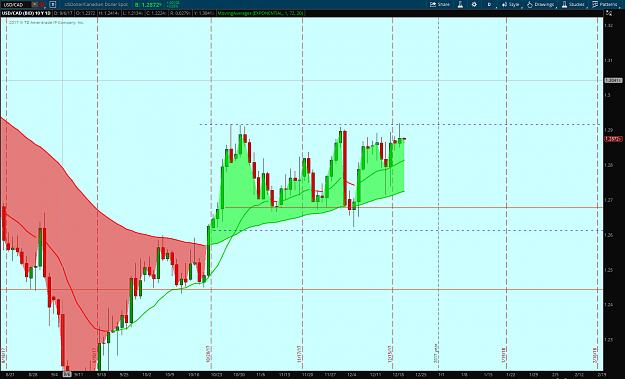
Hello everyone, Here's a potential trade I think is pretty simple for USD/CAD. I know I said in a few posts back I was not doing WCC analysis, but I read a bit more about them and I saw this opportunity so I thought I'd share it anyways. As strat ...
Strat's PASR Long Term, Stress Free Trading
- Yoki replied Dec 13, 2017
Hello everyone, I'd like to reflect on a losing trade I made a little over a week ago. This is post #1,161. I've read up to about page 160 on the old thread and feel like I'm learning more every time I read it. My goal in posting this is to not just ...
Strat's PASR Long Term, Stress Free Trading
- Yoki replied Dec 6, 2017
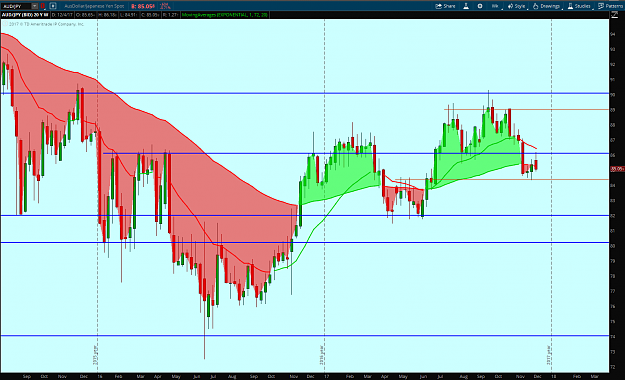
Strat and Trogger, Here's what I've got for AUD/JPY The immediate trend for the Big Boss is down (no chart) As for the Boss, it's broken a major support/resistance level image And the worker shows a shooting star candlestick yesterday where the ...
Strat's PASR Long Term, Stress Free Trading
- Yoki replied Dec 1, 2017
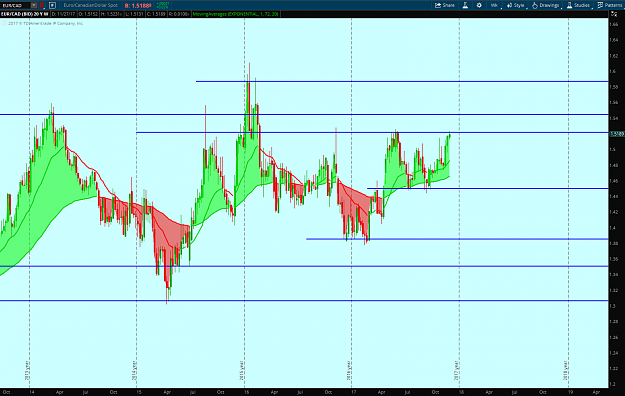
In a way, post #3553 on the old thread answered my question. That's great. EUR/CAD boss chart is now showing what looks to me like a nice looking shooting star at the resistance level. To me, this looks like an opportunity to trade the boss chart as ...
Strat's PASR Long Term, Stress Free Trading
- Yoki replied Nov 28, 2017
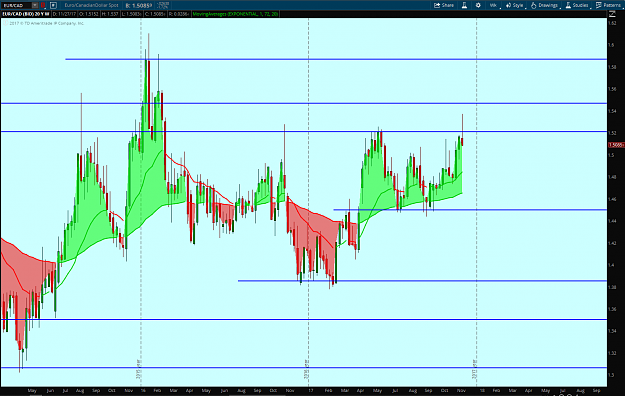
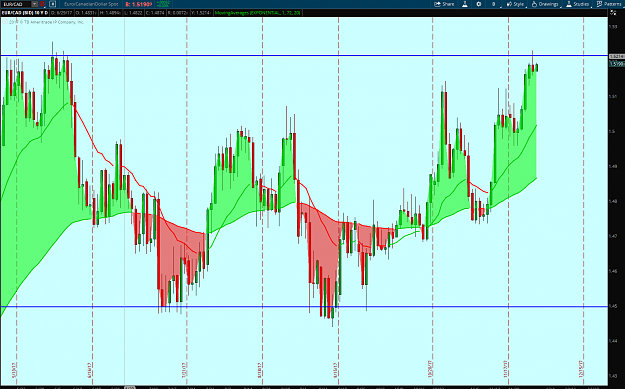
Alright, here's what I got from looking at EUR/CAD Boss: image Worker: image Price is at a resistance level and the yesterday's bar formed a shooting star. I put a sell stop below the low of the shooting star with targets at support levels and ...
Strat's PASR Long Term, Stress Free Trading
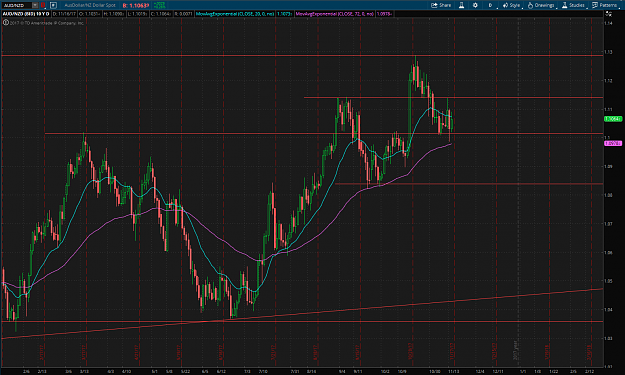
- Yoki replied Nov 18, 2017
I was thinking the same thing. Here's some charts for it: Big Boss: Short term downtrend image Boss: May close below weekly support (solid blue line) and has the potential to create a new WCC if closes below dotted blue lines image Worker: Nice ...
Strat's PASR Long Term, Stress Free Trading
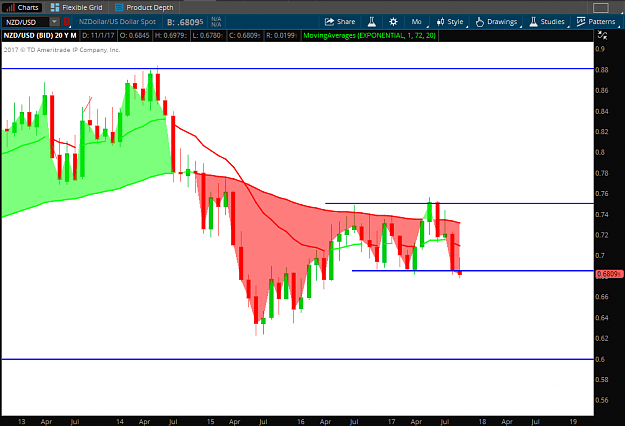
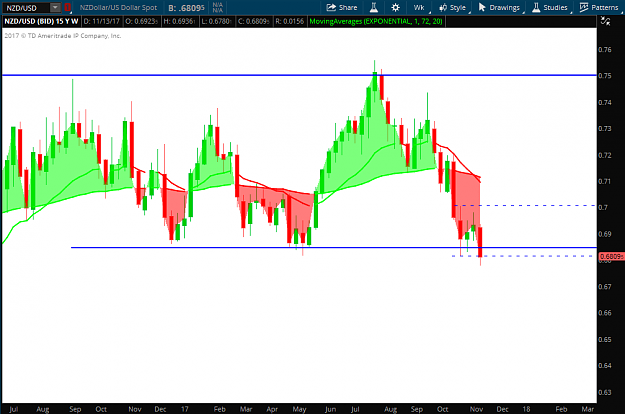
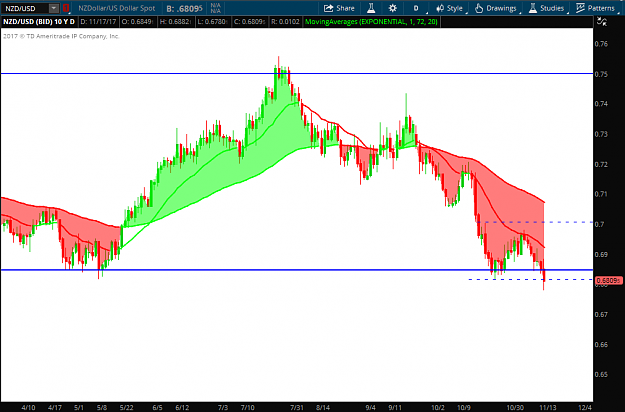
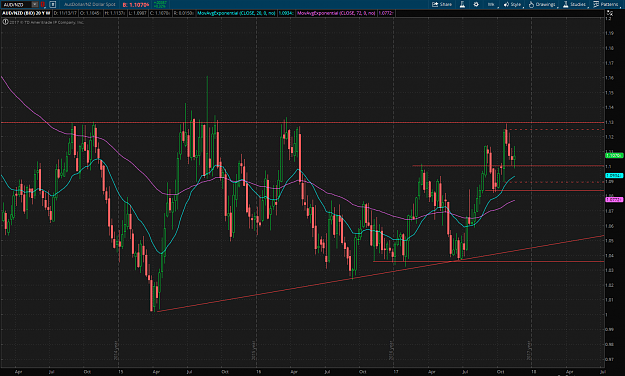
- Yoki replied Nov 16, 2017
First Post on FF. Read this thread and the summary PDF. Currently in the process of reading the older thread while studying charts. I always seem to go back to a simpler way of trading after failing to create a profitable, indicator riddled ...
Strat's PASR Long Term, Stress Free Trading
- Posts by Member Search: 'Yoki'