- Search Metals Mine
- 45 Results (1 Thread , 44 Replies )
-
 Yoenes replied Jan 2, 2013
Hello All I have attached the 4H chart that shows us clearly that we are in the range between 1.3180 and 1.3280 and we still have the same buy and sell areas.Price is currently at a sell area but be carefully to take longs from here i will explain ...
GBP/USD and EUR/USD
- Yoenes replied Dec 20, 2012
Hello All The Critical level what i have pointed out last week 1.3170 have got broken with big momentum so I see this level as an good place to buy . Eurusd 1H chart is attached
GBP/USD and EUR/USD
- Yoenes replied Dec 13, 2012
Eu 1H chart I prefere shorts as there is an sharp move down and maybe we have an dubble top in place
GBP/USD and EUR/USD
- Yoenes replied Dec 12, 2012
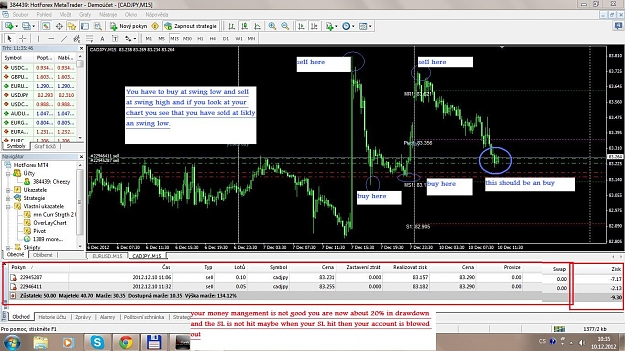
I just looked at your chart and i saw some important points that i pointed out on the picture below but there is more . But just few points to be awere off. The most important this is to calculate the risk that you are going to risk per trade and to ...
Still losing
- Yoenes replied Dec 12, 2012
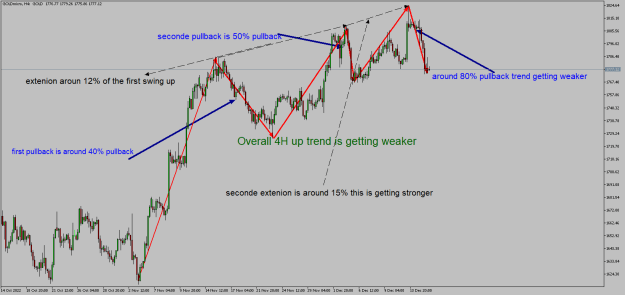
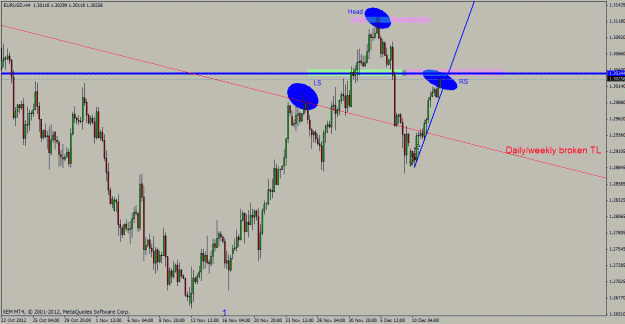
Just forgot to post this chart this is the 4H chart with the same blue trendline that i have posted on the 1H chart on my previos post . What i want to point out that if the drop occurs from here then we have an possibule an Head&shoulder (look at ...
GBP/USD and EUR/USD
- Yoenes replied Dec 12, 2012
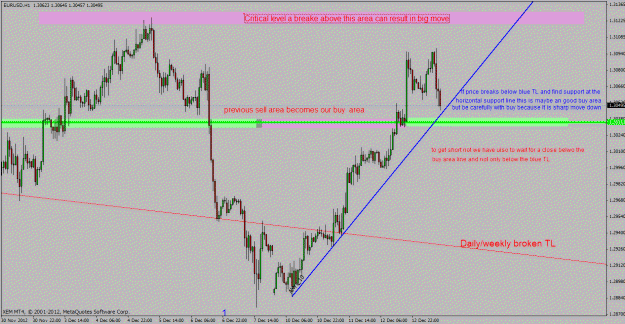
Hello All Eu 1H chart with possibule trade the savest trade would be to wait for a good close below the Blue TL and for more confirmation if you are using and indicator wait for the indicator to give you an sell signal. What give me confidence about ...
GBP/USD and EUR/USD


- Yoenes replied Dec 11, 2012
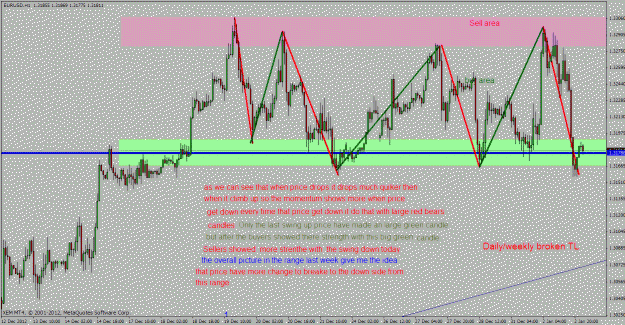
Hello All price is climbing up not that quikly so we can consider that the sell area is a good place to look for an sell signal but price is still not there. I will wait till price areaves at the sell area and look for some rejection from the upside ...
GBP/USD and EUR/USD
- Yoenes replied Dec 8, 2012
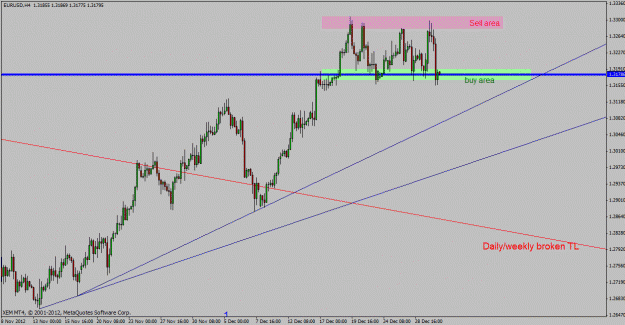
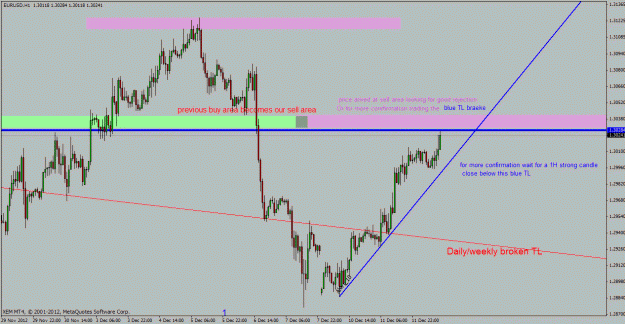
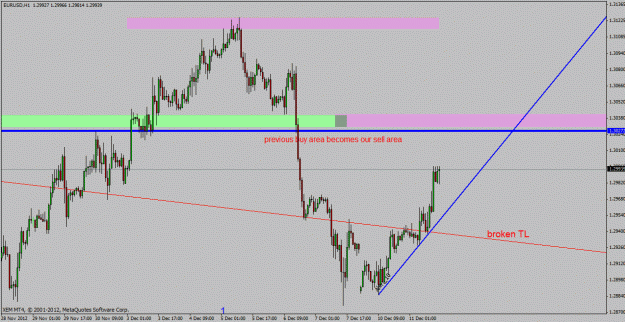
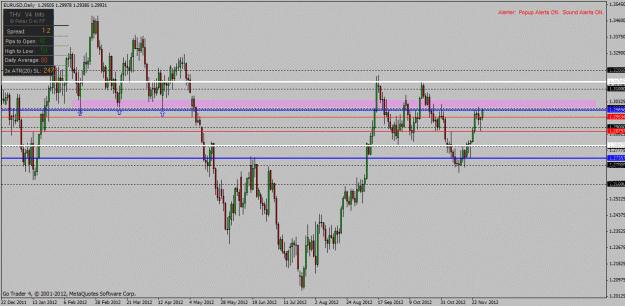
Hello All Eurusd review As you can see on the chart 4H chart price have been droping quikly trough our buy area and ulso trough the broken trend line that was visible on the daily/weekly chart .So as i sayed before the breake of this TL was weak ...
GBP/USD and EUR/USD

- Yoenes replied Dec 5, 2012
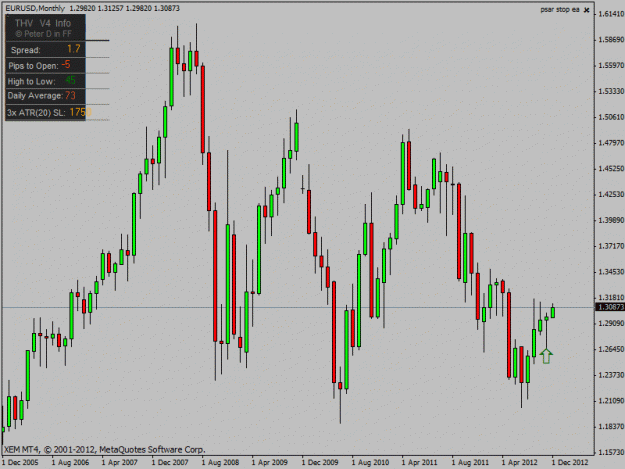
Hello All new monthly candle is formed and we have to be awere of this candle and monthly chart so this we can see on the monthly chart that there is rejection from the downside and that buyers are stepping in but it dont mean that price have to go ...
GBP/USD and EUR/USD
- Yoenes replied Nov 29, 2012
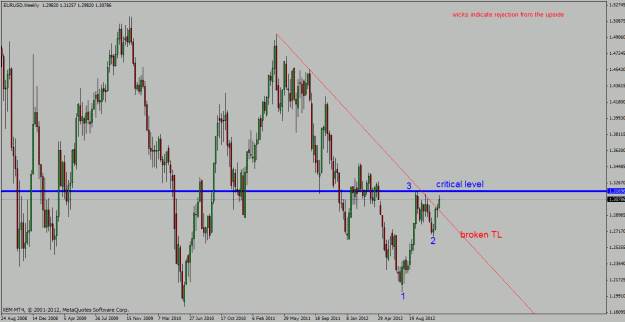
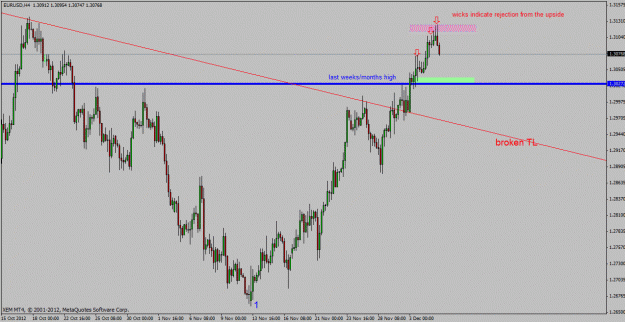
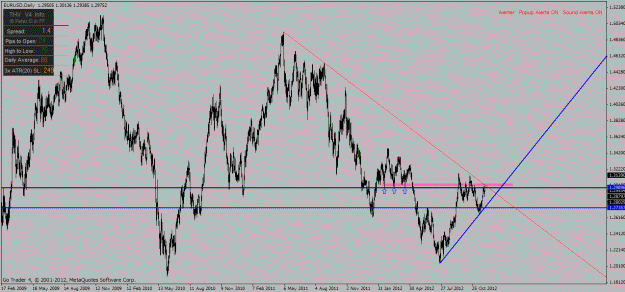
Hello All Strong level of resistance on the daily chart when zoomed out visible. Daily chart is attached
EURUSD

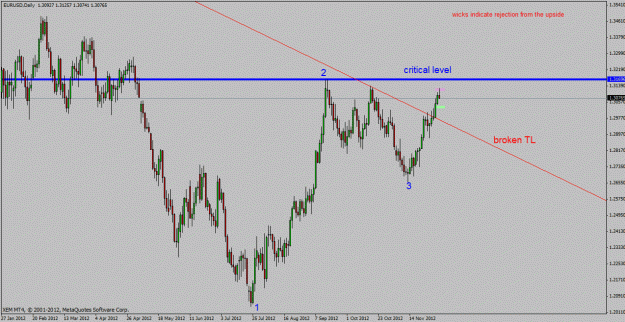
- Yoenes replied Nov 29, 2012
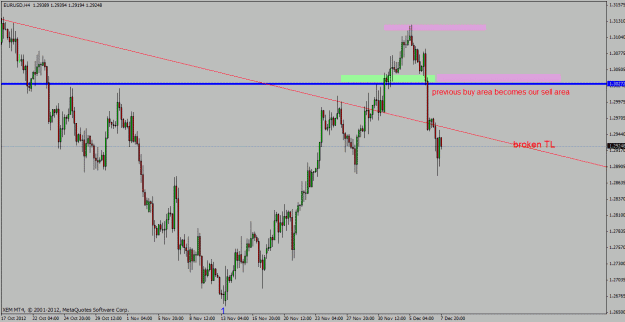
And this is the daily chart when zoomed out with the downwurd sloping TL red and the sell area comes mared with arrows the blue horizontal lines are lastweeks high and last weekslow. So here we have more then one sort traders that are watching this ...
GBP/USD and EUR/USD
- Yoenes replied Nov 29, 2012
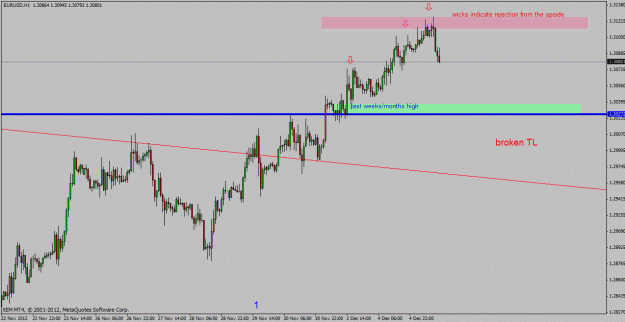
Yes Tsar i agree with you I have to look to higher timefram chart and this sell area comes from the daily chart that is way this is an area from a range more then 50 to 60 pips on the chart you can see the blue arows on the daily chart and where ...
GBP/USD and EUR/USD
- Yoenes replied Nov 29, 2012
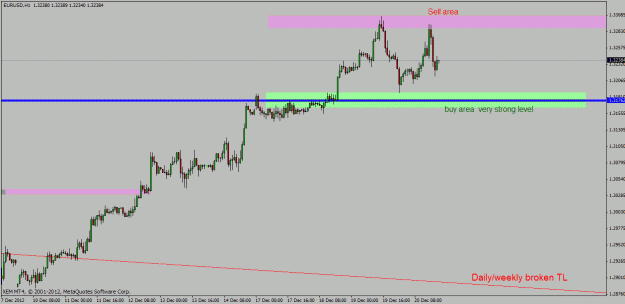
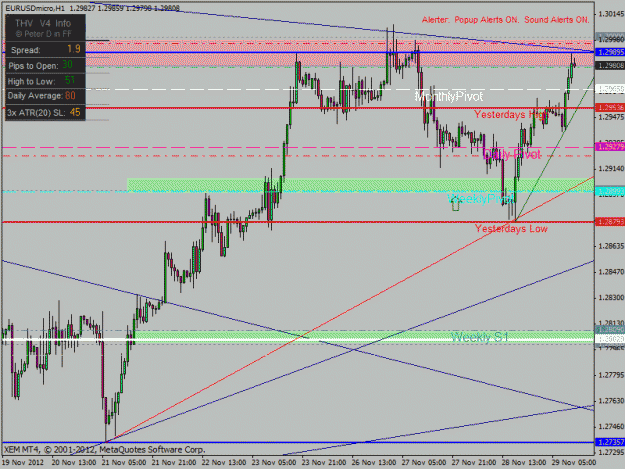
Hello All This is eurusd 1H chart price is currently at Sell area so we are just looking for any rejection from the upside or a trendline breake to get short
GBP/USD and EUR/USD
- Yoenes replied Nov 28, 2012
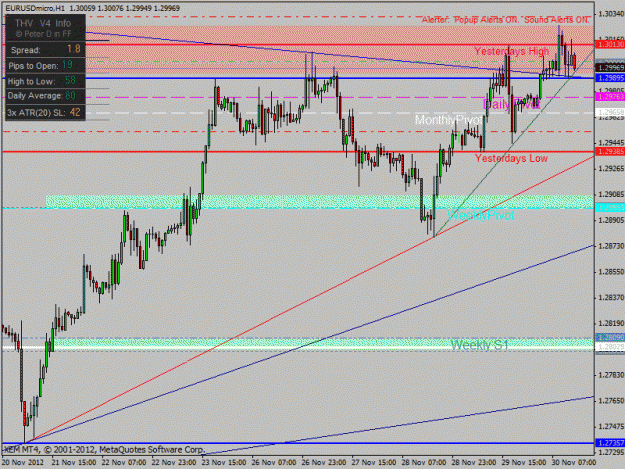
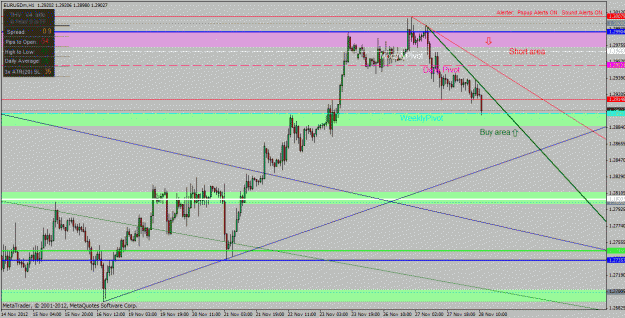
Hello All This is the Eurusd hourly chart as you can see price arived at our first possibule buy area(in green) we now have to look for an rejection wich at this area to get long or for more confirmation we have to wait that the Green downwurd ...
GBP/USD and EUR/USD
- Yoenes replied Nov 28, 2012
Hello All This is the Eurusd hourly chart as you can see price arived at our first possibule buy area(in green) we now have to look for an rejection wich at this area to get long or for more confirmation we have to wait that the Green downwurd ...
EURUSD
