- Search Metals Mine
- 2 Results
- Xag replied Aug 29, 2016
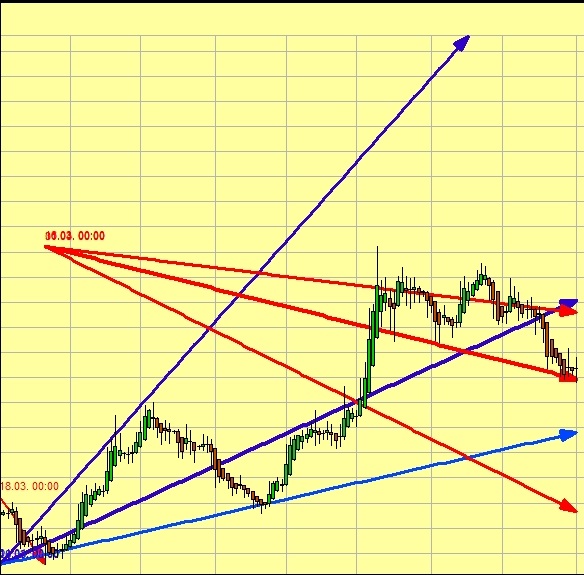
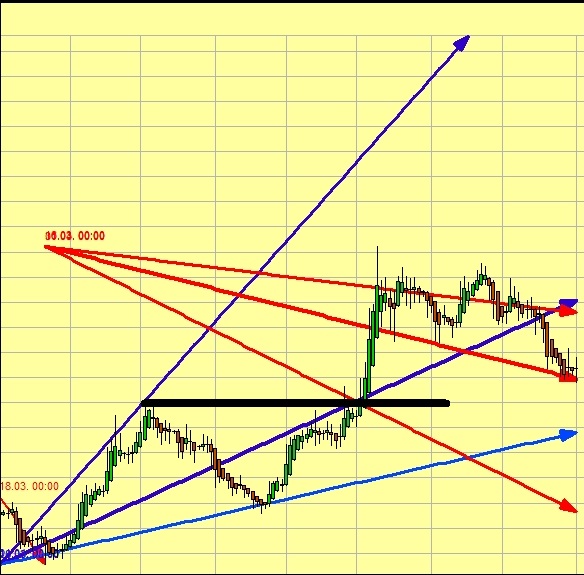
My general view on XAG,the middle one of the lines in red and blue represent the swing´s time value per day,above and below are the harmonics.For now it is turning up again but that shought be short-lived as it still has plenty of time to burn.In ...
XAU/USD & XAG/USD - Gold & Silver Traders Thread
Attached Images
- Xag replied Jun 5, 2013
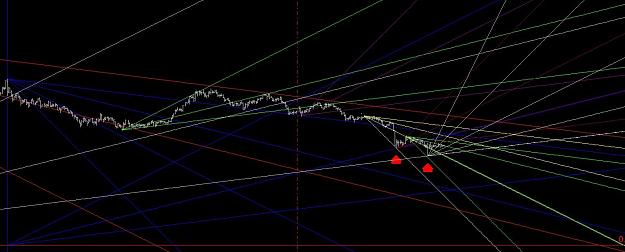
The red arrows show the use of angles from zero.Gann says they represent support points one could not find otherwise.They are of no use in day to day trading,but on days where severe selling happens I found them very helpful.
Planetary Cycles Trading (EUR/USD)
Attached Image (click to enlarge)
- Posts by Member Search: 'Xag'