- Search Metals Mine
- 84 Results
- Whatsmyname replied Jul 25, 2017
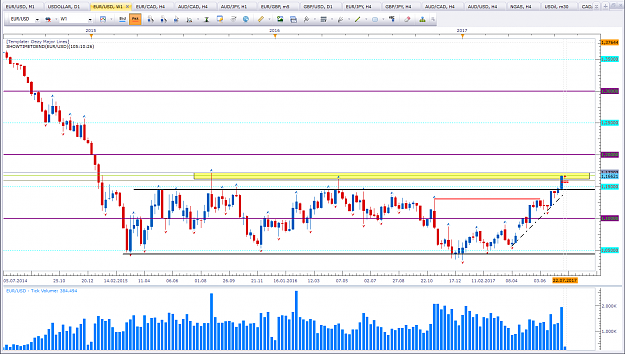
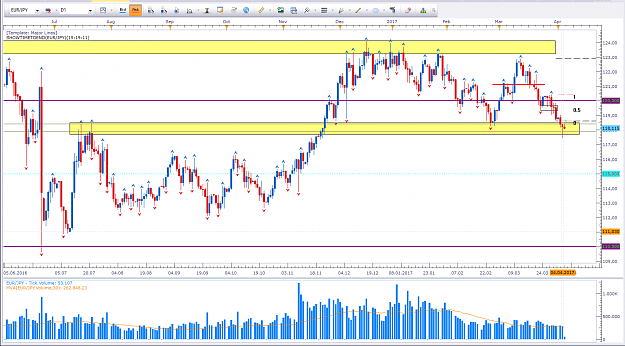
Thank you for the feedback. That's very helpful. I am looking for low volume down bars. Ideally we see a test of the 1,15 level with low volume. I assume that would be a great trigger. And I agree with the target. That was what I had in mind also. ...
vsa with Malcolm
- Whatsmyname replied Jul 24, 2017
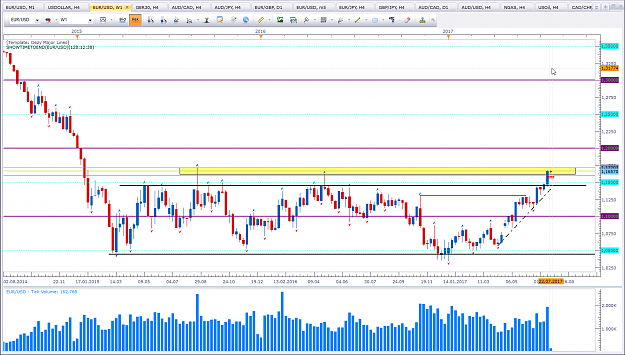
I have been a rather silent participant of this thread. I have been following EUR vs USD for quite some time. I'd like to ask for some feedback. It's the first time we see a close above the 1,15 level on the weekly basis. It seems to me we have a ...
vsa with Malcolm
- Whatsmyname replied Jul 19, 2017
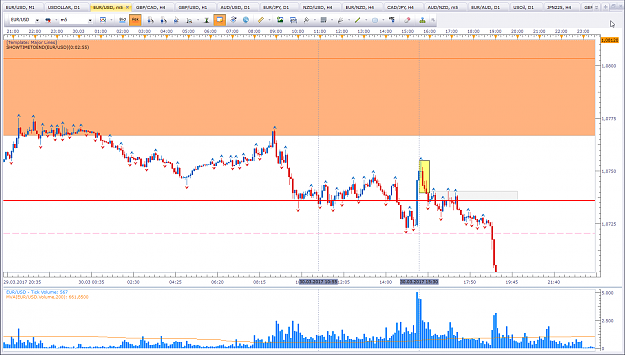
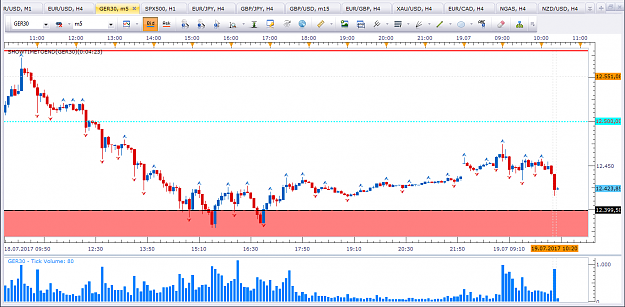
It's like you were reading my mind. I was just going to ask about this. We do have a break of the OR on increased volume. This would be the kind of break we look for right? Either we take the break or look for no demand bars. image
vsa with Malcolm
- Whatsmyname replied May 2, 2017
Thanks for your clear answer. It makes sense to wait for the higher timeframe to change and go in line with the higher timeframe. I seem to put more emphasis on the no demand bars rather then look for high activity. The up move was on low volume ...
vsa with Malcolm
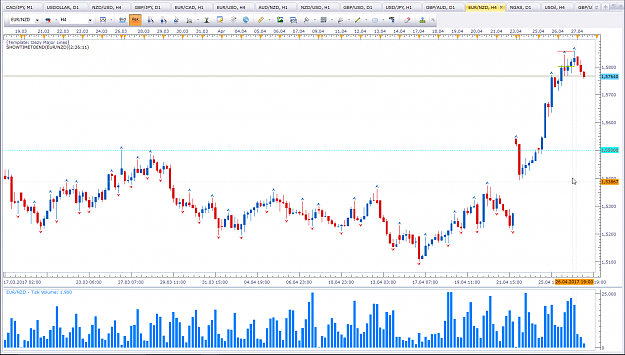
- Whatsmyname replied Apr 27, 2017
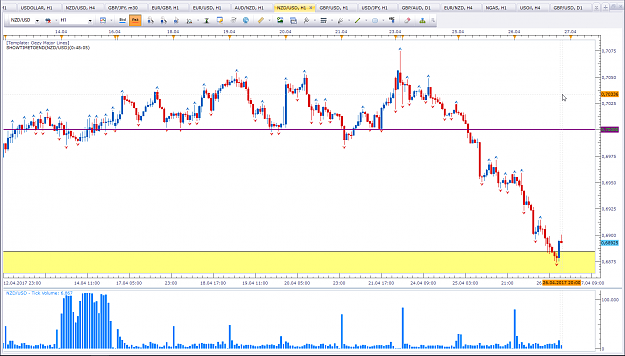
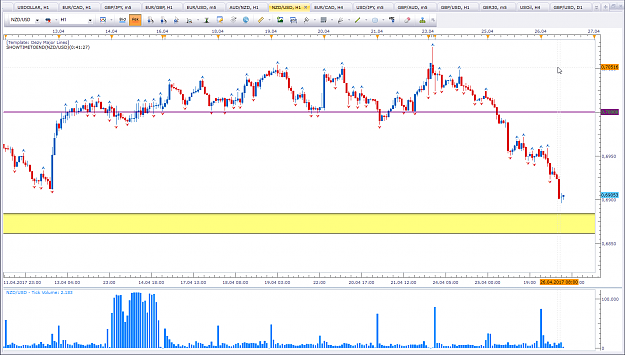
Stalking NZD vs USD Price is back at the daily support level. image We have narrow spread-down bars and low volume as price approaches this level. The question that comes to mind is, is this already a good sing to look for possible longs?
vsa with Malcolm
- Whatsmyname replied Apr 27, 2017
Highly appreciate your charts with the notes. Would be great of you if you sticked around. Accumulation and distribution is not always easy to spot. I understand market strucuture and try to incorporate it. But it is still confusing at ...
vsa with Malcolm
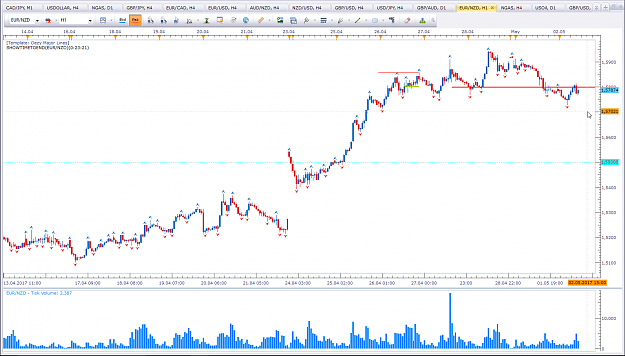
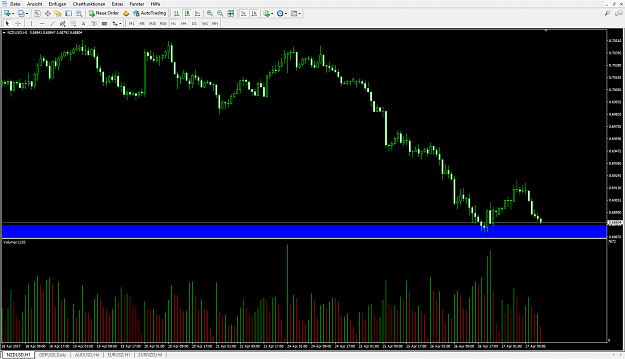
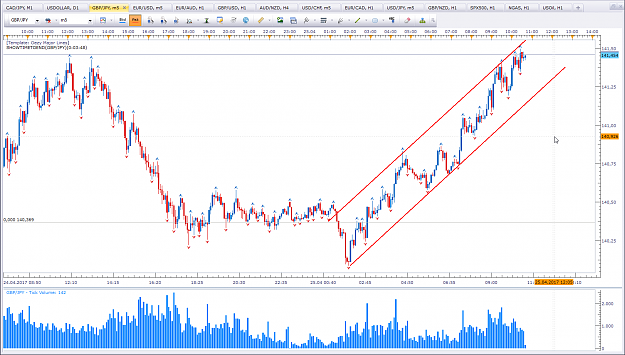
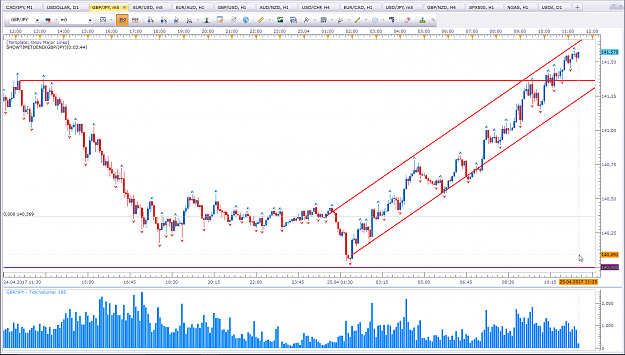
- Whatsmyname replied Apr 26, 2017
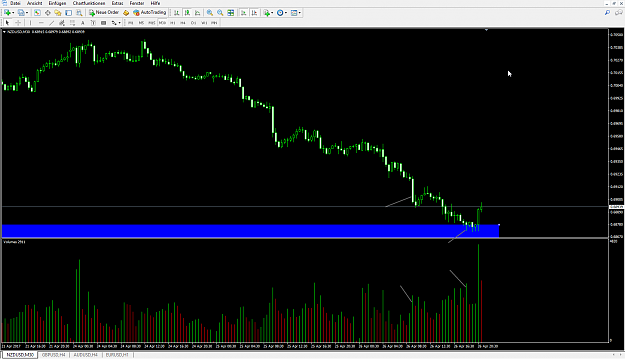
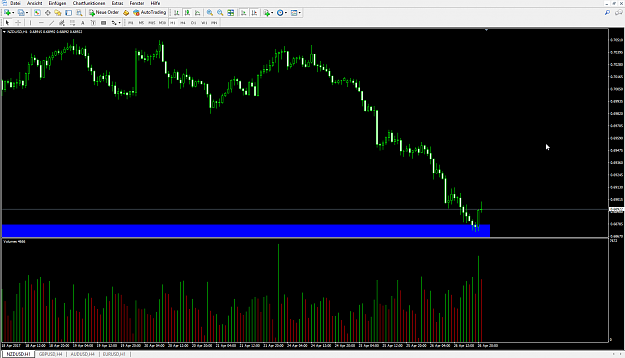
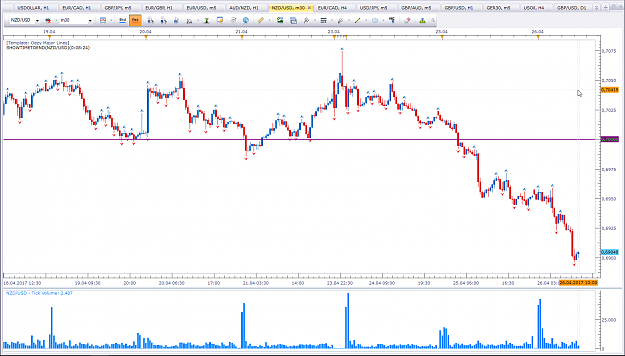
As mentioned in the above posts, price did penetrate the yellow rectangle. I did refrain from taking position. image Below is the chart using mt4. Volume is different. image Now price is bouncing off the daily support level. I'll wait for the ...
vsa with Malcolm
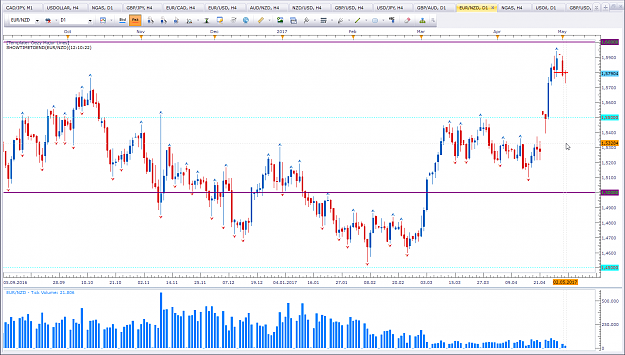
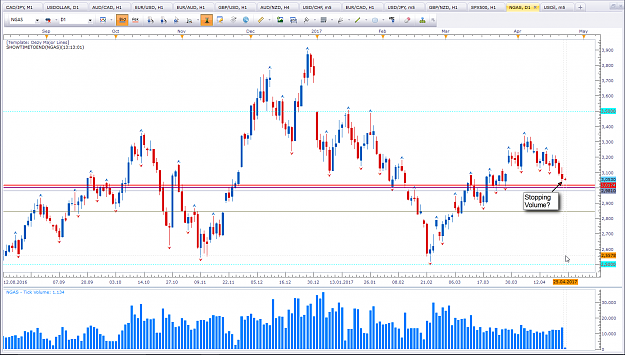
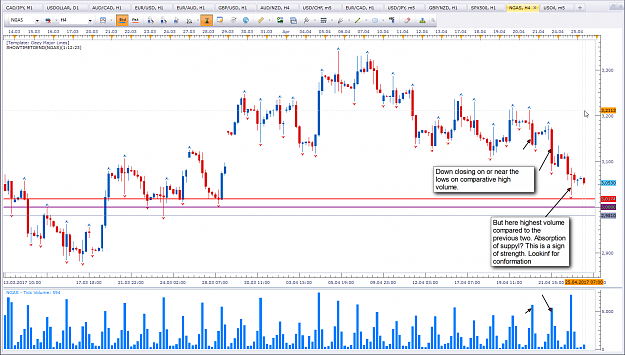
- Whatsmyname replied Apr 26, 2017
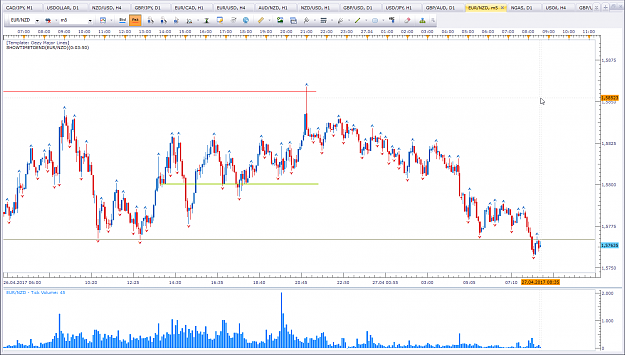
Am eyeing this pair also. image Our tick volume looks quite different though. I know about this issue so I also monitor this pair on MT4 as Hawkins suggested. There is a daily level a little further below that I highlighted with the yellow ...
vsa with Malcolm
- Whatsmyname replied Apr 25, 2017
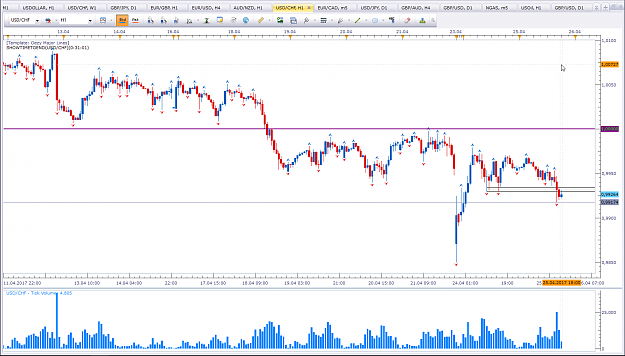
USD vs CHF very high volume on a down bar with the close in the middle. This action suggests stopping volume. Compared with the recent past volume this is very high appearing at a support level. image The next candle is down and on low volume ...
vsa with Malcolm
- Whatsmyname replied Apr 25, 2017
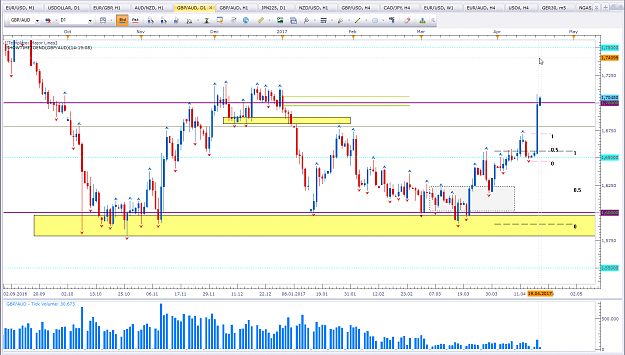
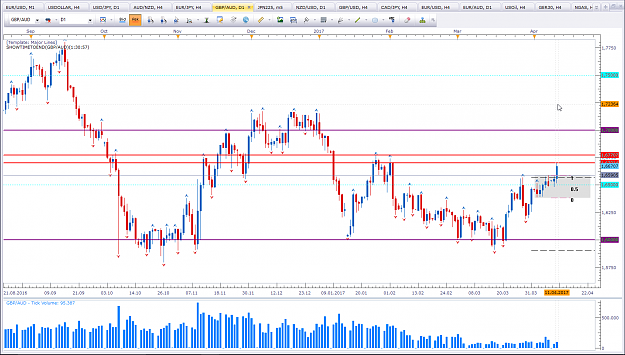
These are my thoughs on GBP vs AUD image The chart displays some thoughs of mine. I am looking for a weak really to the previous top, possibly a little higher inside the yellow rectangle. I am not looking to trade the up-thrust. Price has ...
vsa with Malcolm
- Whatsmyname replied Apr 25, 2017
A question about GJ image Price is at a previous top and having struggle to move above. There are volume surges each at the top. Now to move above the previous top we would need volume. Since the recent volume surges had no follow through this ...
vsa with Malcolm
- Whatsmyname replied Apr 25, 2017
It's sad that participation here diminished. I really like this thread and look forward to master vsa. I see merit to it, but can get confusing at times. I hope the pros will soon jump in and advise us and point the right direction. Looking forward ...
vsa with Malcolm
- Whatsmyname replied Apr 19, 2017
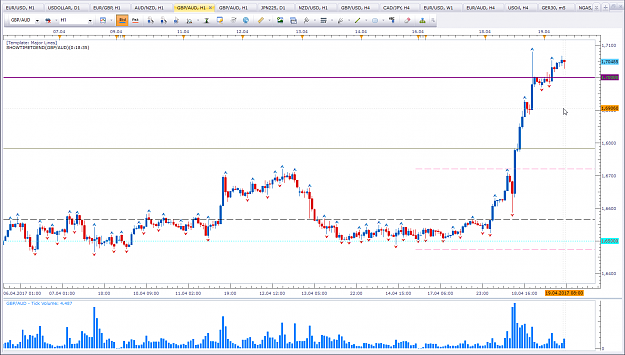
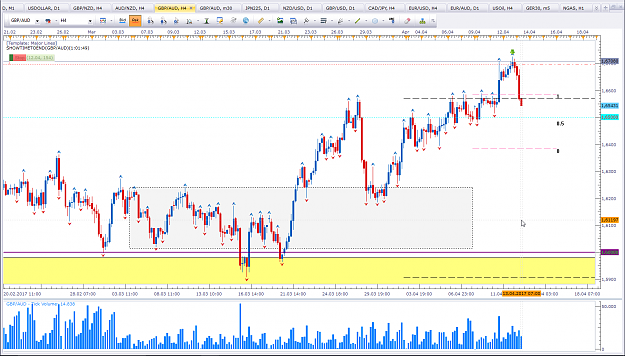
And this is the second asset. GBP vs AUD Price made a move back up. Volume is slightly above average, however compared with the spread volume is pretty low. So I am not expecting a sustained up-move. image Taking a closer look. image H1 shows ...
vsa with Malcolm
- Whatsmyname replied Apr 19, 2017
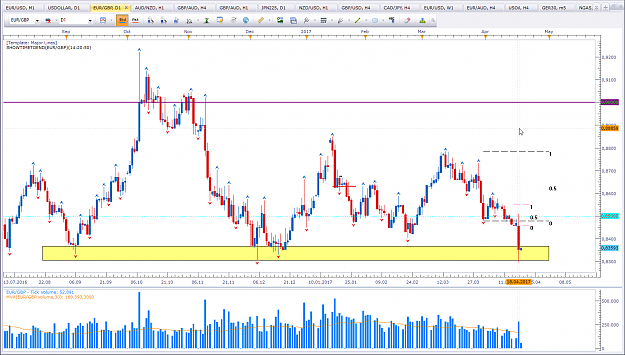
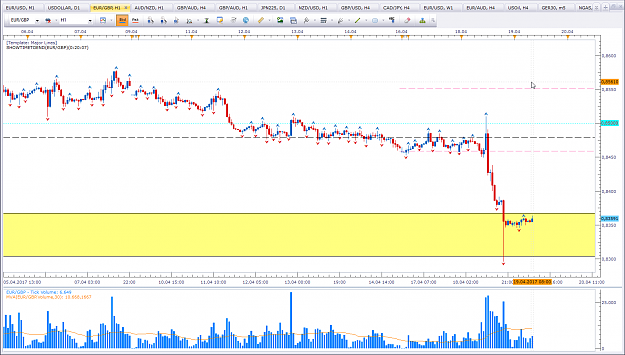
Here are two assets I am monitoring at the moment. I'll sepereate both assets in two posts. This is EUR vs GBP image The daily shows there is activity at the yellow zone. Taking a closer look. image Not sure if I read the market right. The way I ...
vsa with Malcolm
- Whatsmyname replied Apr 13, 2017
I took a trade GBP vs AUD. This is a live account. image Edit: I like to use MTFA. I monitored the higher timeframes and made my entry on m30. Wmn
vsa with Malcolm
- Whatsmyname replied Apr 13, 2017
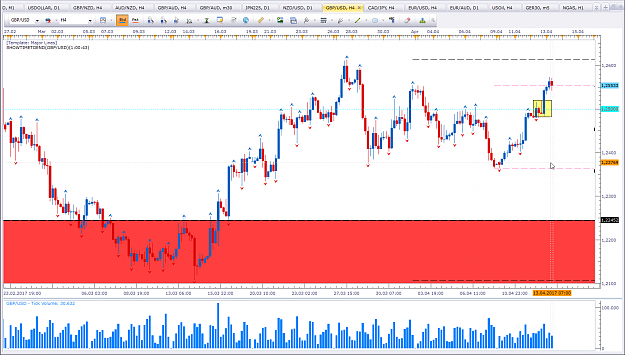
M3, Could you enlighten us about the perfect setup you mentioned? I assume it is the GBP vs USD. image I saw the weakness in the yellow rectangle. But there was no follow through. My bias for the week was bearish this asset. But I didn't get a ...
vsa with Malcolm
- Whatsmyname replied Apr 11, 2017
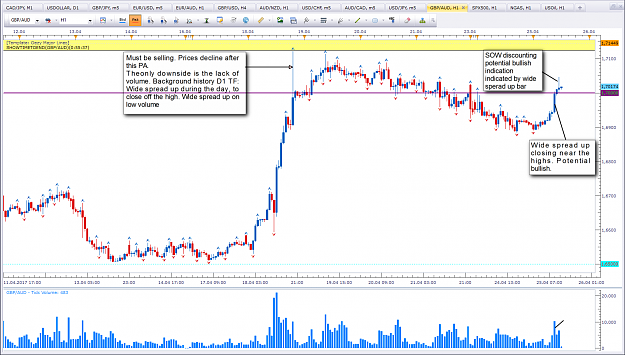
Hi all, I am monitoring GBP vs AUD. This asset has been moving on low volume since March, which makes the analysis rather difficult. I'll try my self anyway and look for some feedback. Price did break out of a congestion today on low volume. This ...
vsa with Malcolm
- Whatsmyname replied Apr 6, 2017
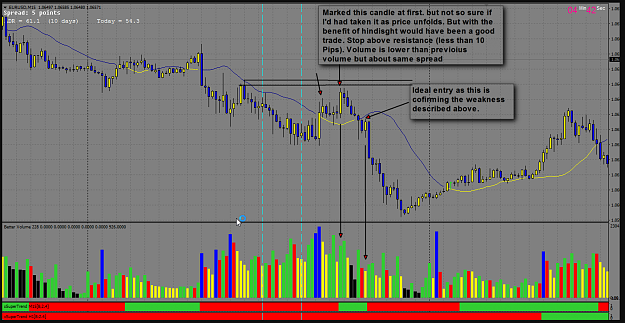
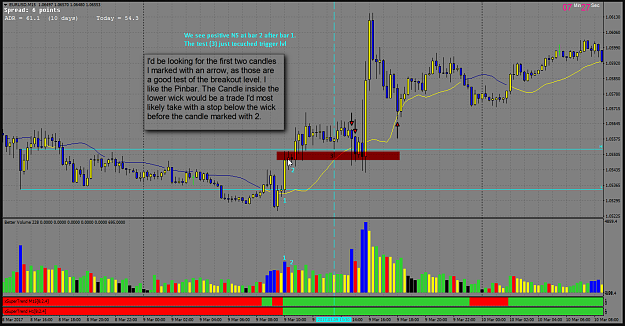
Hi Lucky, I am still new to this type of analysis but I'll share my two cents for what it's worth. I took your charts and modified them as I see fit with nots on the charts. This is your first chart. image I wouldn't have taken the first candle ...
vsa with Malcolm
- Whatsmyname replied Apr 5, 2017
Good morning, traders. I am looking at EJ. image Yesterday we had a Shake-Out. Am looking for a long from here possilby on a lower timeframe. Any feedback on Shake-Outs is highly appreciated. Cheers, Wmn
vsa with Malcolm
- Whatsmyname replied Mar 31, 2017
Great explanation odines. Thanks a lot. This form of analyis is quite new to me, so trying to put into practice what I studied. I was looking only at the m5 timeframe. The reason for my entry was to test my reading skills. I am glad I was able to ...
vsa with Malcolm