- Search Metals Mine
- 34 Results
-
 VagyokC4 replied Jun 12, 2009
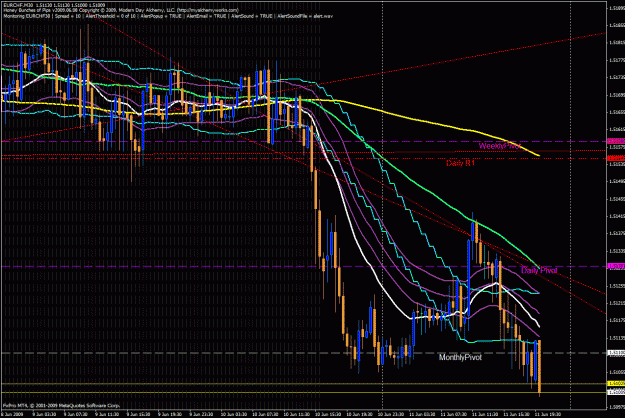
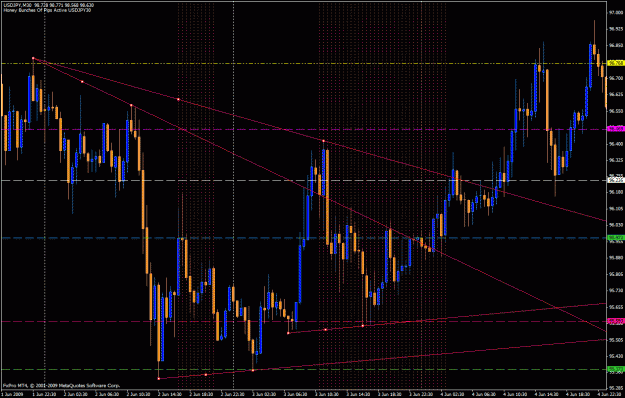
Once price broke our down channel it gave us one last opportunity to get out with maximum profits. Once that double bottom was in place it was time to shut this trade down. No need to carry over the weekend. Speculating, I expect price to touch the ...
Honey Bunches of Pips (Easy system for newbie traders)
- VagyokC4 replied Jun 12, 2009
So price is moving down nicely. Notice how we are bouncing down off of the green line. This is a normal trending speed. Also notice the red lines the one providing resistance is from the TOP two highs and is also containing price well. Until we ...
Honey Bunches of Pips (Easy system for newbie traders)
- VagyokC4 replied Jun 11, 2009
Now it appears we are starting the next wave down. We had a nice pull back to the green line and we have now made a lower low. According to Elliot Wave this should be wave 3. Lets see how many pips we can get out of this honey bunches
Honey Bunches of Pips (Easy system for newbie traders)
- VagyokC4 replied Jun 10, 2009
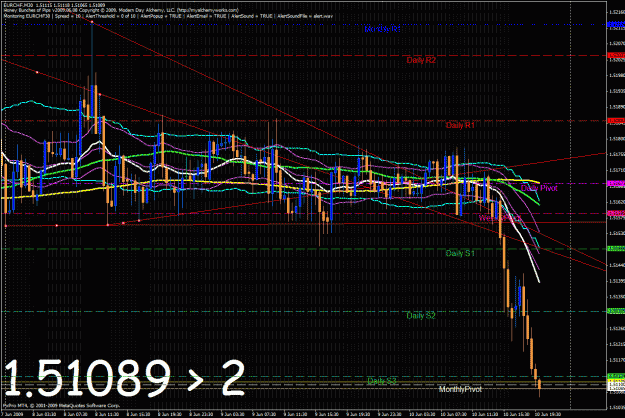
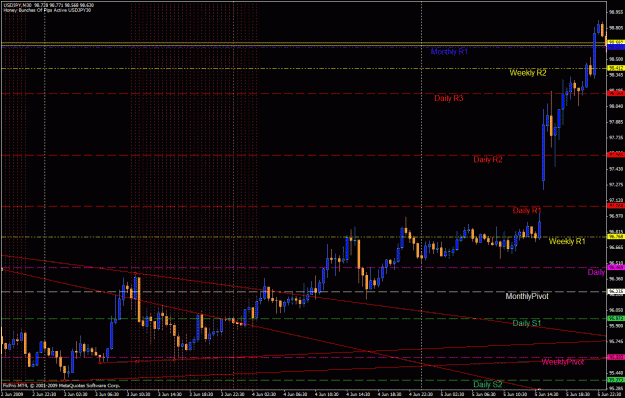
Well look what finally decided to break... And as predicted it was the Weekly Pivot that gave way. This is a pattern that seems to repeat itself over and over again. If price does not get rejected by a pivot and "hangs around" chances are it will ...
Honey Bunches of Pips (Easy system for newbie traders)
- VagyokC4 replied Jun 10, 2009
Well to be honest I'm happily surprised that this thing hasn't broke yet. Maybe it's waiting for Wednesday/Thursday night... First thing is for sure.... once this thing starts to go, hold on to your seats, and try not to miss it
Honey Bunches of Pips (Easy system for newbie traders) Hopefully it will ...
- VagyokC4 replied Jun 9, 2009
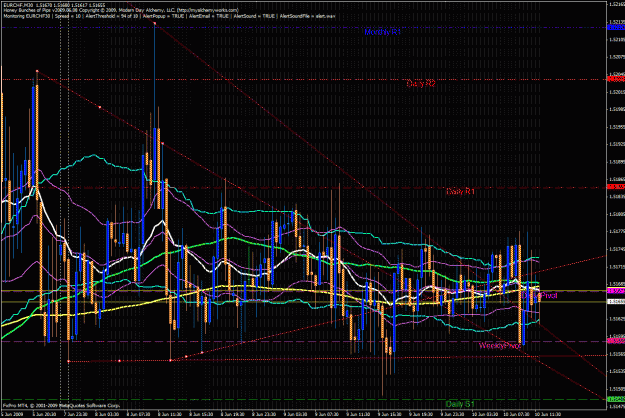
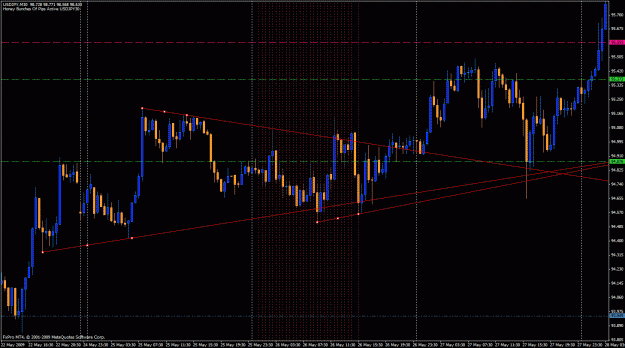
So he we are with 61 bunches (not counting the previous series of bunches). We have clear support and resistance converging on each other. One side will win the war and we want to take advantage of it
Honey Bunches of Pips (Easy system for newbie traders) My bias is now maybe to the down side 1) ...
- VagyokC4 replied Jun 9, 2009
Ok, this is setting up quite nicely. These are the type of movements my Honey Bunches of Pips was design to alert to. All of this sideways trading means we are going to break, and once we do, hold on to your pip counter
Honey Bunches of Pips (Easy system for newbie traders) Right now I do not have a ...
- VagyokC4 replied Jun 8, 2009
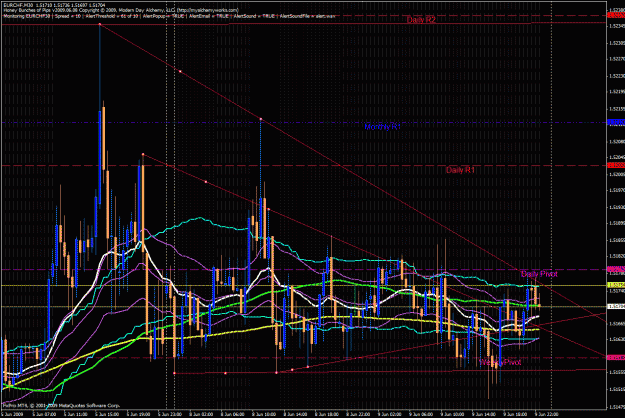
So as I expected, the R1 line up there was heavy resistance. If you traded that, hopefully you were not greedy and banked some profits
Honey Bunches of Pips (Easy system for newbie traders) If not, hopefully at least you managed risk and did not allow your trade to go negative We are waiting for ...
- VagyokC4 replied Jun 8, 2009
As expected the daily pivot resistance now broken has turned into support. We are finding support on the blue line, but I do expect a pull back to the white line. We have completed our last signal with 18 bunches and I will follow up once more once ...
Honey Bunches of Pips (Easy system for newbie traders)
- VagyokC4 replied Jun 8, 2009
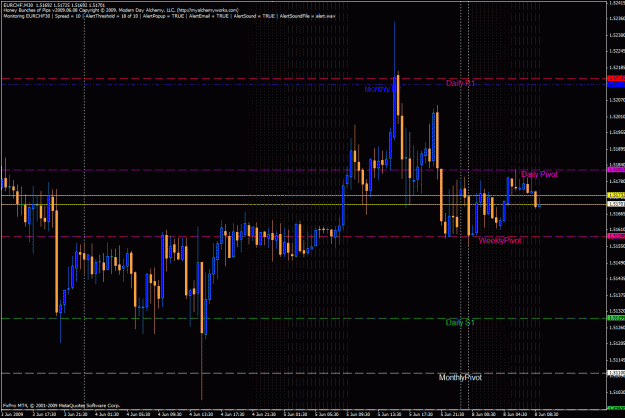
Well it looks like the weekly pivot won over the daily pivot. Was anyone surprised? The Higher time frames should always be given more precedence than the lower time frames. Now we have higher lows and higher highs. I think this market will move up, ...
Honey Bunches of Pips (Easy system for newbie traders)
- VagyokC4 replied Jun 8, 2009
Now it appears that we have a fight on our hands. (This is what we've been waiting for
Honey Bunches of Pips (Easy system for newbie traders)) Notice the three tails that could not penetrate the Daily Pivot. A good breakout strategy would be to place pending orders on both sides of the Daily / Weekly ...
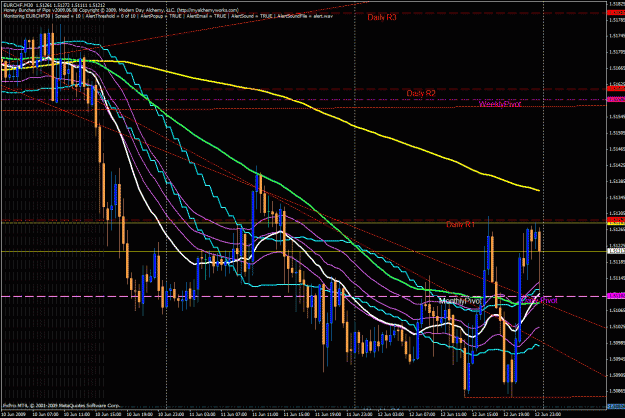
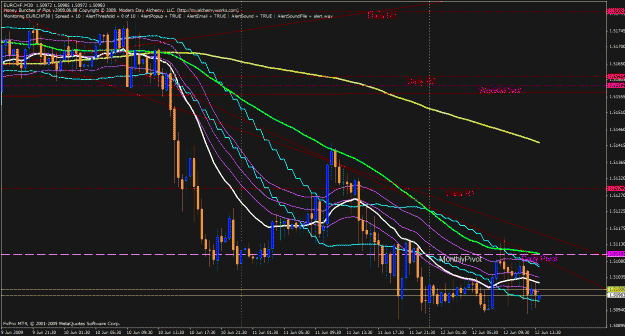
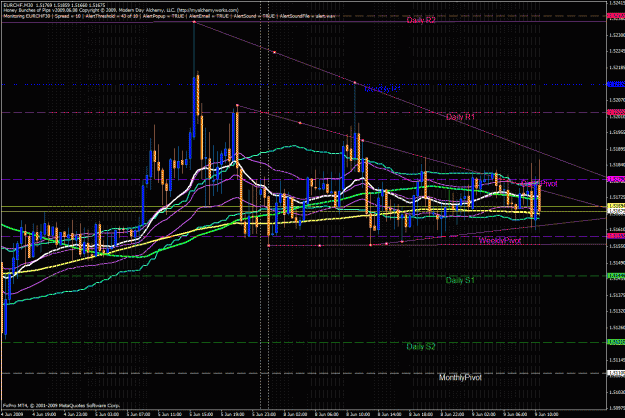
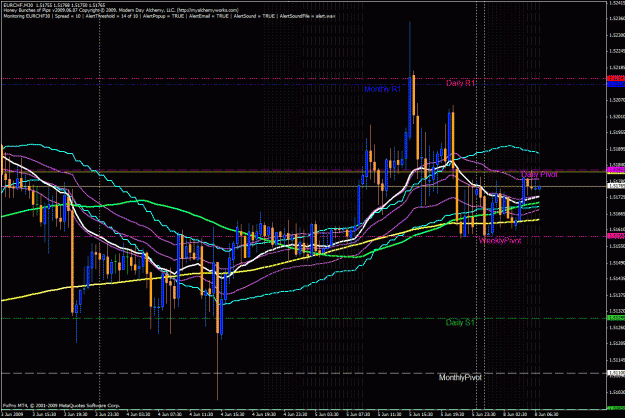
- VagyokC4 replied Jun 7, 2009
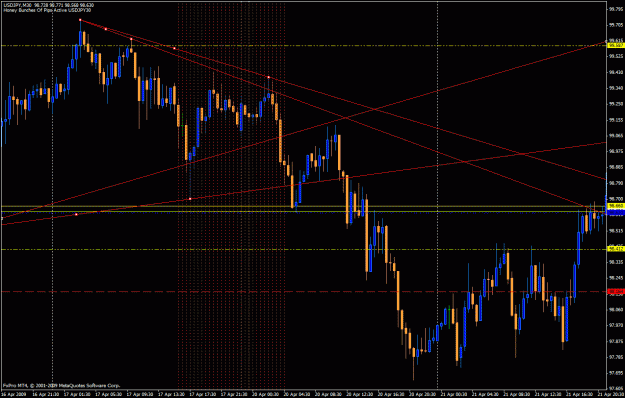
EURCHF M30 SIGNAL — Okay, We have our first signal of the week. From the looks of this it wants to go up. I'm liking the floor down on the Weekly Pivot. Typically I don't trade on Sunday's so I will continue to watch this guy a little longer. ...
Honey Bunches of Pips (Easy system for newbie traders)
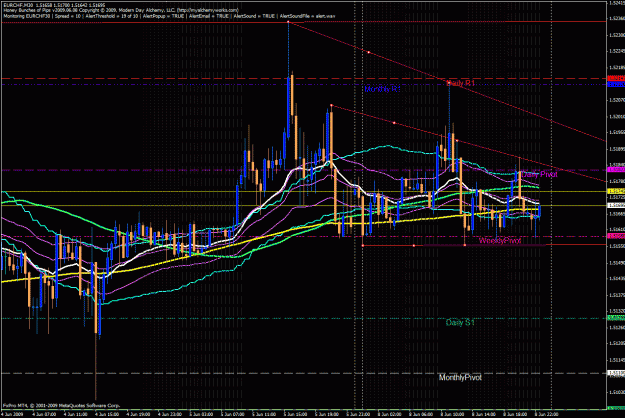
- VagyokC4 replied Jun 7, 2009
Example #6 — Here is an example to illustrate the strategy. First Pic shows the alert and S/R lines that we know about. Second Pic shows the outcome. Here we can see that price was not able to break back up through the colored lines and gave ...
Honey Bunches of Pips (Easy system for newbie traders)
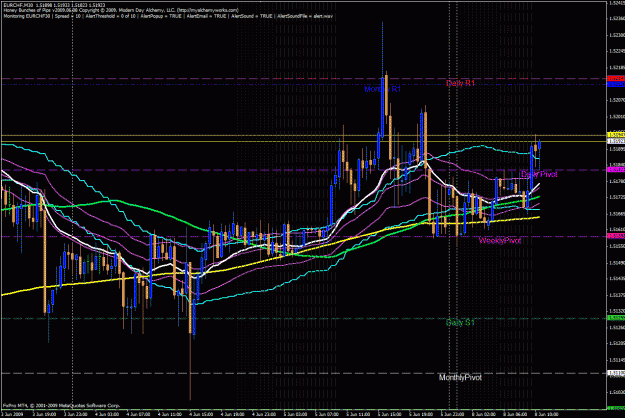
- VagyokC4 replied Jun 7, 2009
Example #5 — Here is an example to illustrate the strategy. First Pic shows the alert and S/R lines that we know about. Second Pic shows the outcome. Okay, by now I hope you understand that my lines are only to help fill in the picture of ...
Honey Bunches of Pips (Easy system for newbie traders)
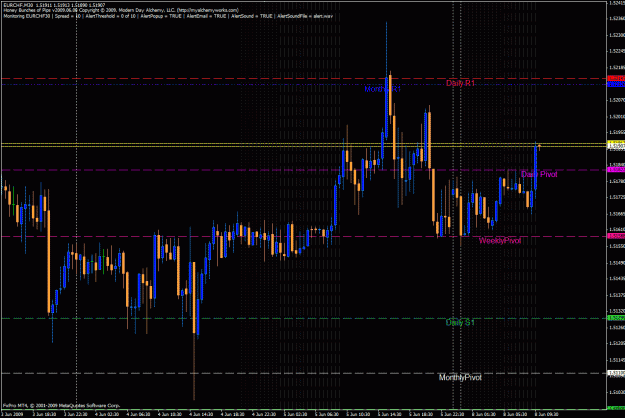
- VagyokC4 replied Jun 7, 2009
Example #4 — Here is an example to illustrate the strategy. First Pic shows the alert and S/R lines that we know about. Second Pic shows the outcome. Notice that now I have a few more lines on my chart. This is the chart that I trade with all ...
Honey Bunches of Pips (Easy system for newbie traders)
- VagyokC4 replied Jun 6, 2009
Example #3 — Here is an example to illustrate the strategy. First Pic shows the alert and S/R lines that we know about. Second Pic shows the outcome. Remember, what we want to look at are the support resistance areas as this will tell us where ...
Honey Bunches of Pips (Easy system for newbie traders)
- VagyokC4 replied Jun 6, 2009
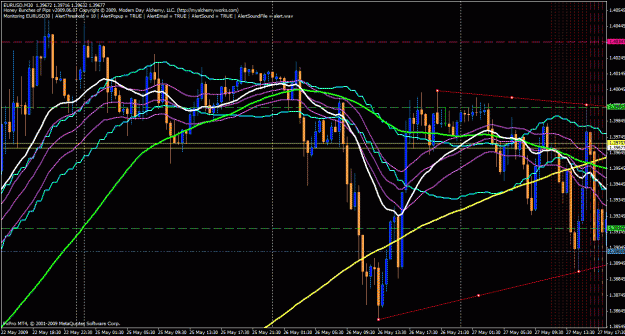
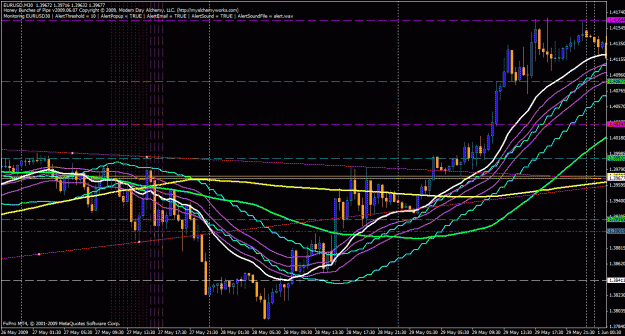
Example #2 — Here is an example to illustrate the strategy. First Pic shows the alert and S/R lines that we know about. Second Pic shows the outcome. Notice the nice double bottom with higher lows
Honey Bunches of Pips (Easy system for newbie traders)
- VagyokC4 replied Jun 6, 2009
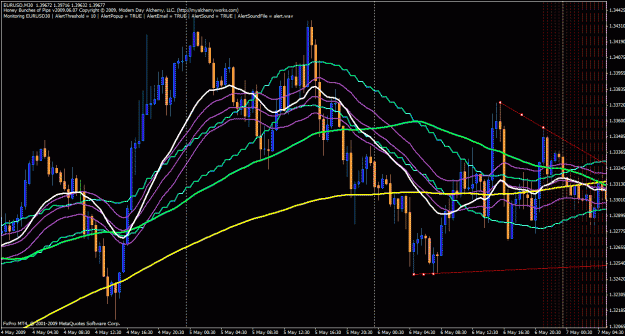
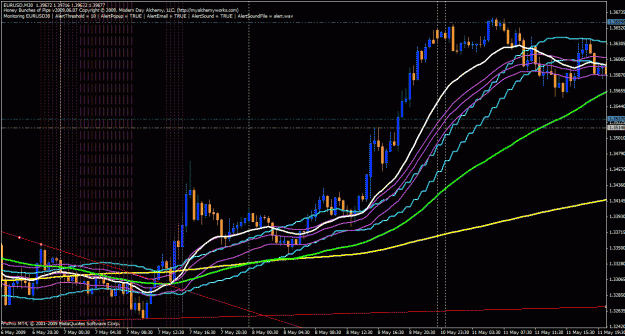
Example #1 — Here is an example to illustrate the strategy. First Pic shows the alert and S/R lines that we know about. Second Pic shows the outcome. Notice the nice double top within the Honey Bunches
Honey Bunches of Pips (Easy system for newbie traders)
- VagyokC4 replied May 24, 2008
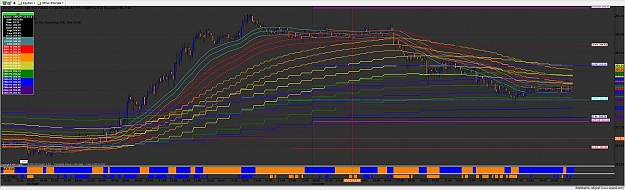
Here is an M8 chart with multiple EMA TF's (8,15,30,H1,H2,H3,H4) for your viewing pleasure... Ignore the color lines at the bottom.. I was just focusing on the 34 EMA's and how price gave a CLEAR long signal... (or STOP & REVERSE) if we were going ...
34 EMA Trading Strategy for newbie's :)
- VagyokC4 replied May 20, 2008
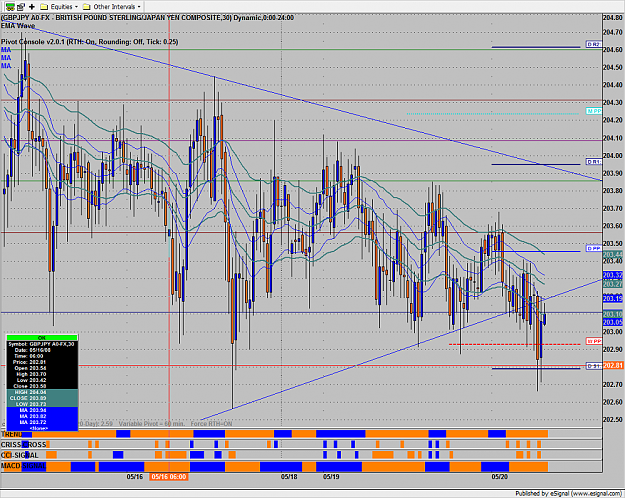
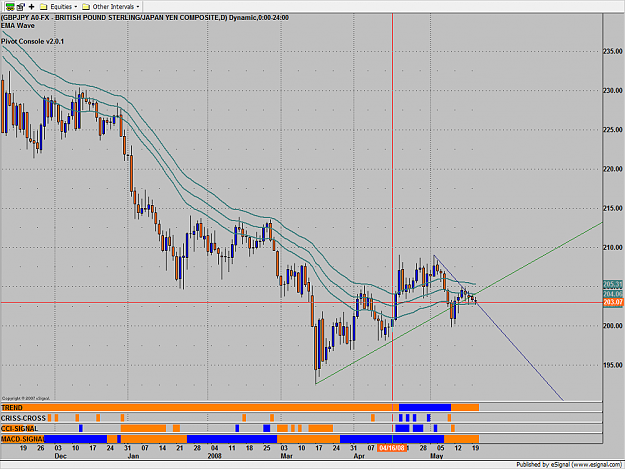
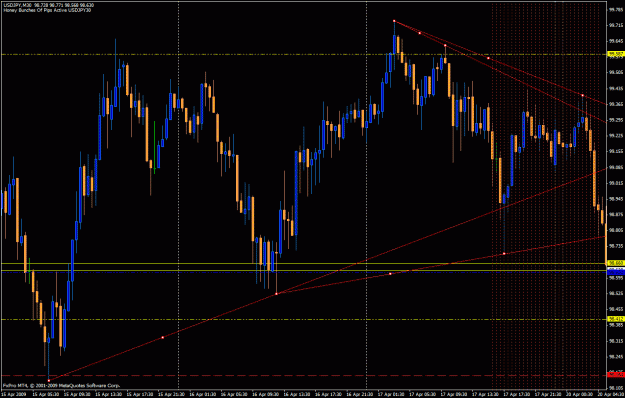
Here is my M30... It doesn't take long to see the slow down pressure (lower highs) that is being applied to PA right now... My Daily shows the Gann lines we are up against (203.07 ATM) which I think can take credit for the way the down pressure is ...
34 EMA Trading Strategy for newbie's :)