- Search Metals Mine
- 159 Results
-
 Tiggrrr replied Nov 28, 2018
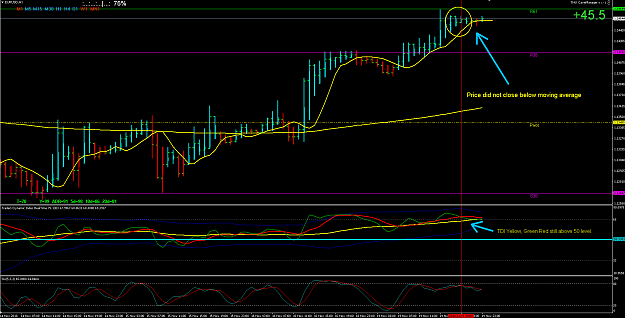
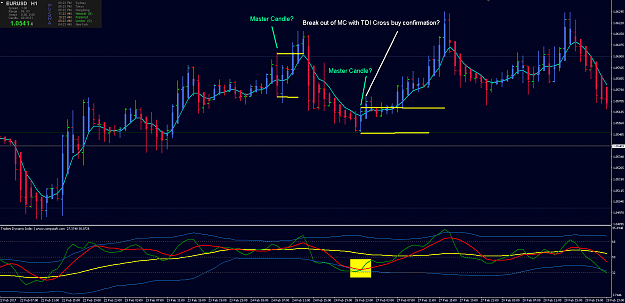
Here is a good example which can lead to potential failure. My old self would enter this trade expecting the TDI to cross up nicely in the foreseeable future...but from countless failed attempts this would be something I would NOT consider a ...
Trading Made Simple
- Tiggrrr replied Nov 25, 2018
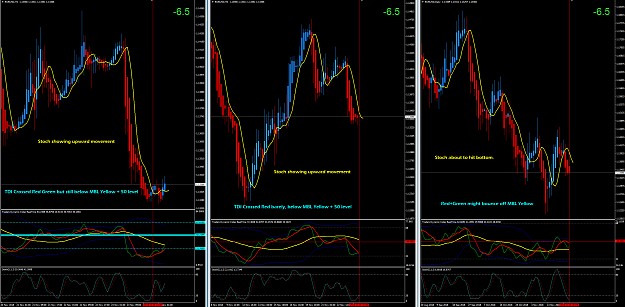
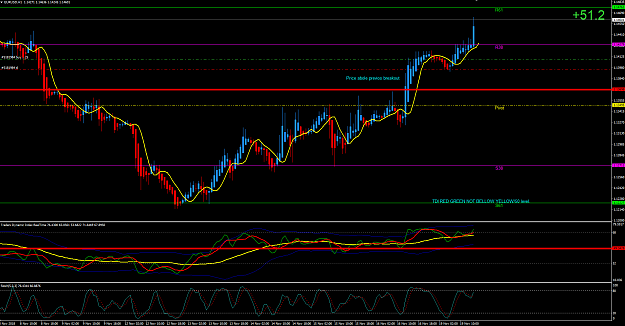
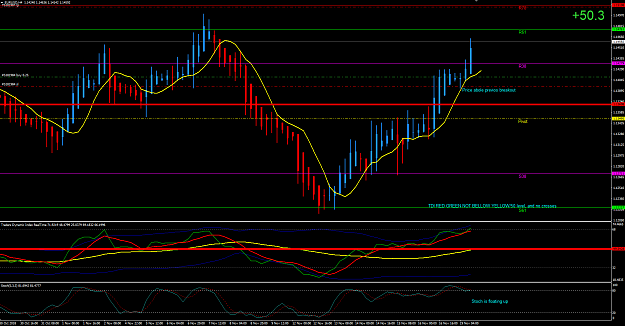
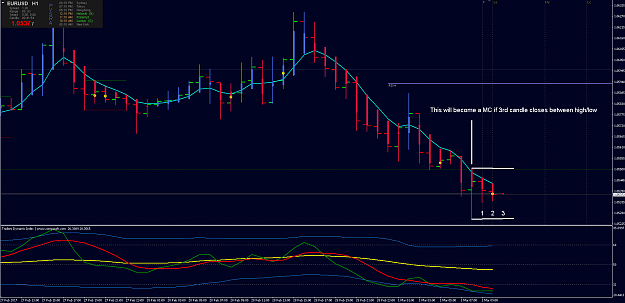
So here is a photo of 1H, 4H, and Daily. Normally I would enter long when such setup arises, but after many failed attempts at catching any fish I've learned that waiting for a better setup PATIENTLY is the best option. TDI on the H1 looks like its ...
Trading Made Simple
- Tiggrrr replied Nov 19, 2018
Here is another little example. Jumping in to quickly is due to psychology...your brain is telling itself that opportunities are very scarce which causes impulse decisions to be made. The truth is that there are countless amounts of opportunities ...
Trading Made Simple
- Tiggrrr replied Nov 19, 2018
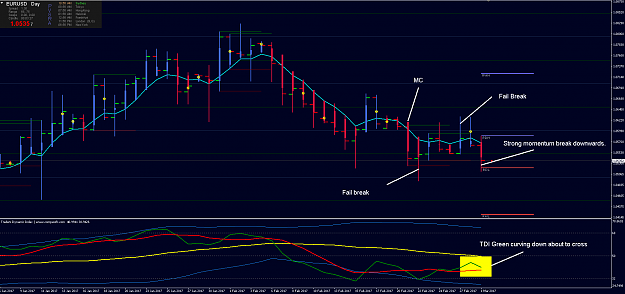
Here is why I would have not shorted the EURUSD. Which btw it is best to look at the larger time frame to know the direction of the trend. Sure it might create confusion or some kind of bias...but over time you'll learn simply through trial and ...
Trading Made Simple
- Tiggrrr replied Mar 16, 2017
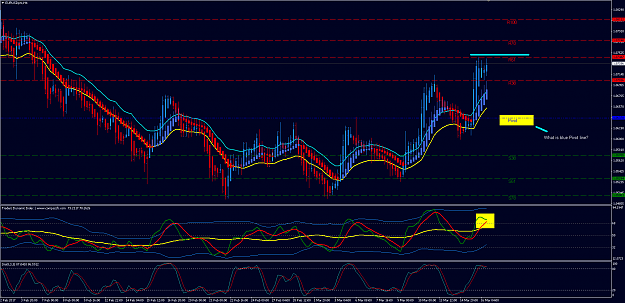
EURUSD touched R61 and seems to be a well-tested resistance with TDI curving down as confluence. Nonetheless, I'm very uneducated with the main blue pivot line. What does it show exactly? Is it merely a ranging area?
Pivot Trading
- Tiggrrr replied Mar 3, 2017
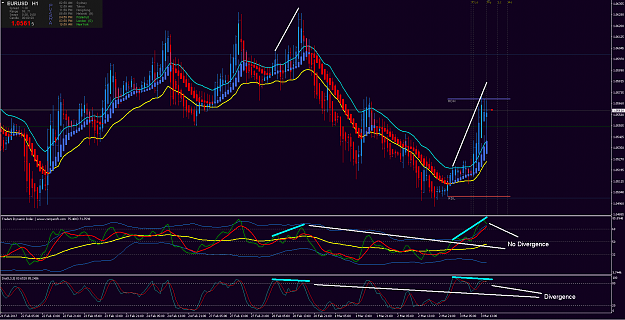
Is my TDI lagging? Divergence is shown on Stochastic but not on TDI.
Trading Made Simple
- Tiggrrr replied Mar 1, 2017
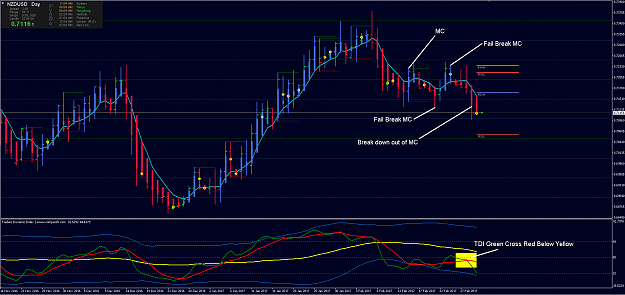
NZDUSD Analysis with MC breakout with the TDI in confluence.
Trading Made Simple
- Tiggrrr replied Mar 1, 2017
You are absolutely amazing for sharing all of this. I'll be studying this all day and implement it asap.
Trading Made Simple
- Tiggrrr replied Feb 13, 2017
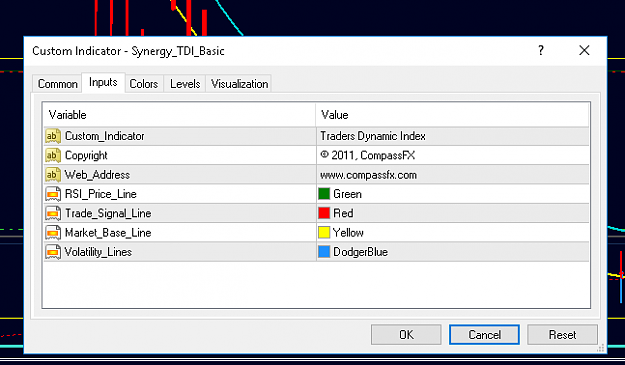
Using TDI from compassfx.com Seems like the settings are fixed. image
Trading Made Simple
- Tiggrrr replied Feb 12, 2017
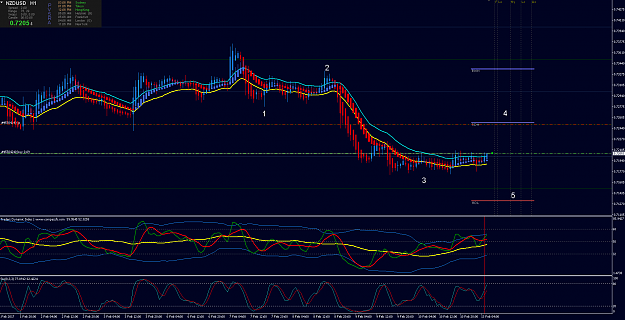
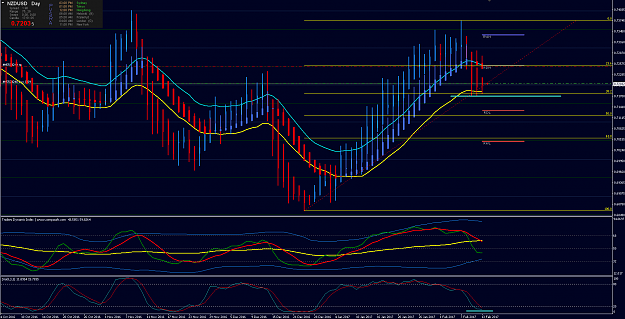
Greetings Everone! Here is my analysis using TMS for NZDUSD: Looking at the 1H we can see the TDI cross very nicely with confluence with the STO. image Looking at the Daily to see where everything is heading the STO and TDI seem like it has ...
Trading Made Simple
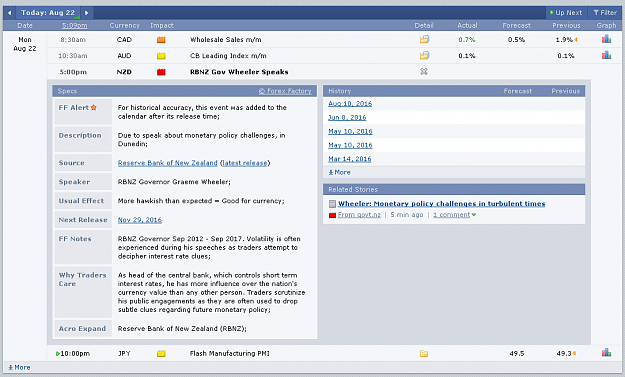
- Tiggrrr replied Aug 22, 2016
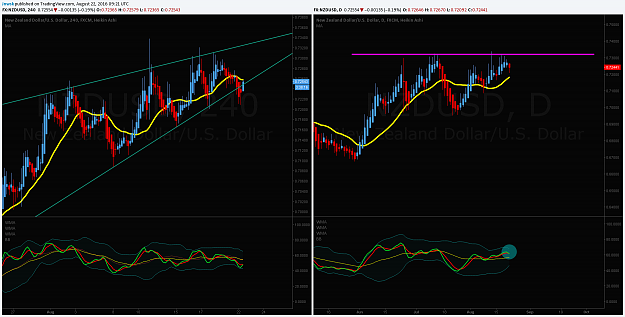
NZDUSD Price on the Daily has made a double top and TDI is flat.
Trading Made Simple
- Tiggrrr replied Jun 14, 2016
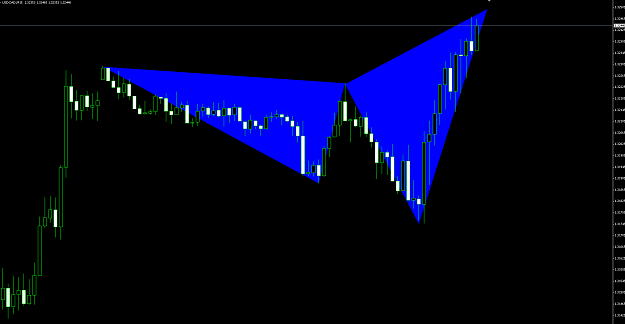
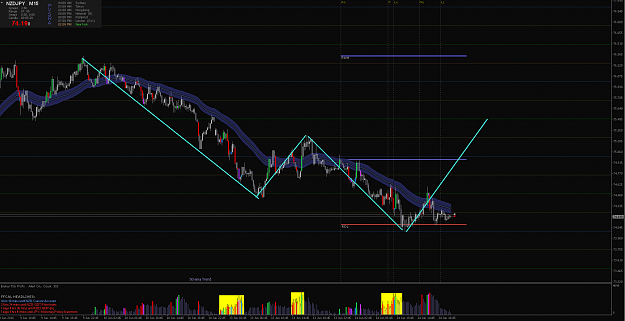
NZD/JPY - BULL Notice here the increase in volume near the angles to complete the crab. And right at near levels.
PVSRA (Price, Volume, S&R Analysis)
- Tiggrrr replied Jun 14, 2016
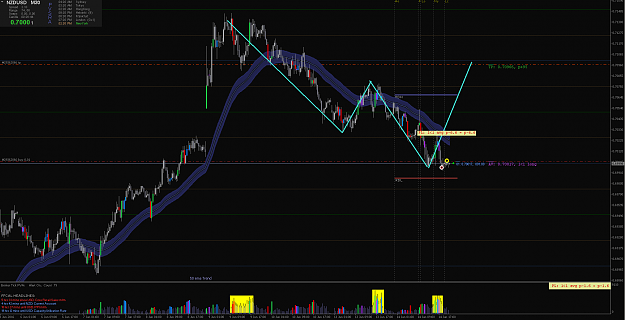
NZD/USD - BULL Possible crab formation. Notice increase in volume at each completed angle.
PVSRA (Price, Volume, S&R Analysis)
- Tiggrrr replied Jan 21, 2016
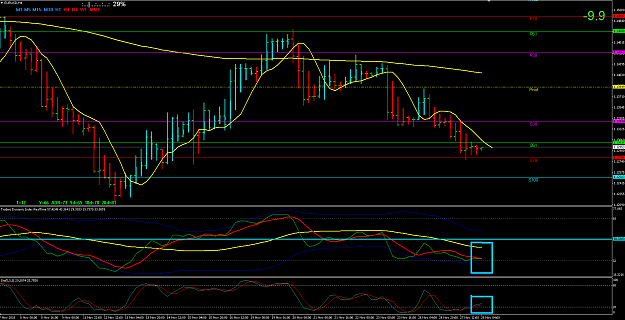
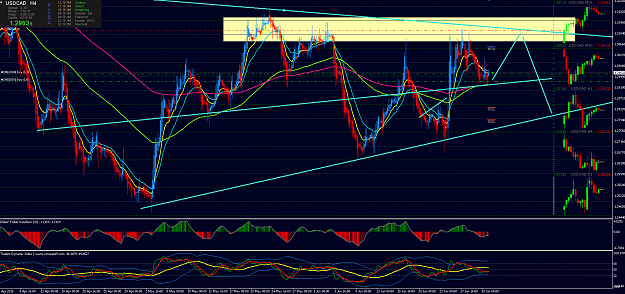
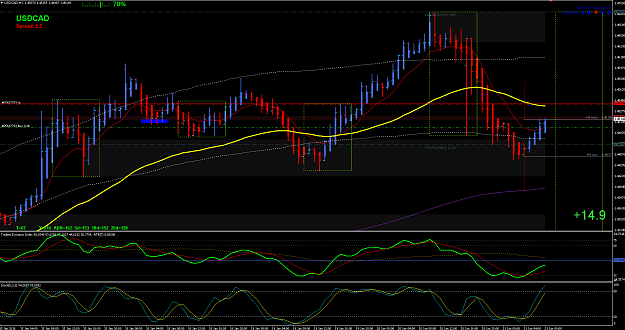
USD/CAD. Aimed for a TP right at the resistance and it did just that. Since red and green are right below the yellow base line at the 36 fib level it may potentially bounce back onto its continuation to the 200 MA. Stoch is giving a signal to short ...
Trading Made Simple
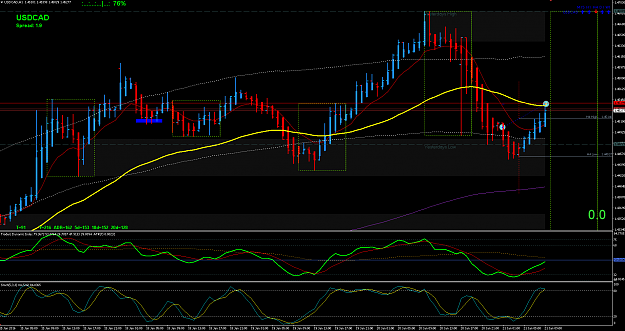
- Tiggrrr replied Jan 21, 2016
Greetings! Entered trade when green crossed red. Its below the base line but seeking a pullback before LO opening which will determine its continuation. Maybe potential bounce off 50 moving average for its continuation down to touch 200 MA. Time ...
Trading Made Simple
- Tiggrrr replied Sep 21, 2015
Hello Everyone. I'm giving this babe a shot.
Making Bank: The Harmonic rhythm of the market