- Search Metals Mine
- 80 Results
-
 Thtpro replied 47 hr ago
I've used Indicators to trade since 2008 I would read Robert Miners Book High Prob trading strats - It is Elliott Wave, but, there's a bigger picture if you sit and think about it, there he tells you how to use Indicators at reversal points - you ...
How to properly use indicators
- Thtpro replied May 2, 2024
Here's a practical use of Jenkins Remember markets are DYNAMIC and not static, which means that they [price action] is twisting and turning on higher dimensions than we are able to see - this is WHY nothing works all the time, as it spins in and out ...
Michael S. Jenkins teachings
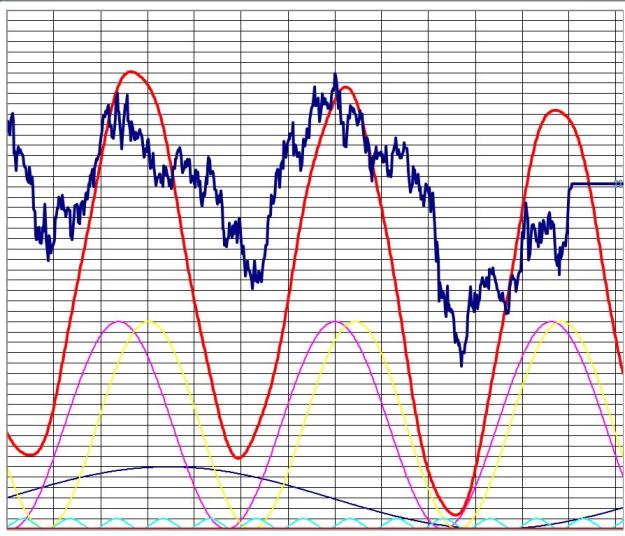
- Thtpro replied Apr 30, 2024
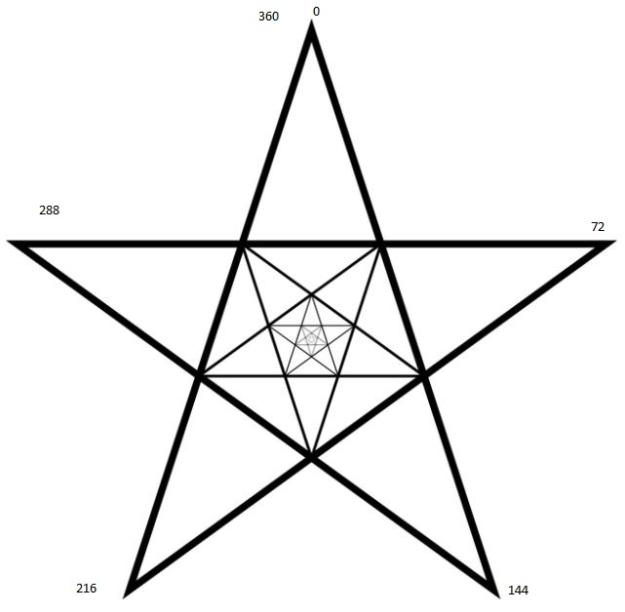
Then when you harmonically drill down the 72 degrees, a harmonic is 18 degrees and the following can be seen (note I took this screen shot in 2018, hence why not up to date price action wise) image You will be stretched to find this harmonic ...
Michael S. Jenkins teachings
- Thtpro replied Apr 30, 2024
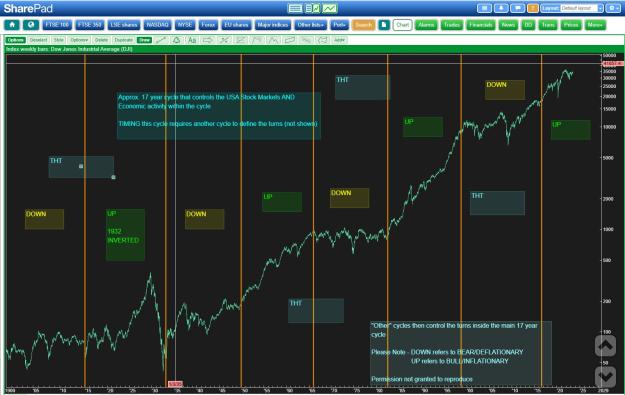
From the DJIA data look for this cycle - This is the CYCLE - notice the repetition UP/DOWN....... From there, you can mark the BIG LOWS 1942,1974 & 2009 and note the timing between - If you are still alive when the next one occurs = BEST time to buy ...
Michael S. Jenkins teachings
- Thtpro replied Apr 30, 2024
This is from TODAY Another multiple R profit trade Daily was in a position for the p[ast few days for a "pop" higher based on everything discussed image Then it wasn't until TODAY that the 15 min chart got its act together and formed a tradable ...
Indicator to identify tops and bottoms?
- Thtpro replied Apr 30, 2024
Don't try to understand why - it will drive you insane! There's not always a reason - the market is definitely working out to geometric %'s, but trying to piece it all together all the time is Impossible At times you can, but 95% of the time you ...
Michael S. Jenkins teachings
- Thtpro replied Apr 29, 2024
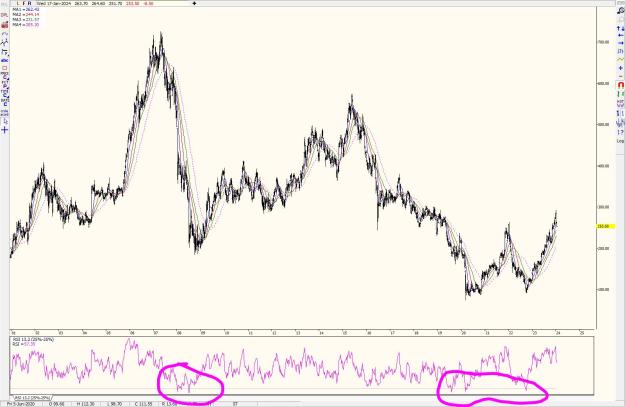
This is what I meant about dual time-frames DAILY - This chart shows the explosion bar, the PRIOR bar, was 2RSI <25% = get ready for a possible up move reversal of some degree image Intra-day - Look for set-up and get in if possible image Your ...
Indicator to identify tops and bottoms?

- Thtpro replied Apr 27, 2024
You can alter the settings of any indicator to use it to move with the markets price cycles - some of these price cycles will be poor, but some of them will be brilliant - I've used this method for years to amazing success The key is to use it in ...
Indicator to identify tops and bottoms?
- Thtpro replied Apr 26, 2024
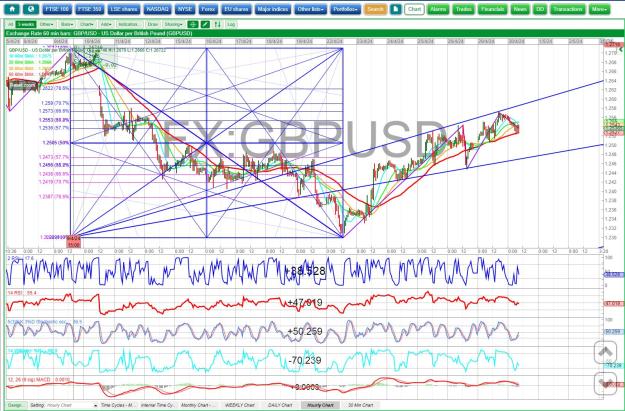
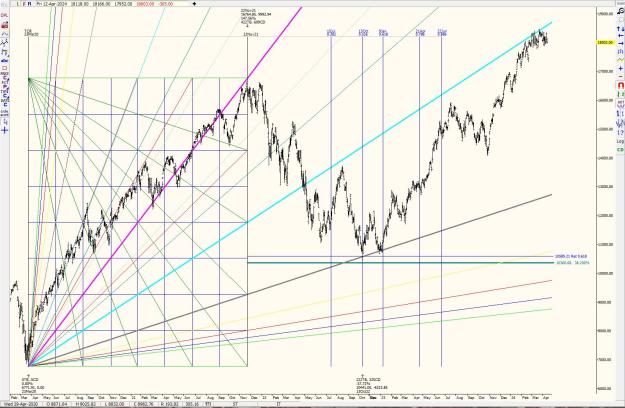
I'll shove this here - its Gann/Jenkins esq sort of Nasdaq100 from 2020 rally See how everything fits together? Draw the Gann Box around price action / Draw Gann Angles using the 1 x 1 as the diagonal of the box / run retracements AND also GEOMETRIC ...
Michael S. Jenkins teachings
- Thtpro replied Apr 26, 2024
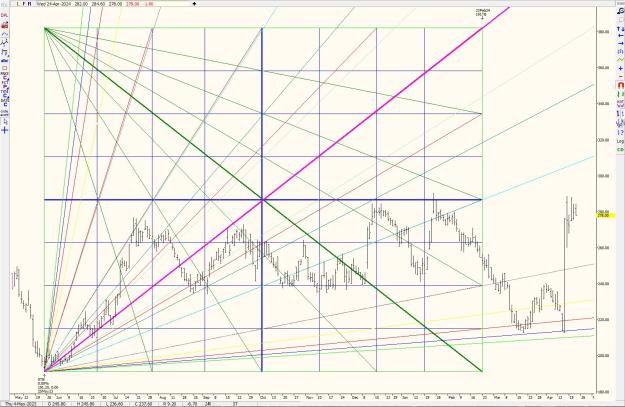
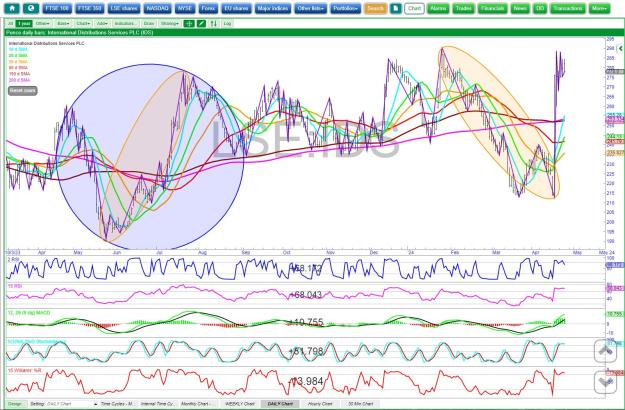
Fingers crossed I've never got on that well with Ellipses for trading The chart below is the same market as above LSE:IDS - I just used DT software to analyse the timing What I did was took the LOW 191.2, doubled it and ran TIMING out by the same ...
Michael S. Jenkins teachings
- Thtpro replied Apr 25, 2024
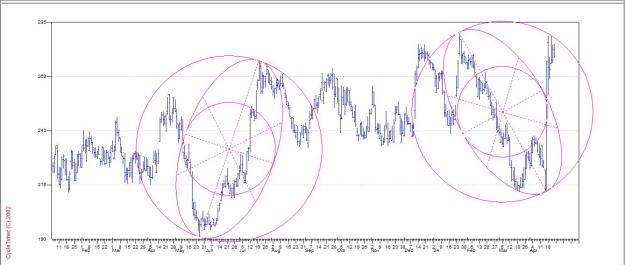
I have no idea on building the Ellipse's - I'm far from an Engineer - although my 2 sons would know I've drawn the same Ellipse on Cowans software the same as above and note there's differences - I would trust Cowans software here more than the ...
Michael S. Jenkins teachings
- Thtpro replied Apr 25, 2024
The S is an ellipse - hard to find then all the time, but occasionally they show up We are forced to look at price action on a 2 dimensional screen - price action is moving in 4 dimensions, hence all the distortions and missed timing etc - price ...
Michael S. Jenkins teachings
- Thtpro replied Apr 23, 2024
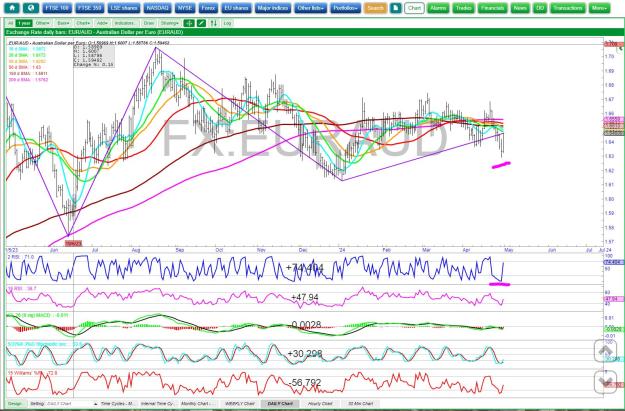
Bounce off the 70.7% retracement level (SQUARE) and off the 75% Gann Box 75% angle image
Michael S. Jenkins teachings
- Thtpro replied Apr 23, 2024
I traded it using moving averages, retracement and Indicator - completely non Gann or Jenkins - The DAILY chart turned up at the 70.7% Retracement level (related to the SQUARES ratios) + an extended Gann Box angle from the 75% level of the box ...
Gann Analysis

- Thtpro replied Apr 17, 2024
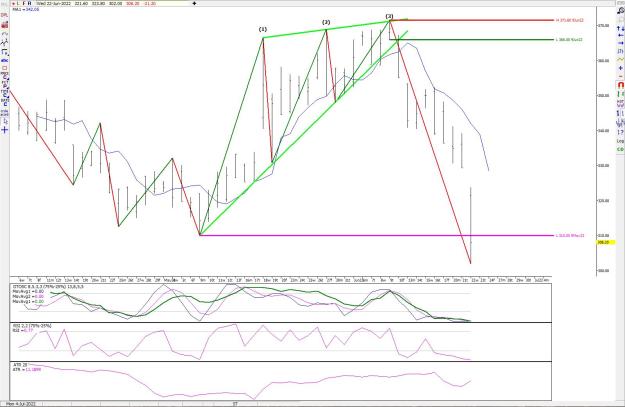
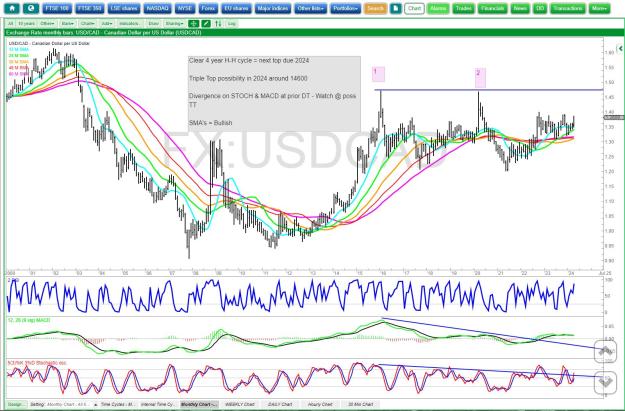
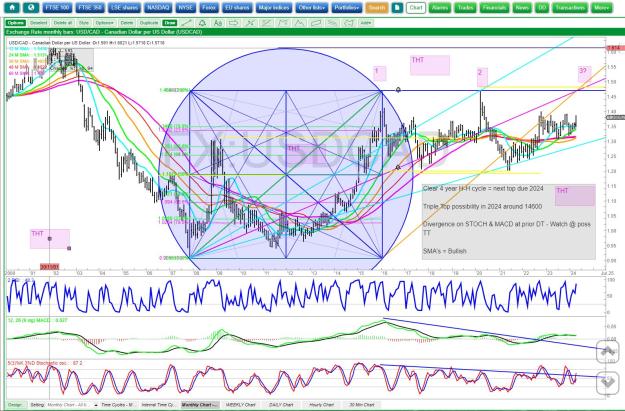
This is one way I use Jenkins and Gann - Very simple image Then apply a little Jenkins (not everything is shown on the chart) image Notice the EXTENDED Gann Box angles - 66.6% retracement levels called the top #2 AND correction from #2 = CUBE ...
Michael S. Jenkins teachings
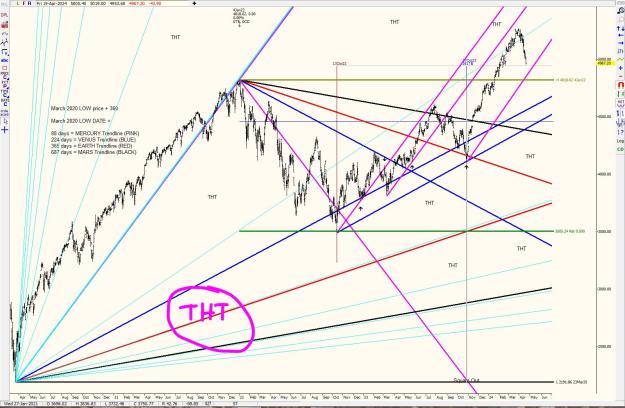
- Thtpro replied Apr 16, 2024
Hi =- Just skimmed it, these religious books all come back to geometry, planets and cycles - which you'll always get to fit the markets somehow In TTTA - just use the planets to research the "campaigns" and Eclipses and the special weapons that are ...
Michael S. Jenkins teachings

- Thtpro replied Apr 16, 2024
I found that some swings were brilliant and others were lack lustre and would have caused my style of trading a bit of a head ache lol! Also my charting software is crap with circles, as it only prints the diameter and not the radius, so I had to do ...
Michael S. Jenkins teachings
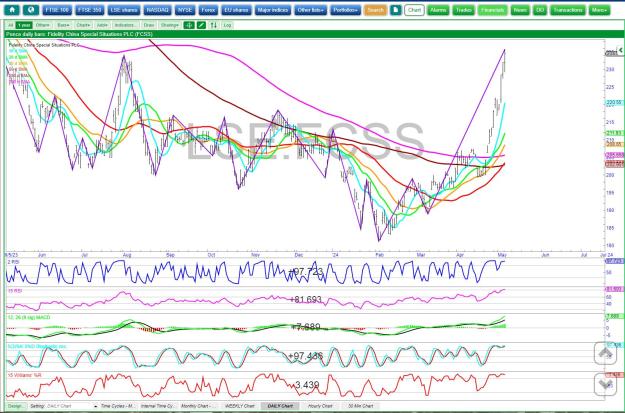
- Thtpro replied Apr 14, 2024
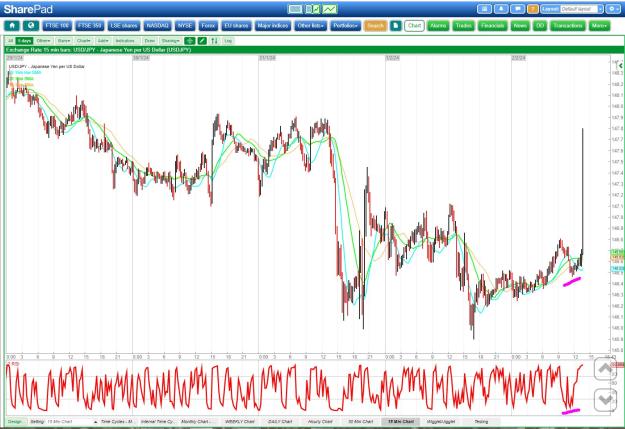
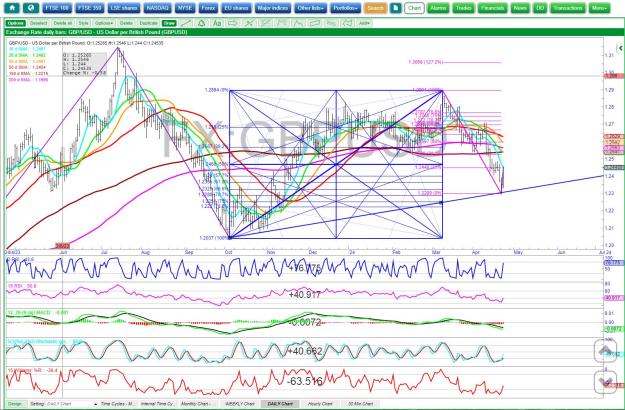
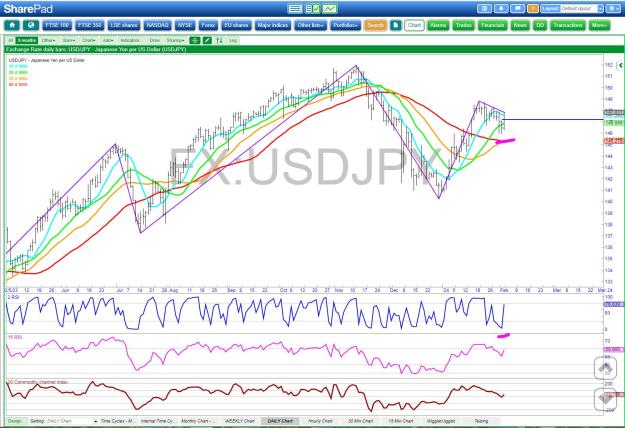
You can also use this from 2 Time-frames, BUT again you have to trade it with a bit of "art/form" reading of the chart - not trading every signal! DAILY USDJPY from the other week/month TREND in place + PULLBACK + 2RSI <25% = possible bounce of some ...
Double deep throat the real pullback

- Thtpro replied Apr 13, 2024
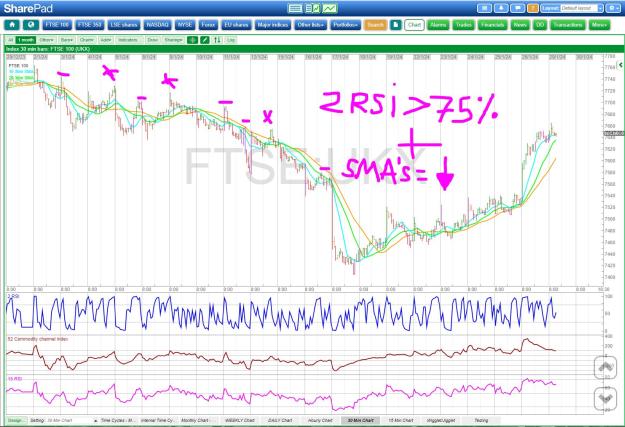
[quote=Puntacana;14830005] This depends on a few things - Higher Highs and Higher Lows including swing lows, swing highs etc - So the SMA's may NOT be in perfect order, but the swing lows etc might be confirming/suggesting the trend - this allows ...
Double deep throat the real pullback

- Thtpro replied Apr 12, 2024
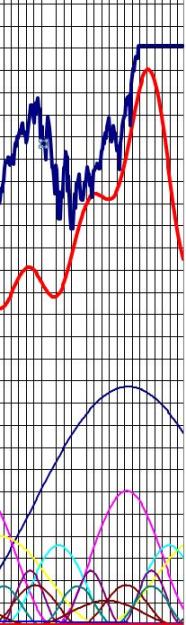
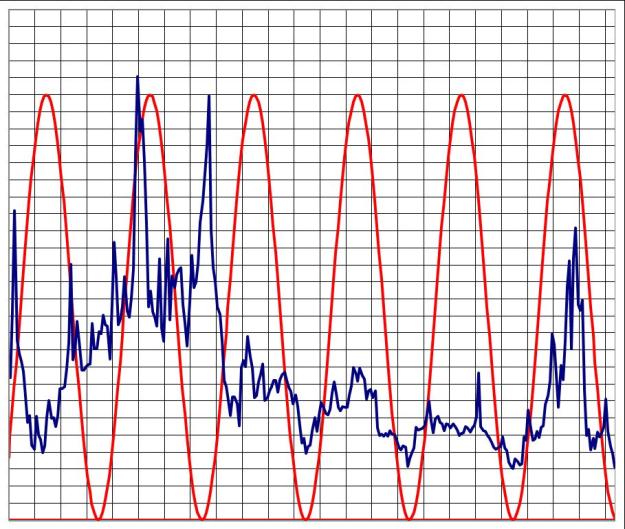
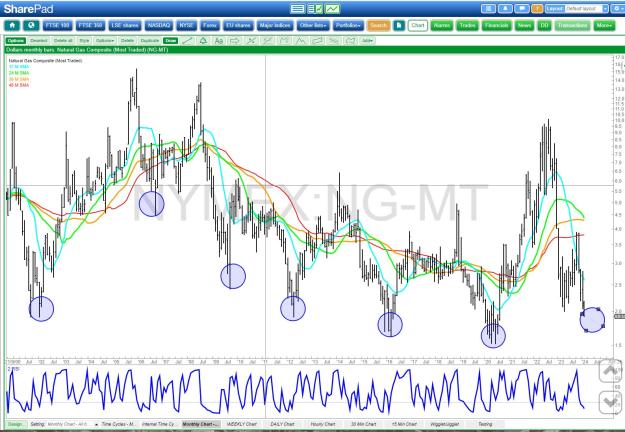
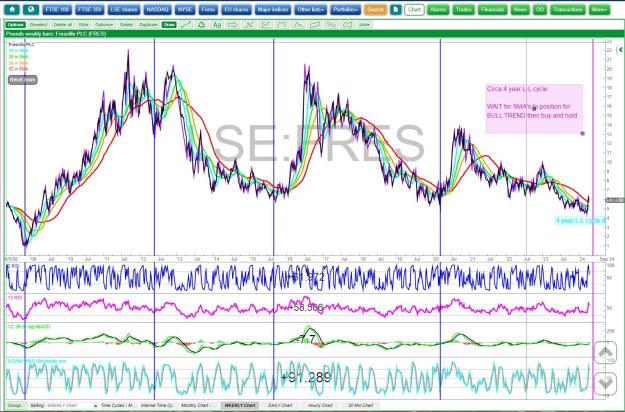
Afternoon All Couple of upcoming cycles: SP500 = HIGH End May (RED comp cycle line) - not to scale on price expectation, just direction image Natural Gas cycle low and price low now 2008 low Invested, but the cycle still happened image Chart Nat ...
Analysis and Trading based on Envelopes, Waves, Cycles