- Search Metals Mine
- 127 Results
-
 TheLaw1 replied Aug 4, 2019
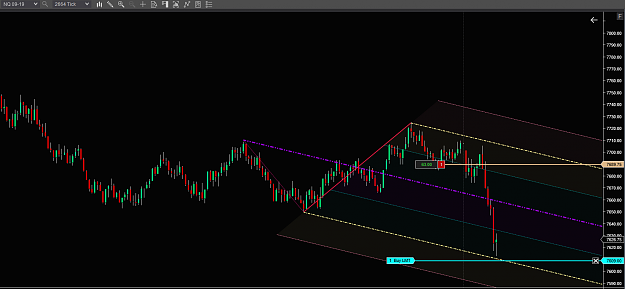
I snapped this just moments before my take profit was hit right at the Lower ML. NQ 2664 Ticks, Sunday evening. image
(binned per thread starter’s request) Abe's Median Line Thread
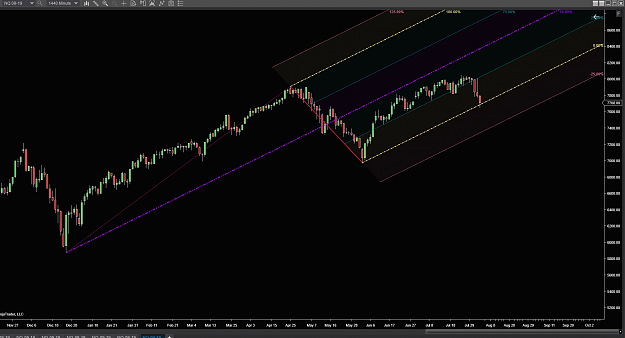
- TheLaw1 replied Aug 4, 2019
image Ah yes, very different.
(binned per thread starter’s request) Abe's Median Line Thread
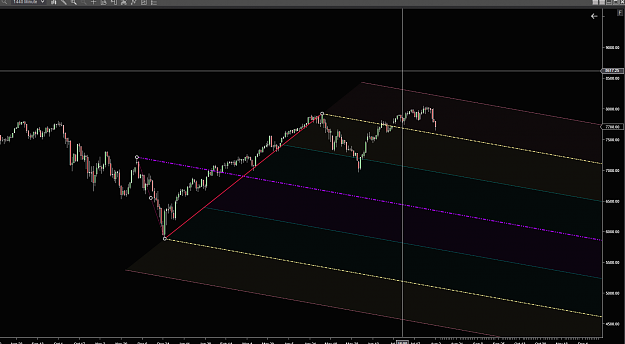
- TheLaw1 replied Aug 3, 2019
image Interesting note on the Daily Nasdaq- Never hit ML and now at critical juncture.
(binned per thread starter’s request) Abe's Median Line Thread
- TheLaw1 replied Jul 29, 2019
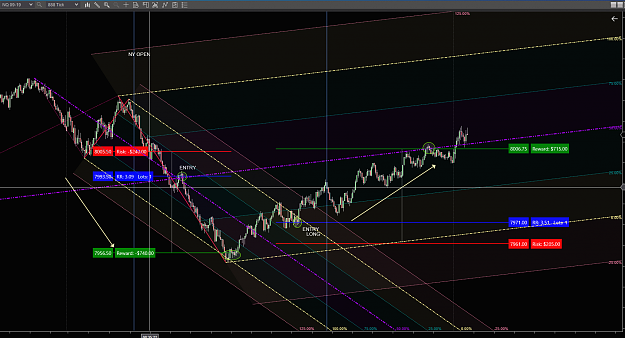
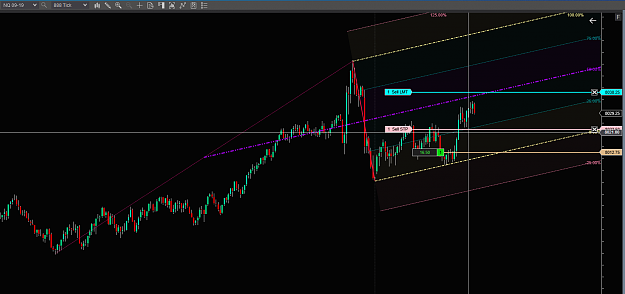
Here is that long trade on the NQ I entered this morning at 7971 and exited at ML at 8006. So here I traded the formation of the base and then the ML. Crazy! image
(binned per thread starter’s request) Abe's Median Line Thread
- TheLaw1 replied Jul 29, 2019
image This mornings trade on the NQ. 888 Tick Chart. Waited until after NY Open to get in. Took entry after price returned to median line. Took profit at lower ML. Now reentered Long at 7971. Chart to come.
(binned per thread starter’s request) Abe's Median Line Thread
- TheLaw1 replied Jul 25, 2019
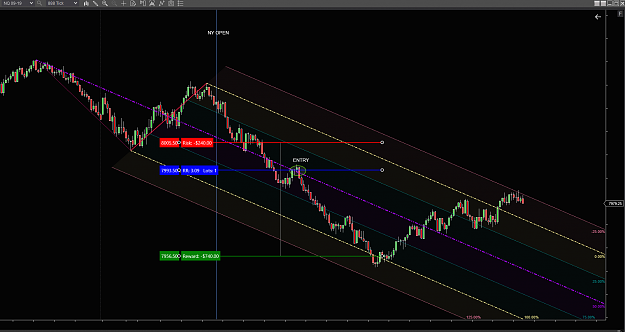
Here is a Modified Shiff on the NQ this morning 888 Tick Chart. Active Trade. I am no expert but according to Tim Morge, this is how he trades. He waits for a confirmation of C, Ideally, I would have entered on the lower line. image
(binned per thread starter’s request) Abe's Median Line Thread
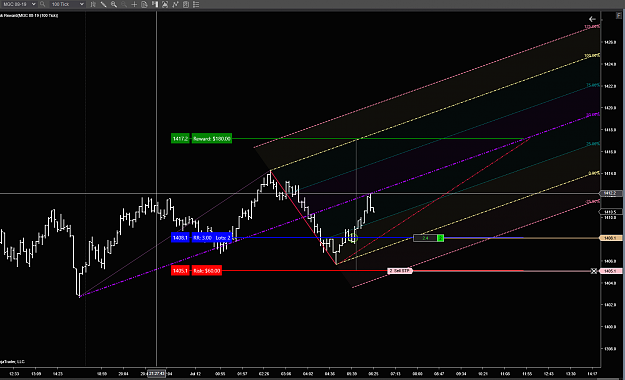
- TheLaw1 replied Jul 17, 2019
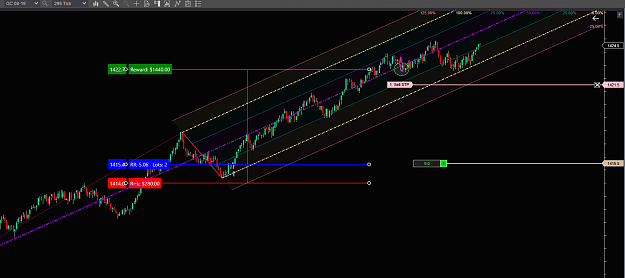
image This mornings Gold trade.Missed the first jump up but caught this one, Took half off at 5:1 and now waiting to see if we break 1425.
(binned per thread starter’s request) Abe's Median Line Thread
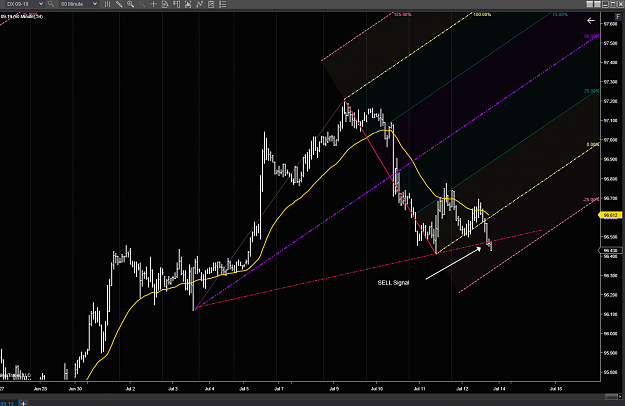
- TheLaw1 replied Jul 12, 2019
DX closed on a Sell signal on 60 Min chart. It moved below Trigger Lines. Have a great weekend y'all! image
(binned per thread starter’s request) Abe's Median Line Thread
- TheLaw1 replied Jul 12, 2019
image Update on earlier post on Micro Gold. I use the 34 EMA to confirm direction is correct. I got in too early on earlier trade where I labeled Original Pivot. I luckily made a few tics on that one but re-entered later and hit 3:1 target.
(binned per thread starter’s request) Abe's Median Line Thread
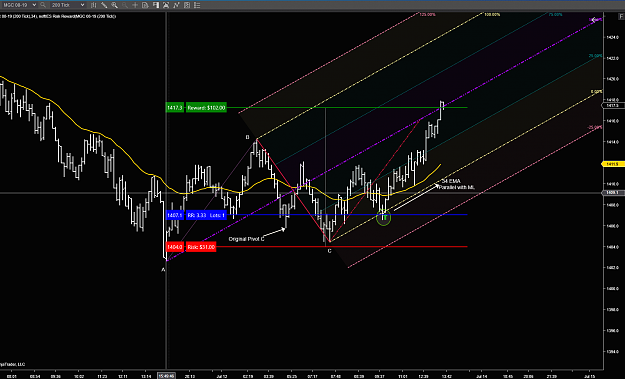
- TheLaw1 replied Jul 12, 2019
Here is a live trade of MicroGC from this morning. I use tick charts. Note that in this case, the R:R aligned perfectly at 3:1 with anchor. image
(binned per thread starter’s request) Abe's Median Line Thread
- TheLaw1 replied Jan 30, 2019
Having a play with Fractals. Also called the Wiseman indicators on Ninja Trader.
EURUSD only
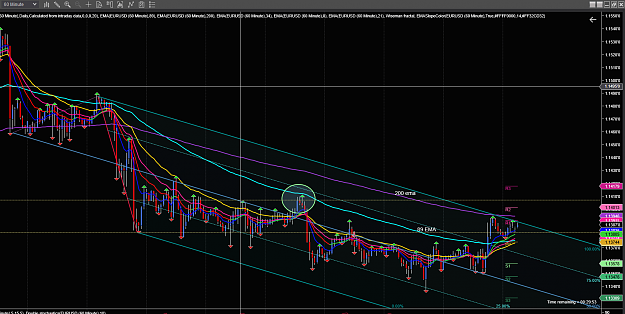
- TheLaw1 replied Jan 23, 2019
Just noting were are still in the Pitchfork Channel although it smacked against the top twice, We have broken above the 89 ema but still below the 200ema....... image
EURUSD only
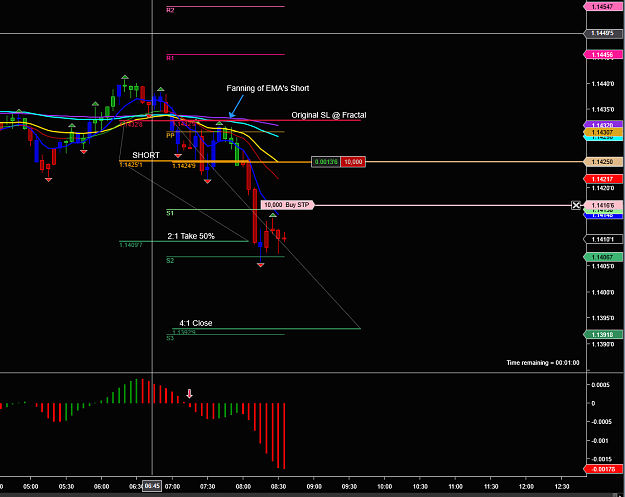
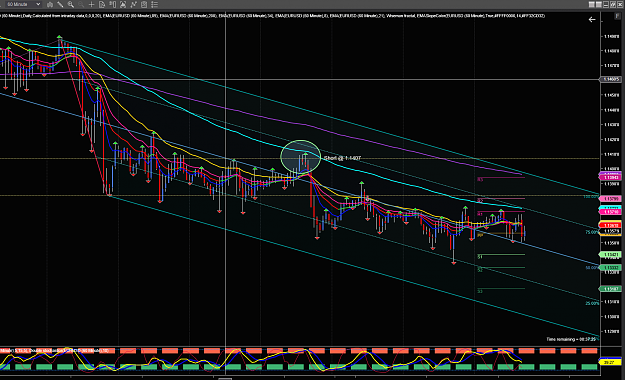
- TheLaw1 replied Jan 23, 2019
Slow moving means stay in longer. Still short from 1.1407 as trend is clearly down. Note short taken from bottom 25% of original Pitchfork. Triangles are the Bill Williams Fractals. Ideally only add to trade when crosses Red triangles. SL above Blue ...
EURUSD only
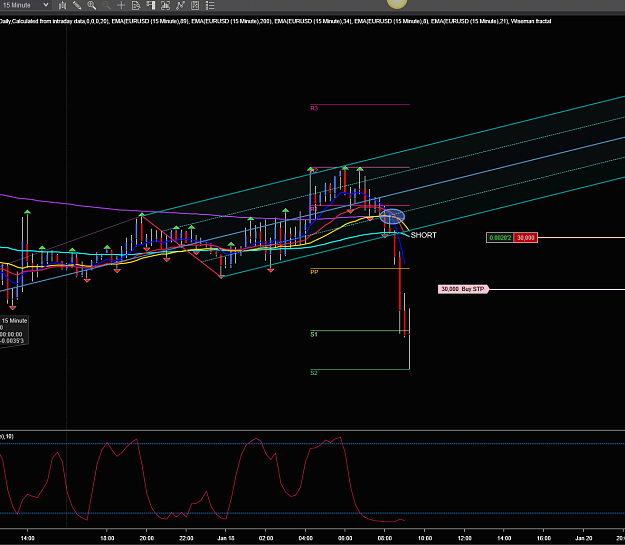
- TheLaw1 replied Jan 18, 2019
FYI - Notice how accurate the Fib Pivots are. They come with Ninja Trader. Also, I took this trade when price broke Pitchfork. Also started using Fractals (The Triangles) to draw Pitchforks. Good trend indicator. Still short.....until the 50's image
EURUSD only
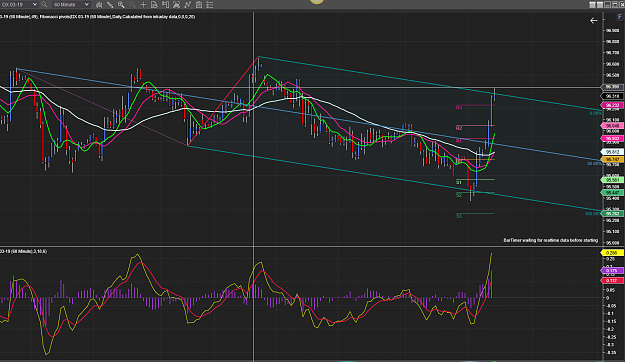
- TheLaw1 replied Jan 2, 2019
Good morning Brothers and Sisters. Just getting my bearings today and noticed the DX traversed the channel so for all those long EURUSD, the probability of the DX uptrend ending today is good.Then again I am not long the EURUSD. Too early to tell ...
EURUSD only
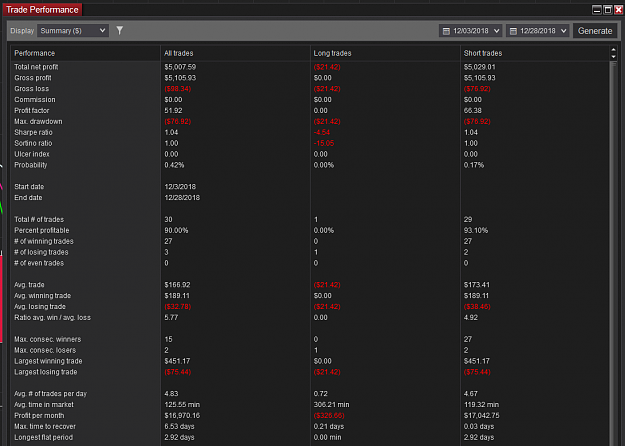
- TheLaw1 replied Dec 28, 2018
Met my goal for December. Happy New Year Y'all. 90% win rate
EURUSD only
- TheLaw1 replied Dec 27, 2018
60 Min looking Bullish to me. Pitchfork from low on Dec 14 image
EURUSD only
- TheLaw1 replied Dec 20, 2018
Looks like Deja Vu all over again.
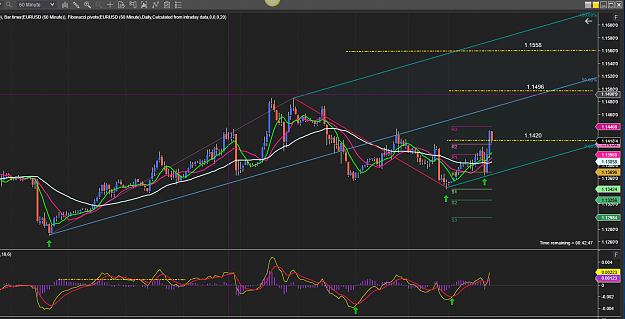
EURUSD only Long from 1.1443 SL 10pips image
- TheLaw1 replied Dec 18, 2018
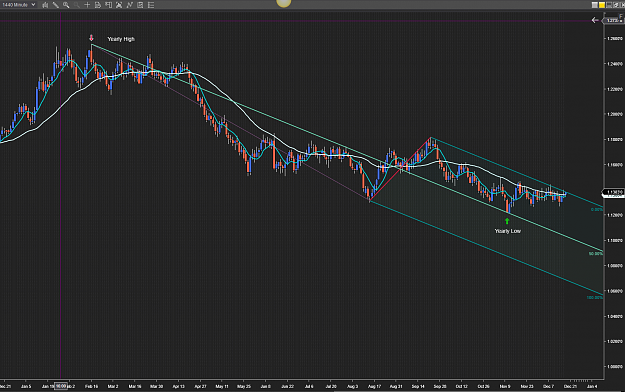
Well since we are posting long term charts, here is a Daily with an Andrews Pitchfork from the Yearly High through the Yearly Low. Note we can break through tomorrow if it goes up. image
EURUSD only
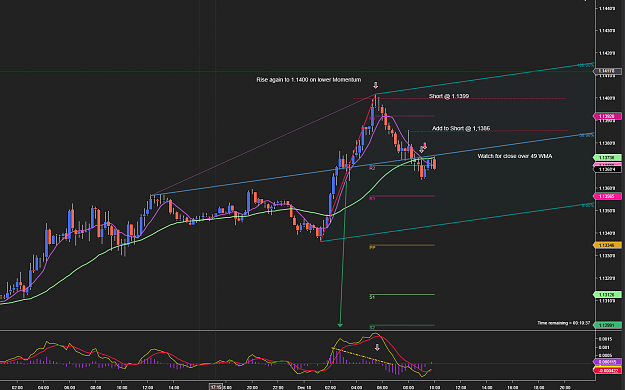
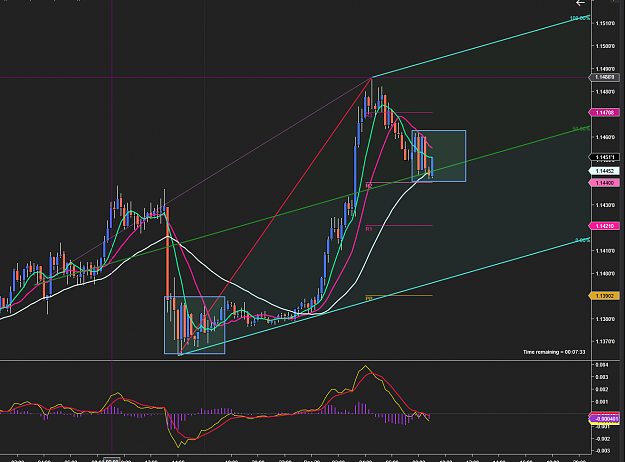
- TheLaw1 replied Dec 18, 2018
Here is an anatomy of a trade. When EURUSD was rising towards 1.1400 again I checked to see if divergence was forming on 15m charts. I interpret this as losing momentum on way up, So shorted as it came to 1.1400. I look at certain prices like stop ...
EURUSD only