- Search Metals Mine
- 17 Results
-
 Superchor replied Aug 4, 2014
Although I just demo trade silver. But the area in green below seems like a nice area for price to come back and because it's not a clean drop it might just come to 50% fib and shoot up to origin or drop. DAILY CHART . image My 2 cents !!!
+300,000% by 2020 / Follow My Journey

- Superchor replied Jul 30, 2014
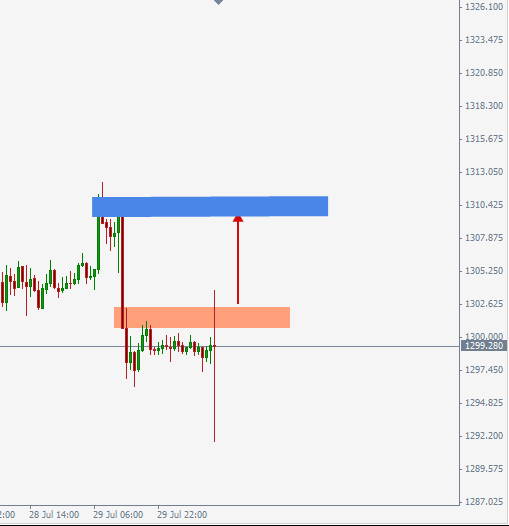
H1 Chart. IMO Gold pretty soon possibility. image P.S I don't trade gold yet. I burn my demo on it. So take my opinions easy ;p. Cheers !!!
Only Gold!
- Superchor replied Jul 28, 2014
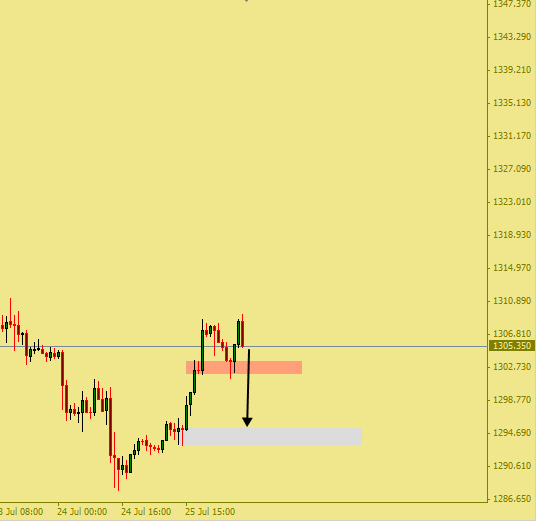
My take on the engulf of the flag limit. I am not short because I am still sort of forward learning price action and not trading gold live. image
Only Gold!
- Superchor replied Jul 22, 2014
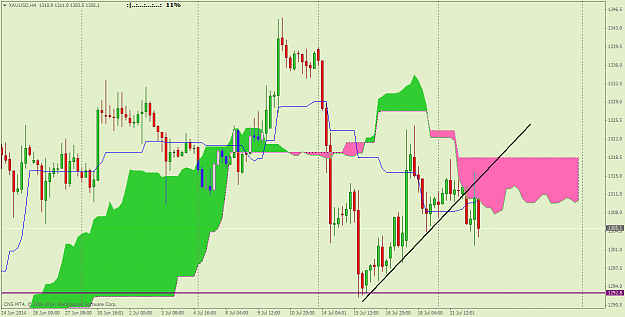
4hr seems like a break and retest of a trendline. Let's see the close of 4hr candle. My 2 cents as I dont trade gold yet. image
Only Gold!
- Superchor replied Jul 11, 2014
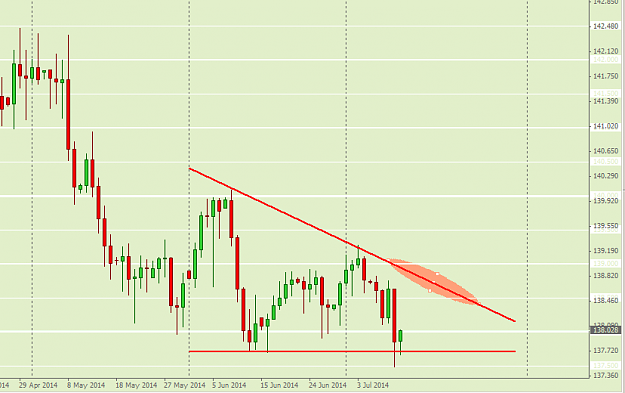
Because the daily bottom looks like a fakeout. I would rather short the eurjpy anyway near the above trendline. Although EUR is bearish at this moment but is was a strong sell off. But then I am a very conservative trader. image
EUR/JPY
- Superchor replied Jul 10, 2014
Eurjpy also completes a perfect ABCD pattern. I guess it might take some rest by climbing above. atleast 50% of the fall. image Which would be a retest of the nearest broken low too. image
EUR/JPY


- Superchor replied May 19, 2014
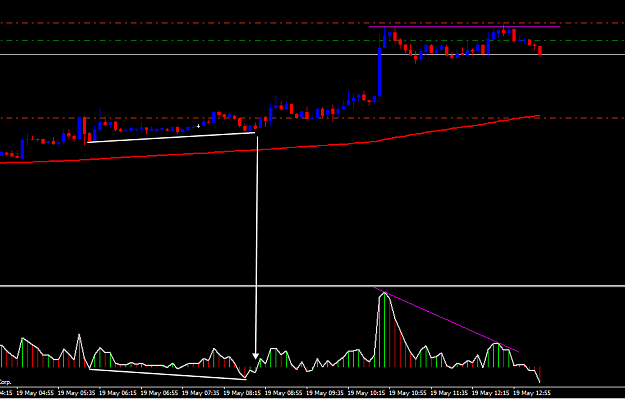
Jeet just to add something the trading system in itself is pretty well. I guess if you will filter the entries like the exmaple given below it could make a little bit of difference if not much. I usually put a 100EMA on 1 Hr chart and if price is ...
5 Min Gold (XAUUSD) Divergence Strategy
- Superchor replied May 19, 2014
Hi TraderROlf, I have been reading your posts very closely. As I am still a newbie and trying to learn things the simple way. Not having a lot of excperience trading naked charts I am finding it difficult to completly dump indicators. So I have ...
Trading around the world
- Superchor replied May 15, 2014
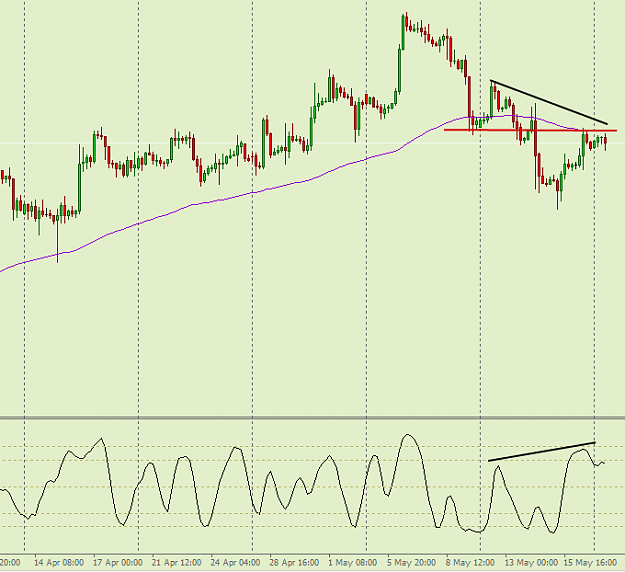
I guess price might come back to the green region to get that hidden divergence into play. Fib 50%-61.8% might produce some rubber band effect. image
Only Gold!
- Superchor replied May 13, 2014
Last H1 candle close was a possible fakey ! Init. .. image
Only Gold!
- Superchor replied May 5, 2014
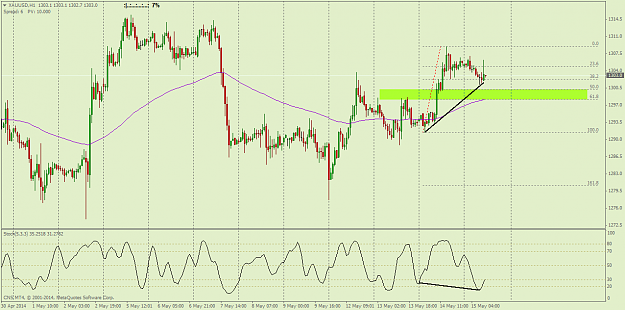
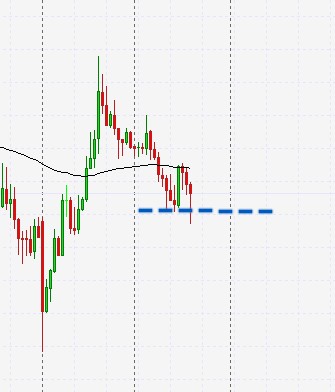
I was wondering what are your views about the 1hr hidden divergence in Gold. As I am starting to learn about divergence. Moreover 1306 region could be till 1302 seems like a good support for now. image
Only Gold!
- Superchor replied May 5, 2014
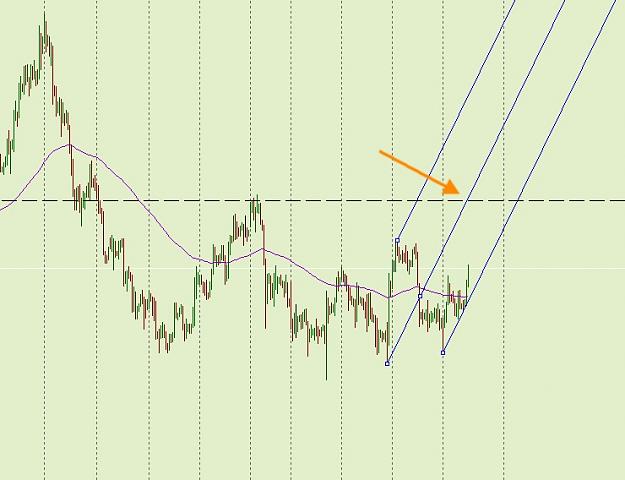
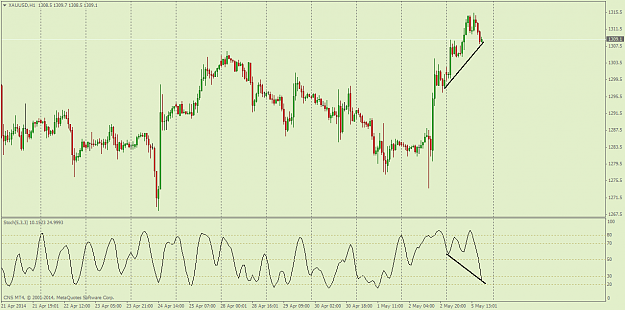
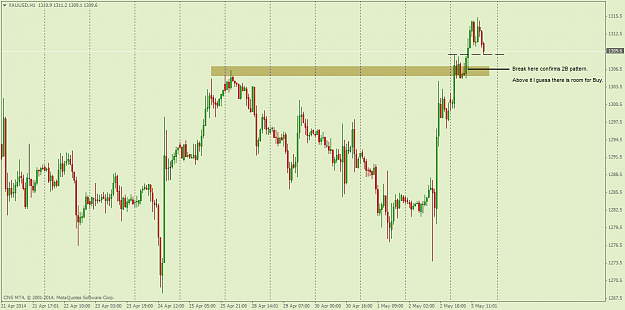
2B confirmation could be a sign of change in up movement. Because rising wedge down break on H1 is already working with a target of 1306. If it breaks and closes below 1306. That would also confirm 2B pattern. So possibly that could make the price ...
Only Gold!
- Superchor replied May 5, 2014
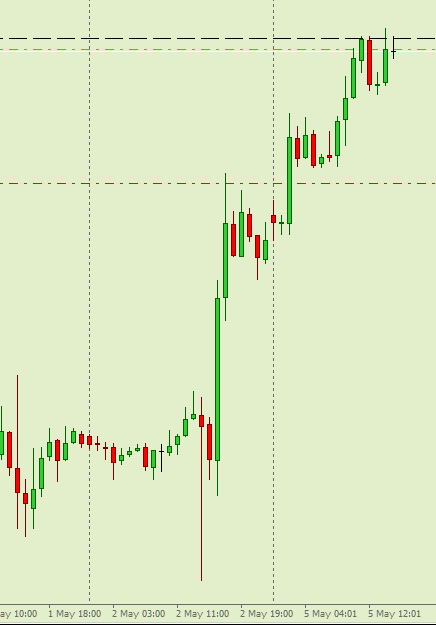
fake breakout here on 1 hr chart. I places my precious demo money short here. Probably looks upside momentum taking a rest for now. image But bottom trendline still holding. image
Only Gold!
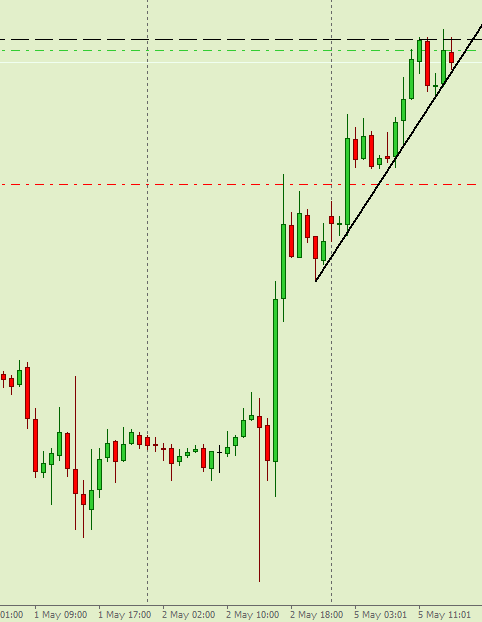
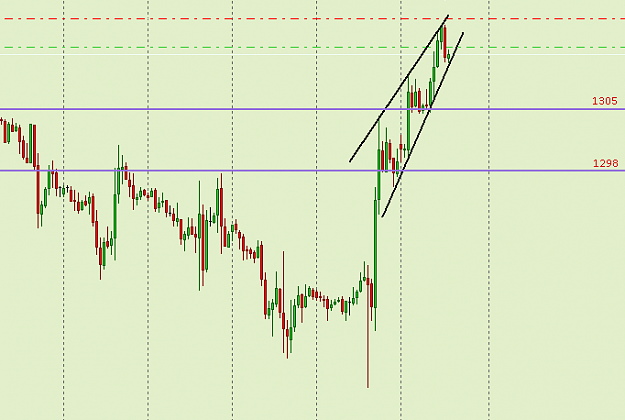
- Superchor replied May 5, 2014
Perfect 1 hr rising wedge. I think if price breaks below trendline it might just target the 1305 - 1298 area. image
Only Gold!
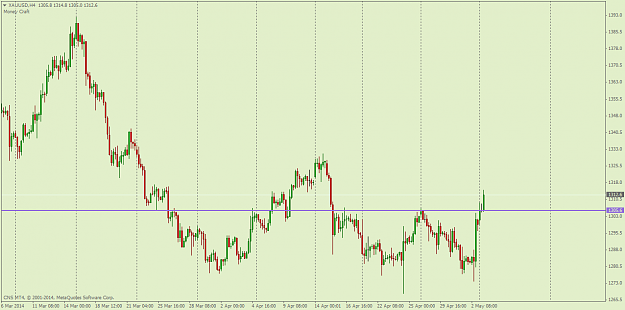
- Superchor replied May 5, 2014
If next H4 Candle turns back and closes below that line. I might short some too. Till then I am keeping my demo money safe.
Only Gold! image
image
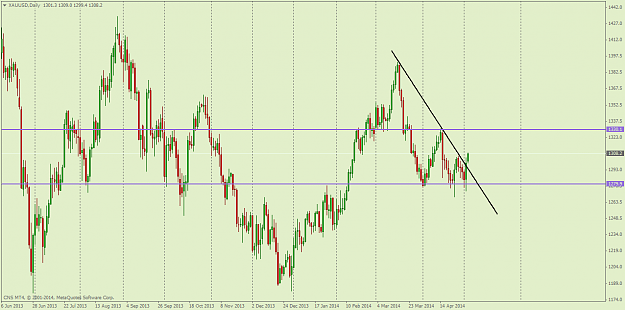
- Superchor replied May 4, 2014
My 2 cents : Gold Daily has confirmed a trend line break and triple bottom. I guess it's good to go till 1330. image
Only Gold!
- Posts by Member Search: 'Superchor'