- Search Metals Mine
- 146 Results
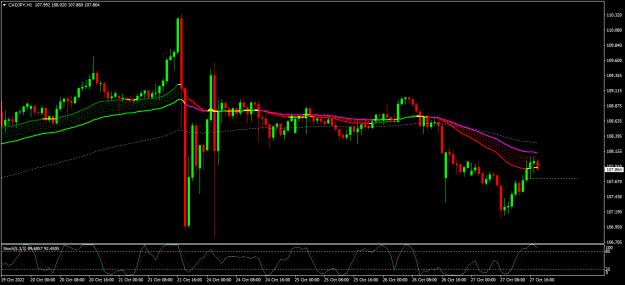
- Spudfan replied Oct 31, 2022
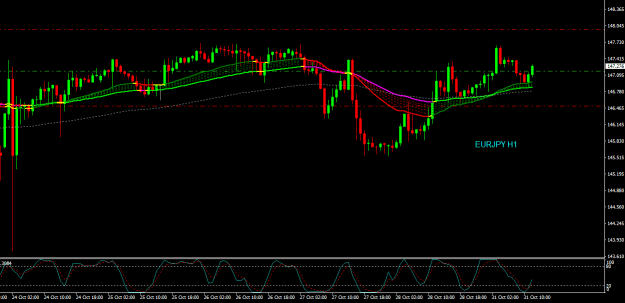
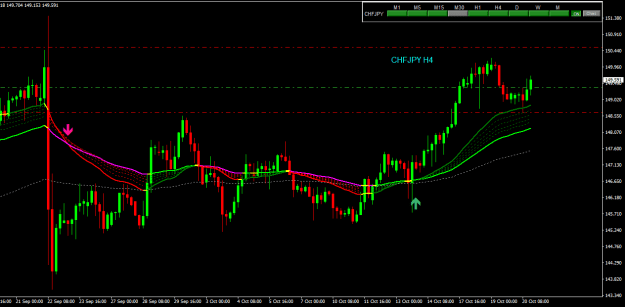
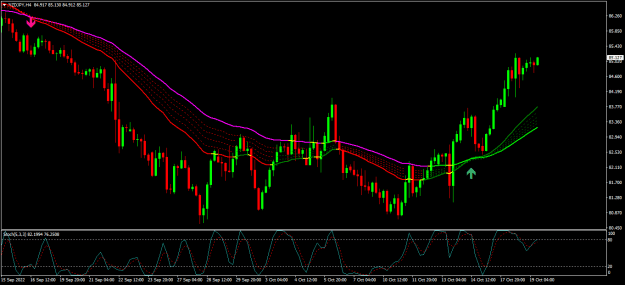
Both this trade and the previous one (AUDJPY) have retraced all the profit gained during the day. Both are close to B/E, both are now sitting on the EMAs. Of course I don't like this at all! But the price structure and GMMAs still look good. Only ...
Guppy's Multi-Moving Average (GMMA)
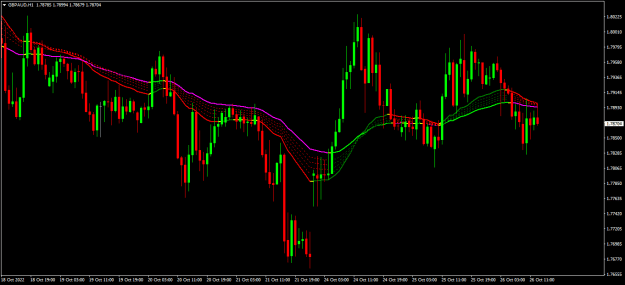
- Spudfan replied Oct 31, 2022
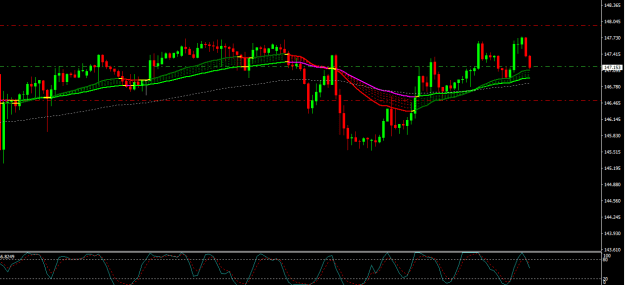
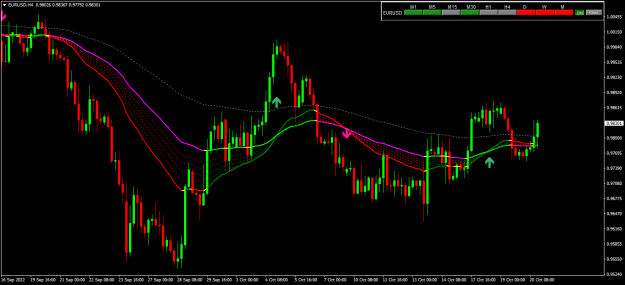
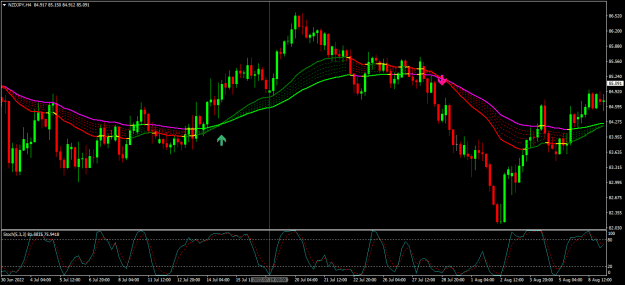
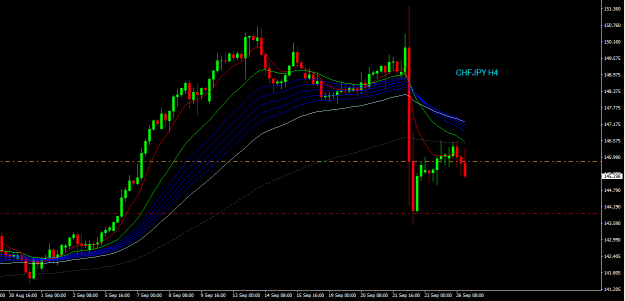
Another one, also a JPY pair. This pullback to the EMAs looks better than the previous example, looking stronger all round, I think. The 120 EMA in position below the GMMAs reinforces the decent uptrend. image
Guppy's Multi-Moving Average (GMMA)
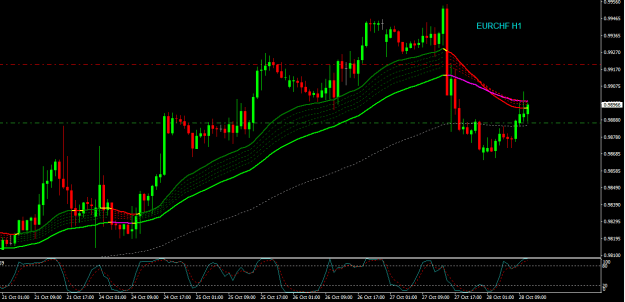
- Spudfan replied Oct 31, 2022
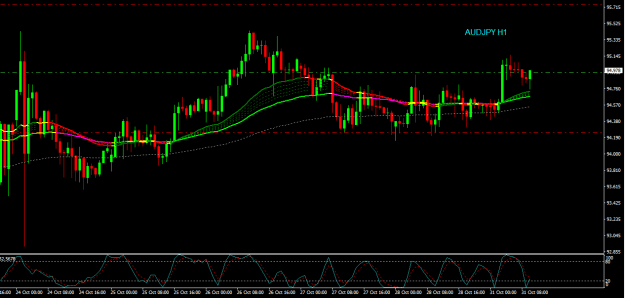
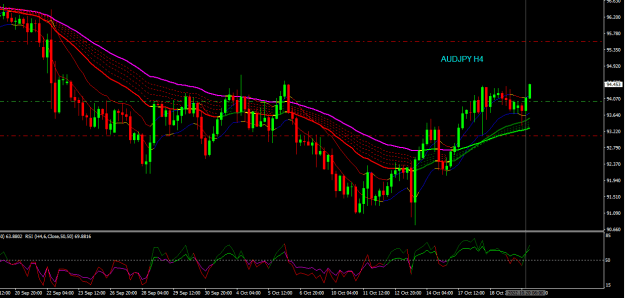
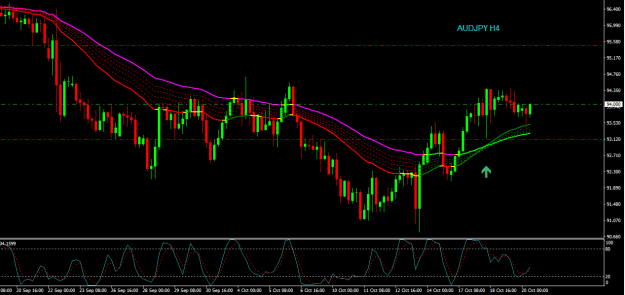
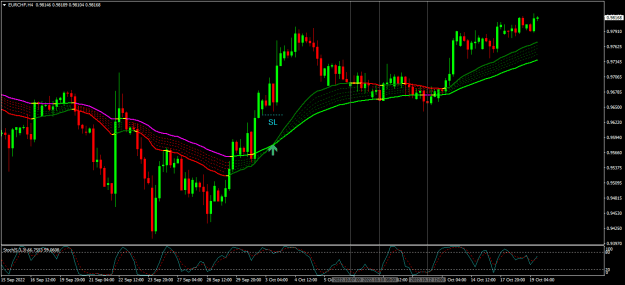
First trade of the week. Coming out of a strong consolidation shown by horizontal and close EMAs, then a breakout with the dominant trend, quick pullback, stochs oversold. The stop loss is well below the recent swing low. Entry using a buy stop ...
Guppy's Multi-Moving Average (GMMA)
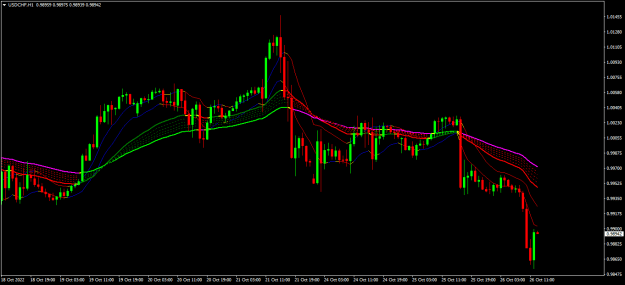
- Spudfan replied Oct 28, 2022
We have a new downtrend, a pullback and the stochastics show a strong overbought condition. But otherwise it's beginning to look as if price is going to turn up. I have moved my sell stop order up to follow price, but am not going further. Price ...
Guppy's Multi-Moving Average (GMMA)
- Spudfan replied Oct 27, 2022
I use stop orders for my entries to avoid getting into a trade where the pullback keeps pulling back and stops me out. Or sometimes I'll get into a trade but price gives one last spike the wrong way, stops me out and then goes the "correct" way. So ...
Guppy's Multi-Moving Average (GMMA)
- Spudfan replied Oct 26, 2022
This is all about trading reversions to the mean (or pullbacks to the long-term EMAs). This idea might sound too simple, or just plain obvious, but it is quick AND it helps avoid any distraction by whatever indicators we are using. It's a simple ...
Guppy's Multi-Moving Average (GMMA)
- Spudfan replied Oct 20, 2022
Here's a gift - a very useful indicator. It gives a snapshot of trend behaviour across whichever timeframe you ask it to show. It also provides a dashboard so you can look at any pairs you ask for all displayed in one window on any chart. Don't load ...
Guppy's Multi-Moving Average (GMMA)
- Spudfan replied Oct 20, 2022
Well this is interesting. Here's the above trade with a Walvekar method template on the chart. It follows the rules almost perfectly. image
Guppy's Multi-Moving Average (GMMA)
- Spudfan replied Oct 20, 2022
I placed this trade this morning, buy stop order at the tip of the pinbar. The tail of the PB pulled right back into the long-term EMAs, so even though the stochastics didn't go fully into oversold territory I placed the order anyway. If price had ...
Guppy's Multi-Moving Average (GMMA)
- Spudfan replied Oct 19, 2022
And to show that life's not perfect ... Here is a more messy one - three attempts before price takes off. But, if we had placed our stop loss as shown, in fact we would have survived the extended pullback. image
Guppy's Multi-Moving Average (GMMA)
- Spudfan replied Oct 19, 2022
Here's another adaptation of the GMMAs to think about. I have used an EMA crossover indicator to paint arrows on the chart just to make it quicker or easier to see the long-term EMA crossover point. The Stochastics are set to 5,3,3. You need to be ...
Guppy's Multi-Moving Average (GMMA)
- Spudfan replied Sep 28, 2022
And just like that, the pressure is on. Now it's all about trusting the system and having mental strength. I have a friend who has been doing well on a demo account - for at least 6 months. I told him until he goes live, he will never know what ...
Guppy's Multi-Moving Average (GMMA)
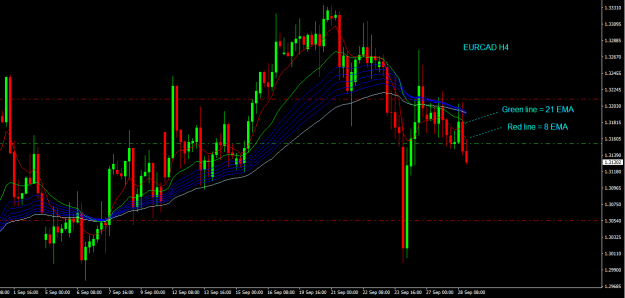
- Spudfan replied Sep 28, 2022
Same again. The two EMAs I mentioned in my 15 June post are the 21 and 8 EMAs, that I have used for several years and feel comfortable with. There's nothing magic about those two numbers, just familiarity. Sell stop order was placed at the base of ...
Guppy's Multi-Moving Average (GMMA)
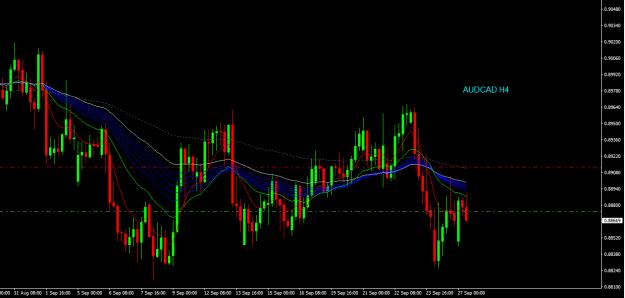
- Spudfan replied Sep 27, 2022
Same again. I entered using a stop order on the latest closed candle, which allowed an entry close to the EMAs - reduces the distance a pullback might go and offers a better R/R than an entry further from the EMAs. The current candle did pull back a ...
Guppy's Multi-Moving Average (GMMA)
- Spudfan replied Sep 26, 2022
Some of you might remember this post from 15 June. I've been following this approach again and it has proved profitable for me. It just feels right. Here's one of the trades I placed today. It's still running, is now at break-even so I'm going to ...
Guppy's Multi-Moving Average (GMMA)
- Spudfan replied Sep 6, 2022
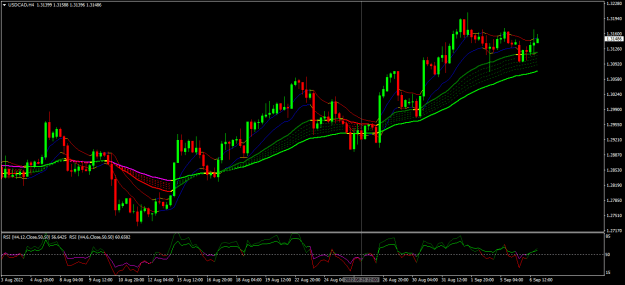
No reason not to, as far as I can see. However, I have started trading only in the direction of the timeframe one higher, and in this example H4 is bullish. I marked your H1 candle on 25 Aug with a vertical line and this is what it looks like on H4. ...
Guppy's Multi-Moving Average (GMMA)
- Spudfan replied Aug 31, 2022
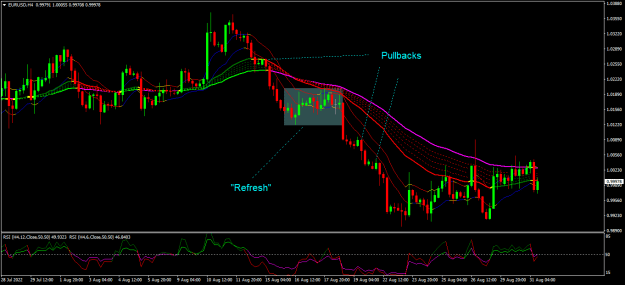
Your questions sparked an unrelated thought that might help. We get two main types of pullbacks - little ones and big ones (such wisdom and insight
Guppy's Multi-Moving Average (GMMA) ). Some call the big pullbacks refreshes, and it is these that are what Rajesh advocates using ...
- Spudfan replied Aug 26, 2022
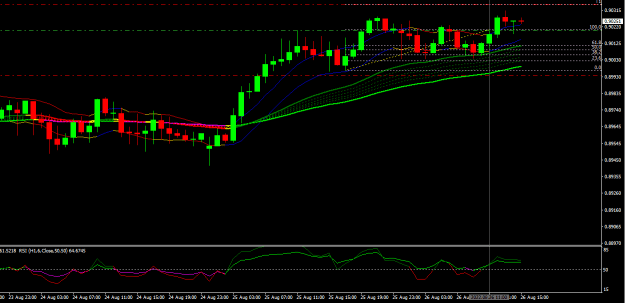
Here's a trade I took earlier today. Like Bee-Hop, I believe this meets all the rules, although as this is Friday with a big USD news item coming up shortly (Core PCE Price Index), rules or not, it might not have been advisable. image
Guppy's Multi-Moving Average (GMMA)
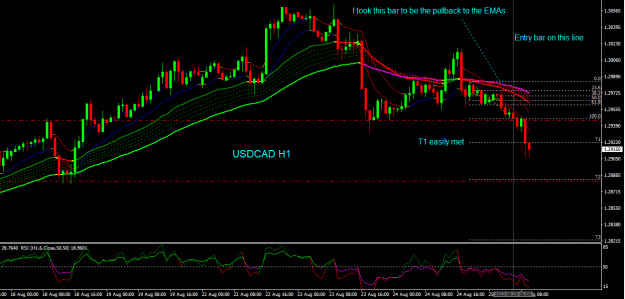
- Spudfan replied Aug 25, 2022
Am I doing this right? I would have entered a bit earlier but I was still asleep! image
Guppy's Multi-Moving Average (GMMA)