- Search Metals Mine
- 81 Results
-
 Sanji replied Mar 2, 2022
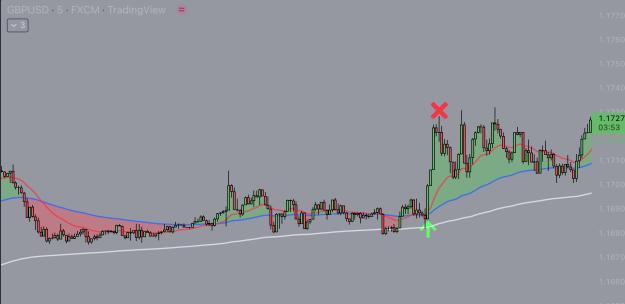
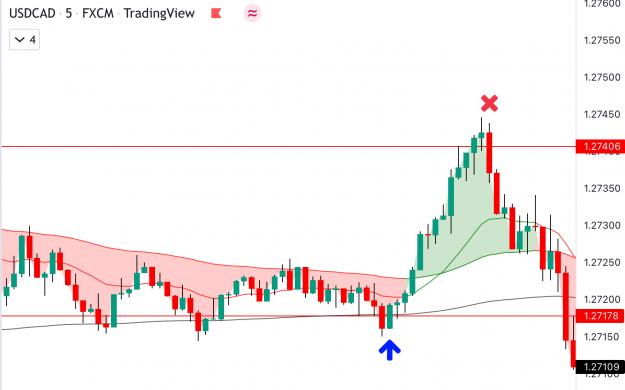
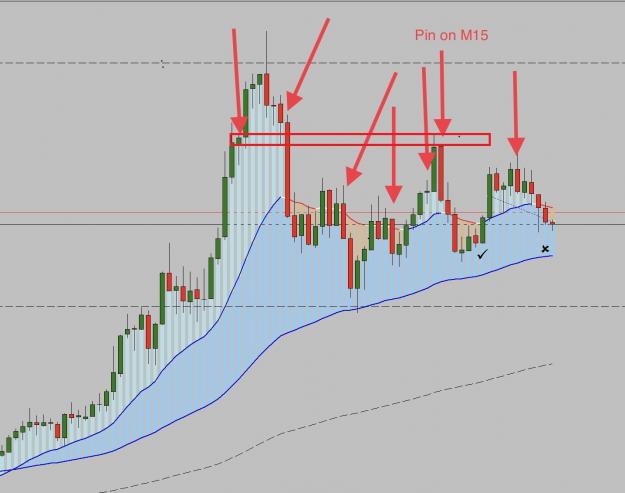
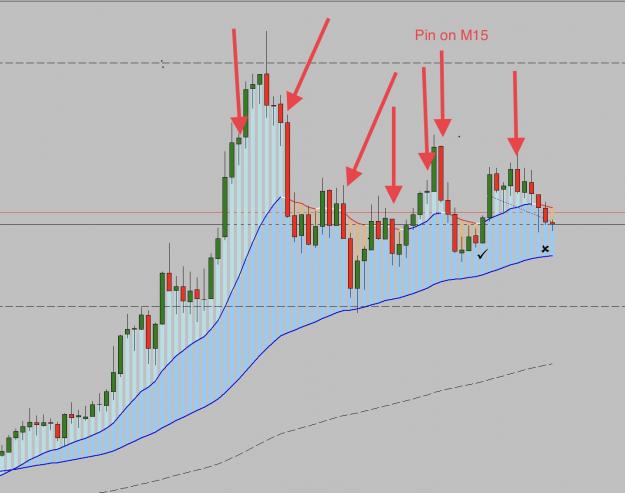
Hi Strat, this is Basic PASR. But I don't like going against the trend, look at the upper wicks of the following candles. Maybe my trend trading mentality doesn't allow me to do this.
Strat's PASR Long Term, Stress Free Trading
- Sanji replied Mar 2, 2022
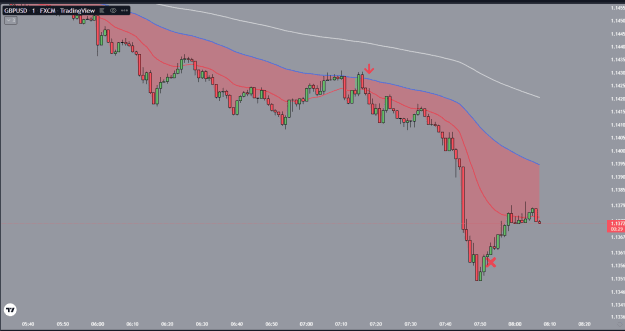
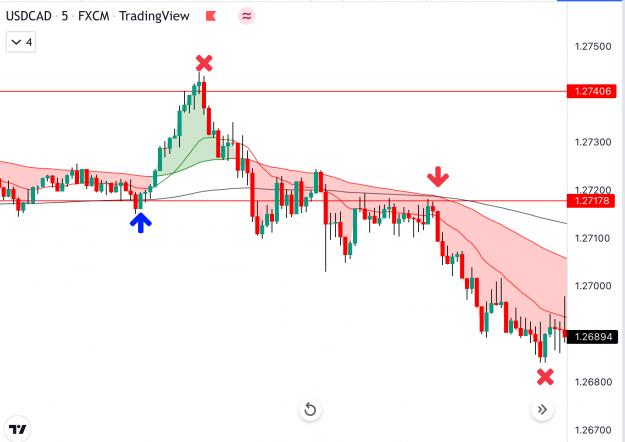
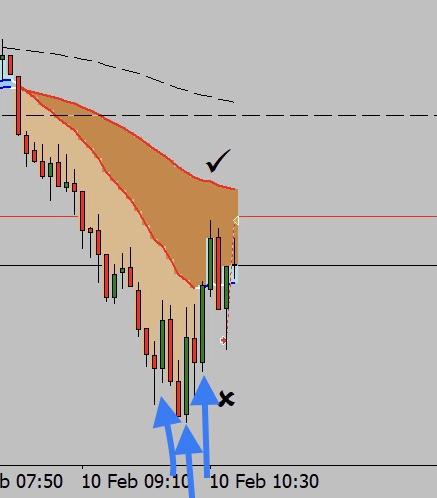
The red down arrow is not a trade of mine. But look at it, a nice entry to short where I long before. This is power of Strat Shadow.
Strat's PASR Long Term, Stress Free Trading
- Sanji replied Mar 2, 2022
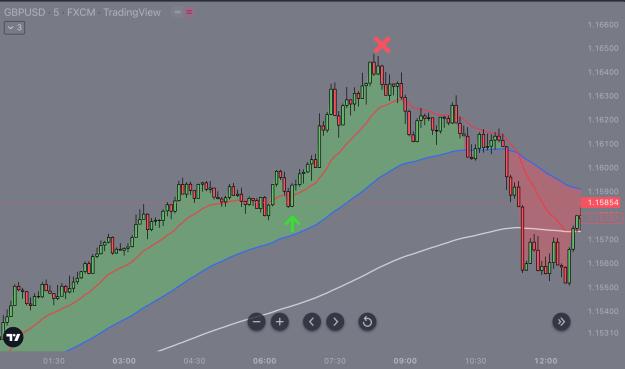
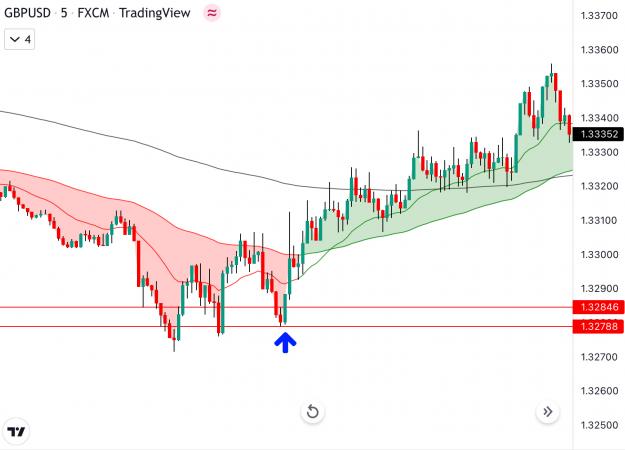
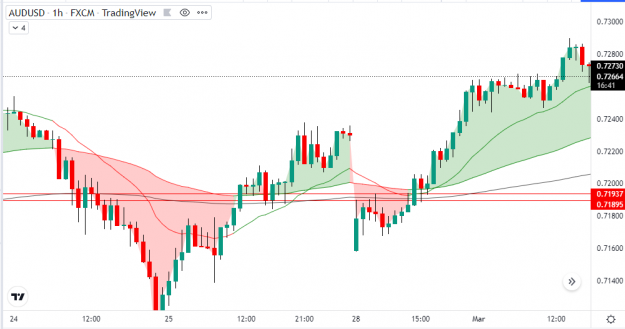
Trade price action from support to resistance. EMA200 is power and Never forget it in this strategy. I don’t have my computer to show this trade now. But tradingview chart is useful.
Strat's PASR Long Term, Stress Free Trading
- Sanji replied Mar 1, 2022
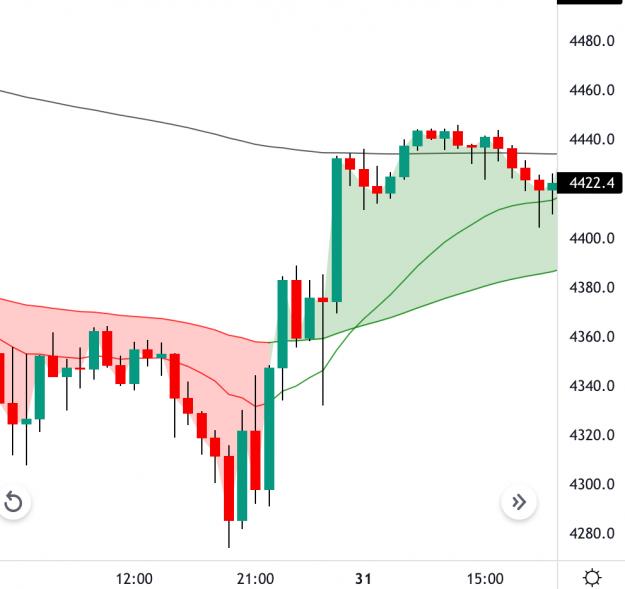
Hi Strat, Price Action at Support
Strat's PASR Long Term, Stress Free Trading

- Sanji replied Feb 24, 2022
Look at this guy url , he's a scammer. Look how he showed his profits. But in reality, he fooled everyone.
Trading with the zones

- Sanji replied Feb 24, 2022
I think it is a demo account. Be careful! You may be scammed. Look at this guy url , he's a scammer. Look how he showed his profits. But in reality, he fooled everyone.
Trading with the zones

- Sanji replied Feb 17, 2022
Sorry I didn't draw this zone. It marks where the price hesitates. When the price returned to this zone, did you see what the price did with it. Let's go back and look at it on M1, you will see everything more clearly
Strat's PASR Long Term, Stress Free Trading
- Sanji replied Feb 16, 2022
Hi Strat, As you suggested, I will post my trade here, but it won't be of any value to the viewers if they don't come back and analyze it multiple time frames.
Strat's PASR Long Term, Stress Free Trading
- Sanji replied Feb 15, 2022
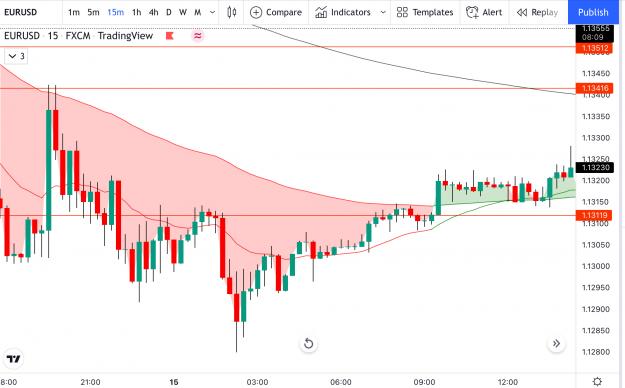
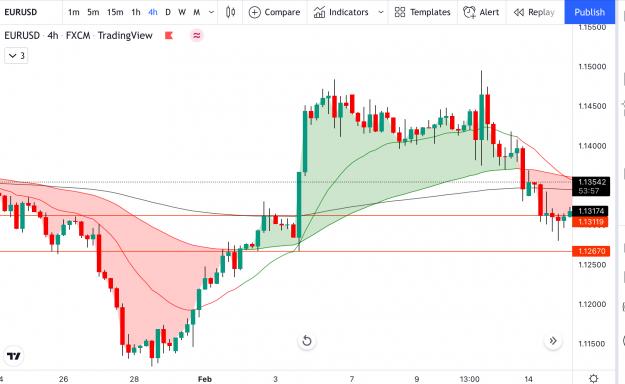
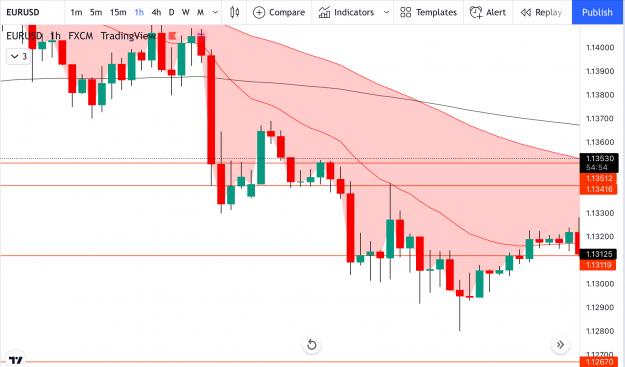
image H4: price now is at support. image H1: price has bounced from support but the move is rather weak, look for it on the lower timeframes. I have resistance on H1. image M15: price has pushed above Shadow, I will look for a buy entry at ...
Strat's PASR Long Term, Stress Free Trading
- Sanji replied Feb 6, 2022
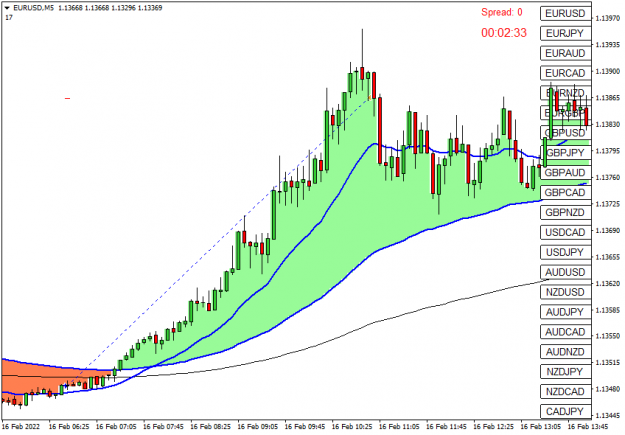
I mention 200 EMA above M5 bullish. This is H1 chart at the time you sold on M5. I hope it looks like H1 chart on your broker. Looking at this H1 chart, the recent candles are not showing any bearish sign, especially Jan 29 has a strong rally from ...
Strat's PASR Long Term, Stress Free Trading
- Sanji replied Nov 26, 2021
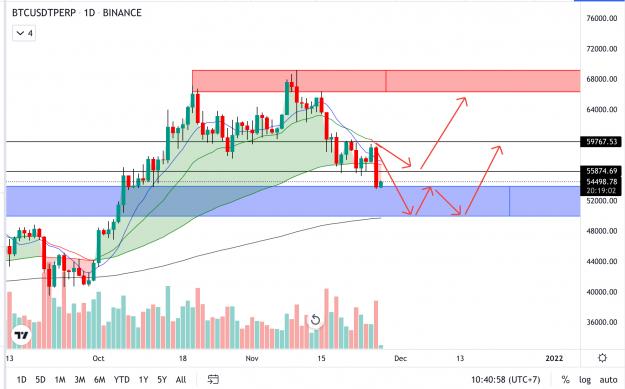
BTC future, price now at support. Giá đang ở tại hỗ trợ.
(binned per thread starter's request) Price action trading
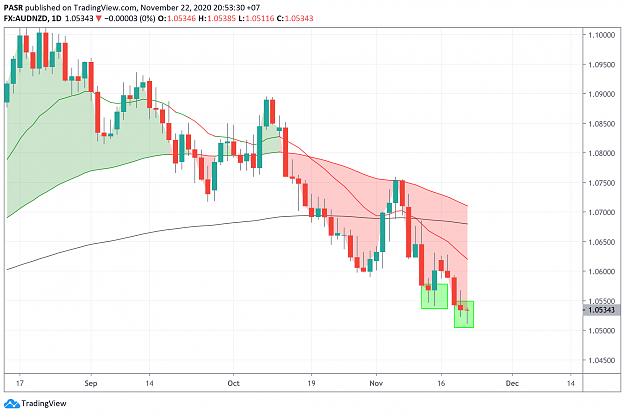
- Sanji replied Nov 22, 2020
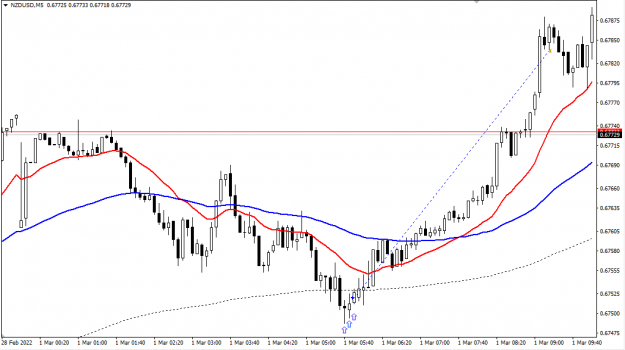
The chart of FXCM is different from your chart. Beware of small body candles and doji.
Strat's PASR Long Term, Stress Free Trading
- Sanji replied Nov 14, 2020
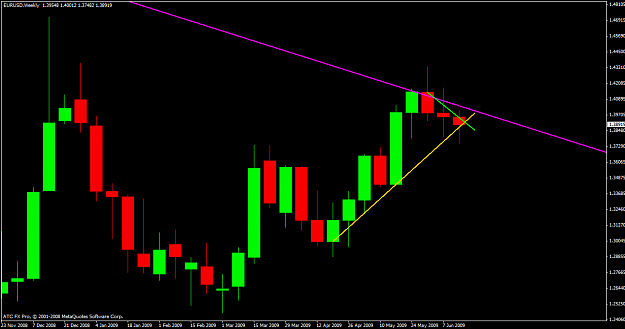
This chart extracted from Strat's post. Lime line is immediate trend.
Strat's PASR Long Term, Stress Free Trading