- Search Metals Mine
- 22 Results
-
 Samsamall replied Dec 2, 2014
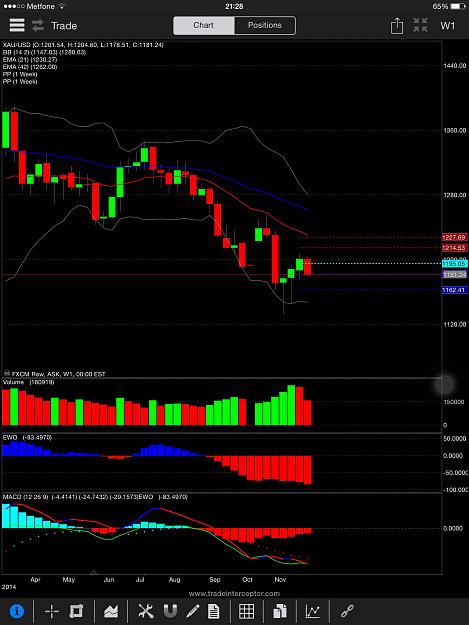
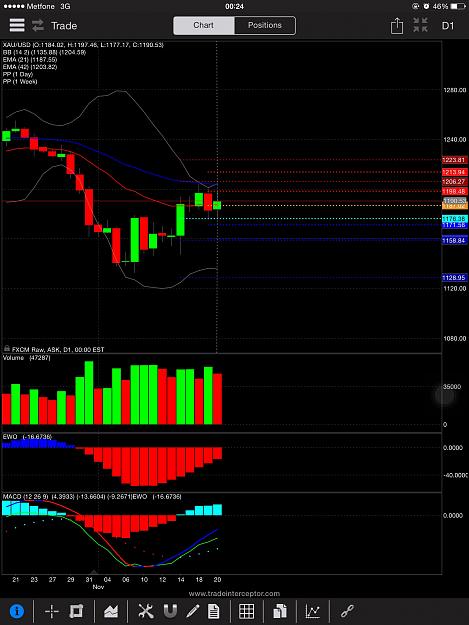
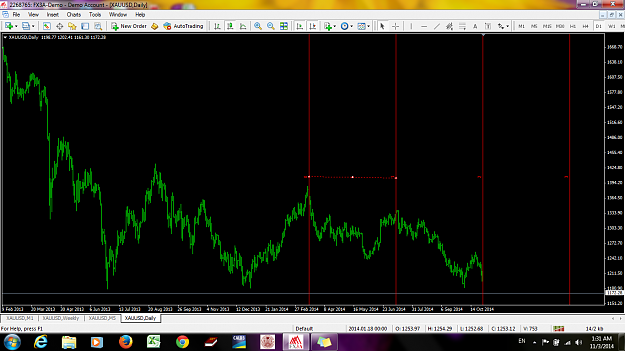
Hello, there is a difference on gold daily time frame. Now the chart is synched with Stoch indicator. Should we buy or sell now? image
The similarity system
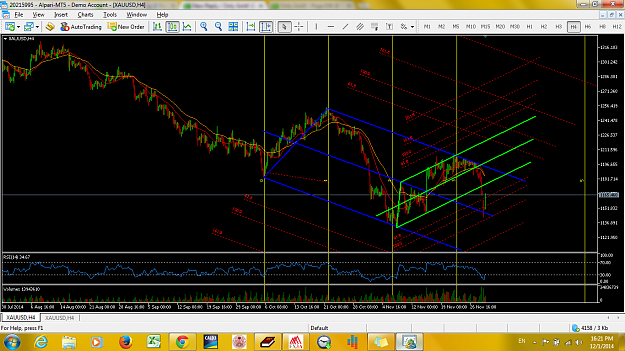
- Samsamall replied Dec 1, 2014
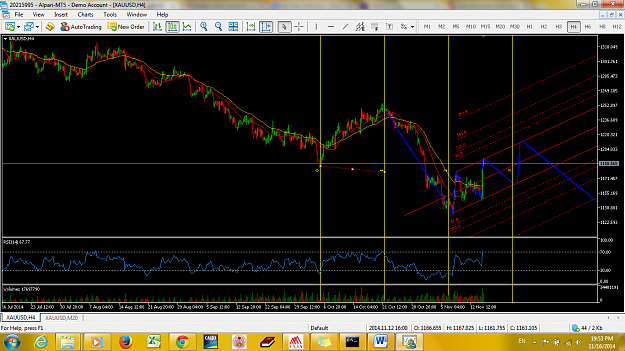
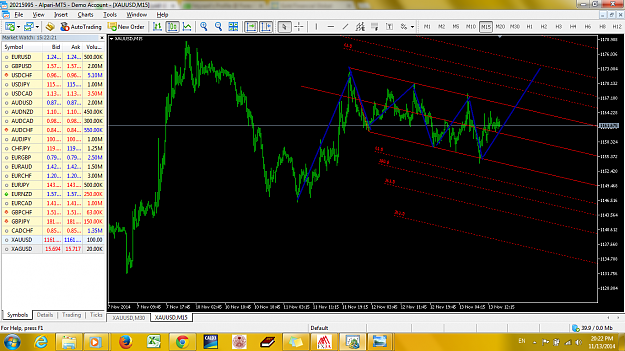
Fib timezone combined with Andrews' Pitchfork. I drew this chart since mid-November to predict gold price personally. IMO, still bearish, and big bear. image
Only Gold!
- Samsamall replied Nov 28, 2014
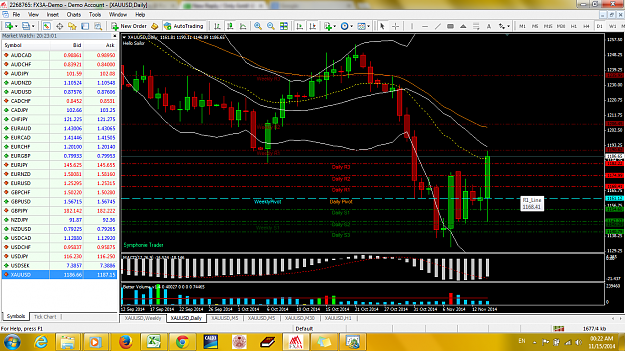
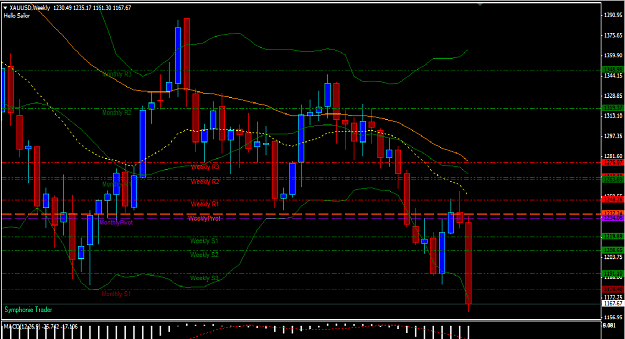
last week gold hit weekly R1 at 1206, and was unable to stay above that. Today is the last day of the week and month. IMO gold will stay around 1181 because this is the weekly S1. I hope to see lower price in next week. Look at weekly chart, ...
Only Gold!
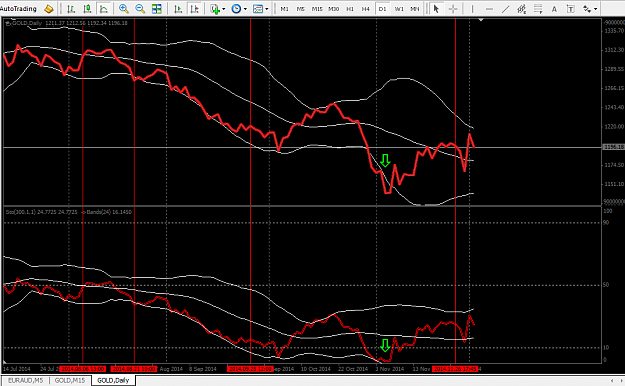
- Samsamall replied Nov 27, 2014
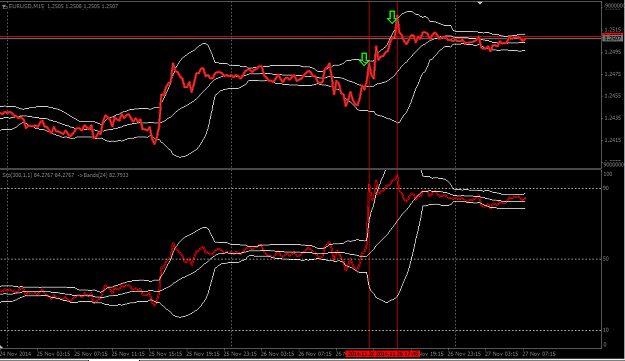
Could anyone tell me should I buy or sell at these green arrows? Regards, image
The similarity system
- Samsamall replied Nov 20, 2014
Tomorrow is Friday, I think 1206 (weekly R1) will be hit. IMO, if it managed to close above this, we will see another bullish stage. But I don't have confidence that bullish is strong enough to kick bear out yet around 1206. image
Only Gold!
- Samsamall replied Nov 16, 2014
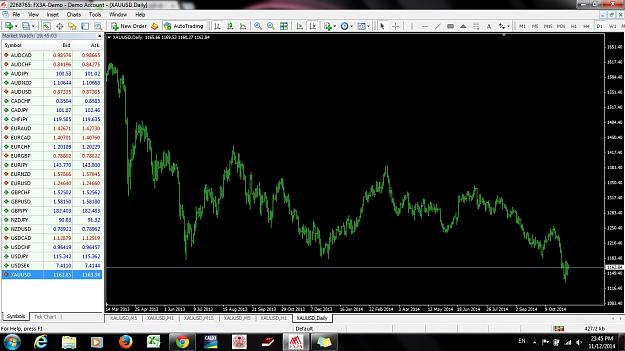
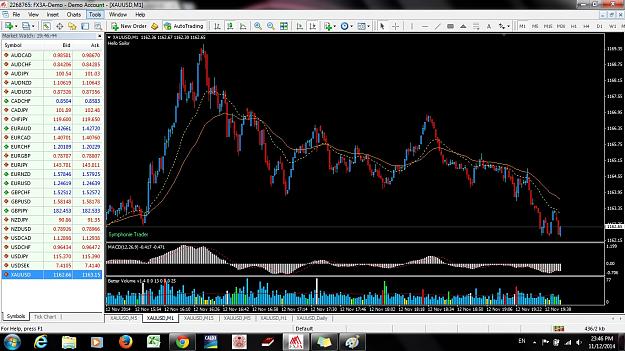
One more post! This one is strange but I was almost shocked. One is 1 Minute, the other is Daily time frame. I was confused when looking at them!!! look very similar. Look at the date time and check back by yourself. Daily image 1M image
Only Gold!
- Samsamall replied Nov 16, 2014
My fib timezone combine with chart pattern. I think this is a small bullish in big bearish trend. image
Only Gold!
- Samsamall replied Nov 14, 2014
Hahah! I couldn't believe this!! Gold already touch the 1st weekly resistant line at the price 1190. So please be careful. I think we should wait for monday next week to see what is going on. Good luck every body. image
Only Gold!
- Samsamall replied Nov 13, 2014
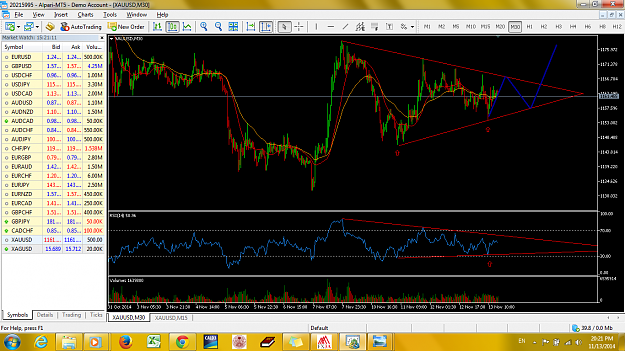
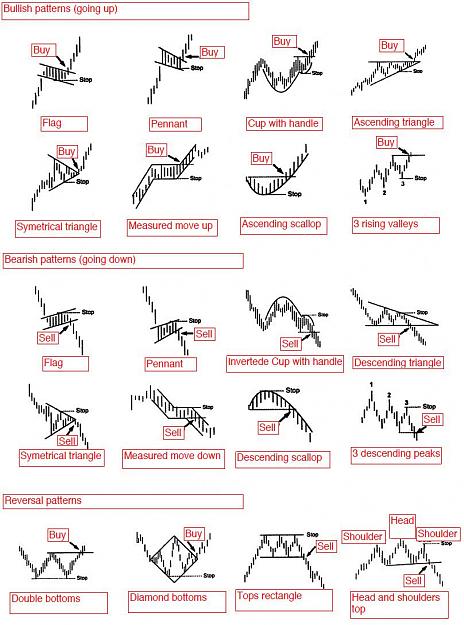
Today is a boring day. On 30 minute time frame it is forming a triangle. IMO, the probability to go up is 70%, down only 30%. The RSI support moving up also. Just my opinion. Trade at your own risk. 30M image 15M image Pattern image
Only Gold!
- Samsamall replied Nov 7, 2014
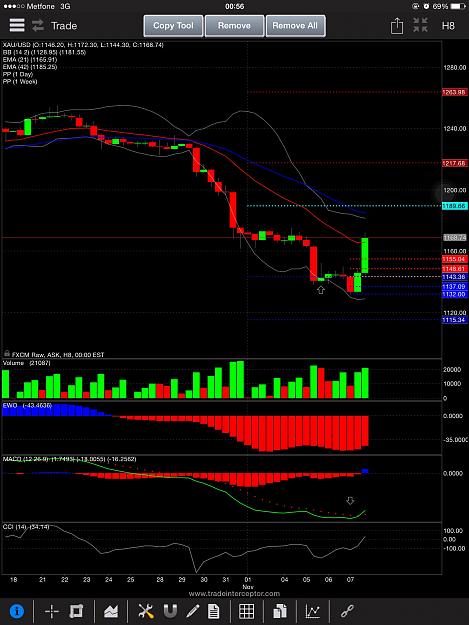
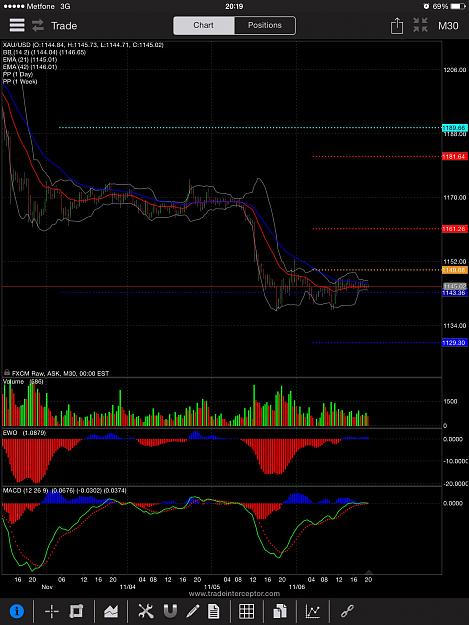
I suspected a bounce back this morning because I see a long red bar close outside Bolling band, and the following bar is green. And also MACD signal line is about to cross each other on 8H chart. This pattern happen a lot of time on small and high ...
Only Gold!
- Samsamall replied Nov 7, 2014
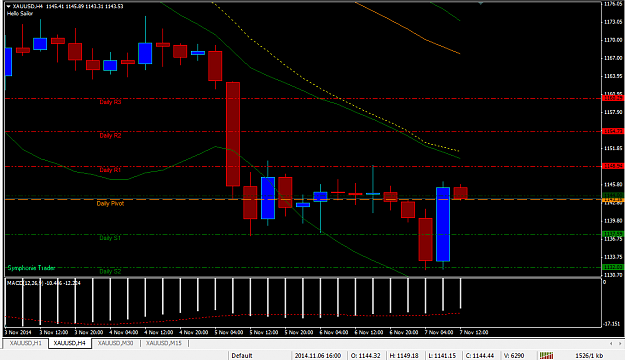
On my chart it is not PIN bar like yours. But I think it's going to hit 1149 which is first Daily Resistant Line because H4 managed to close above Daily Pivot Point 1143. Also 1143 is the first Weekly Support line. So the bull and bear are trying to ...
Only Gold!
- Samsamall replied Nov 7, 2014
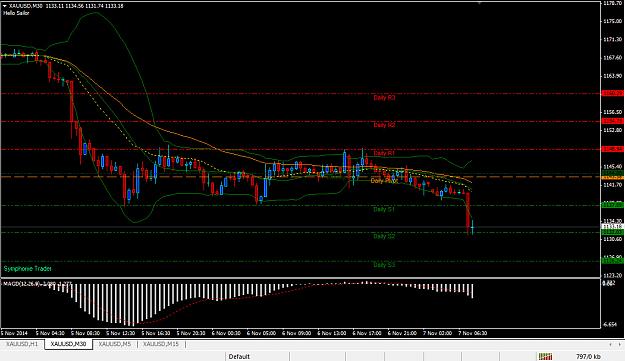
Got 600+ pips today. Now I'm out from short when the price hit 1st daily support line 1132. Wait and see if the price dive lower than 1132 in large volume. I'm afraid that the price could a little bounce back today. image
Only Gold!
- Samsamall replied Nov 6, 2014
Hi there, I think the market is about to move now. Please prepare yourself. I prefer short now, and at stop lost @ 1154. Good luck guys. image
Only Gold!
- Samsamall replied Nov 5, 2014
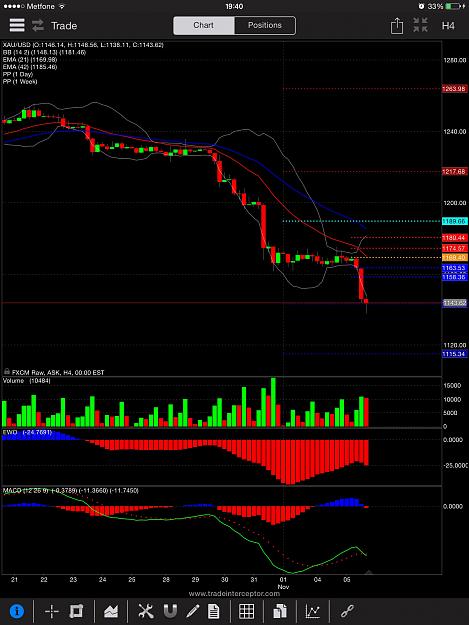
If the price manage to close under 1143 on H4 time frame we will see 1115 very soon without bouncing back. image Trade at your own risk. Don't follow one's opinion.
Only Gold!
- Samsamall replied Nov 5, 2014
I think $1106 will be hit very soon in this week, and look like there is NO bounce back to $1200 at all. 1106 is fib expansion 100%, 1114 is 3rd weekly support line. image
Only Gold!
- Samsamall replied Nov 3, 2014
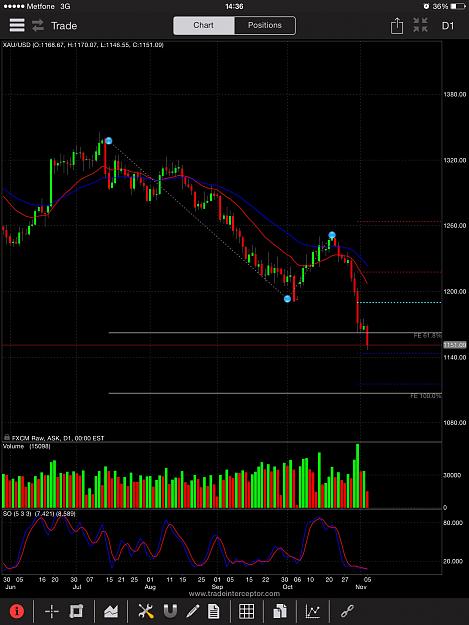
IMO, the bull is still strong, but the reason that caused gold to drop a lot these few days is because of good data from US. I think most people don't expect gold to drop as low like this. Look at the chart 1Day we can see increasing in volume of ...
Only Gold!
- Samsamall replied Nov 2, 2014
Fibonaci Time Zone. The 0 and 1 lines are on the top of market, the days with highest price, and the 2 line are on the bottom of the market. image
Only Gold!
- Samsamall replied Oct 31, 2014
Please be careful. We should not trade at this time because today is Friday, and the last day of October. The price could be go back to $1178 (first support level of this month). I think we should wait for next week to see where the price close. Got ...
Only Gold!
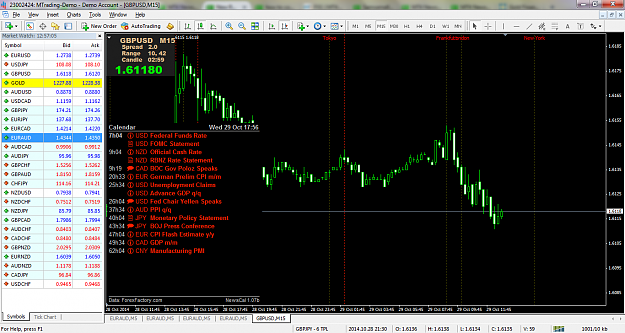
- Samsamall replied Oct 29, 2014
Hi euclid, Thank you very much for these great indicators. They are very useful.
MT4 News Calendar Indicator
 image
image
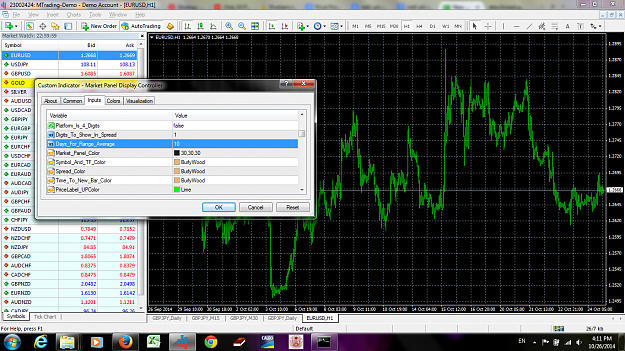
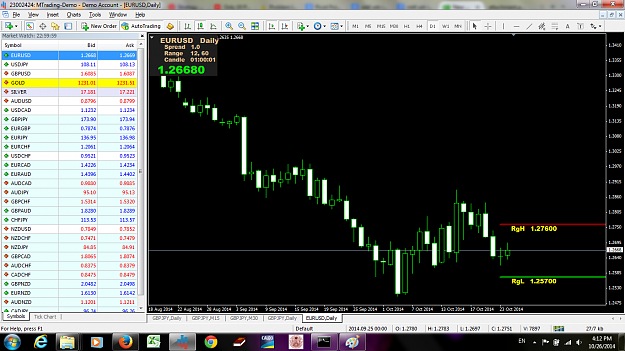
- Samsamall replied Oct 26, 2014
Hello, There is something similar with much more detail information. Please check attachment if this is what you need. "Days_For_Range_Average" is the input that you can change to fit the period you want. Best. image image
Need an ADR Indicator for MT4