- Search Metals Mine
- 30 Results
- Sakeplz replied Nov 29, 2016
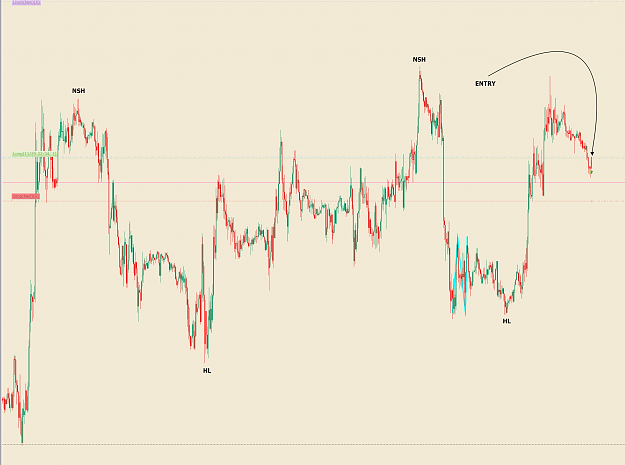
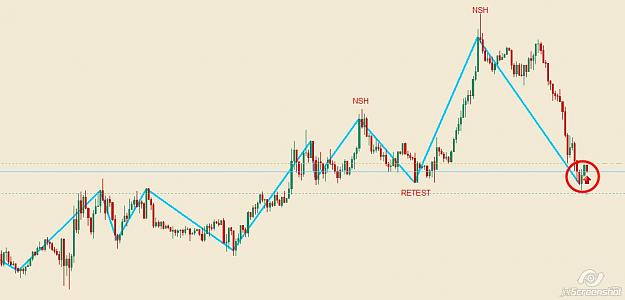
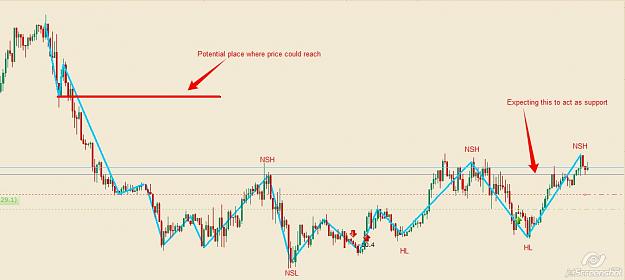
GBP/USD image Entry due to an expectation of a NSH. The trade poses little risk due to short-term expectation being confluent with long-term expectation, and it's at structural support, based on horizontal line. And yes....I am over-trading.
Ratios & Harmonics: a Different Way to Trade
- Sakeplz replied Nov 29, 2016
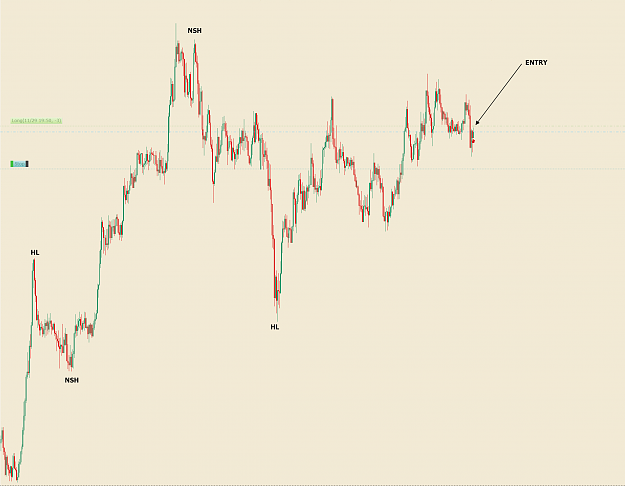
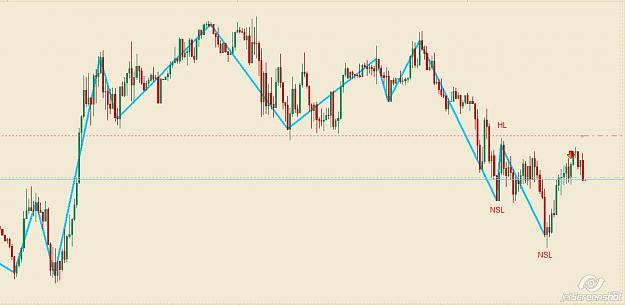
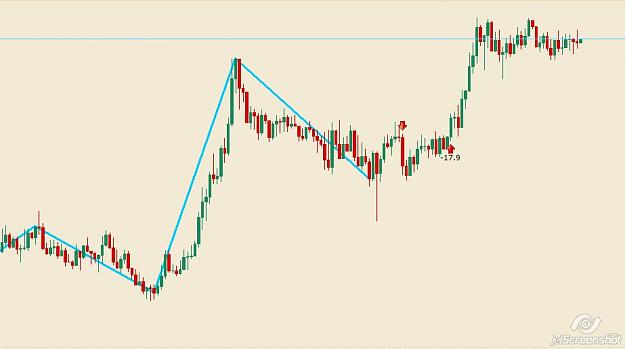
AUD/JPY image Entry isn't exactly ideal, but am expecting this structure to hold as support. Trade was based on the expectation of a NSH. Entry is due to demand at that level followed by candle spike.
Ratios & Harmonics: a Different Way to Trade
- Sakeplz replied Nov 29, 2016
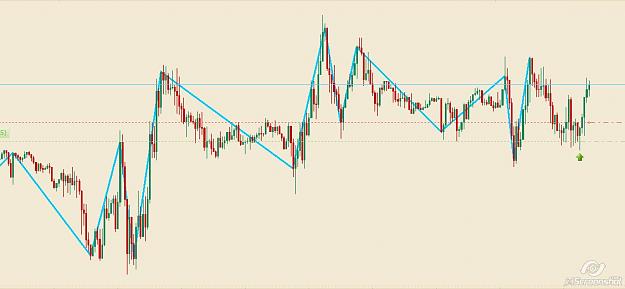
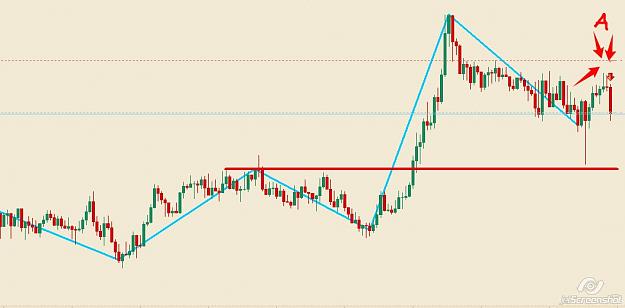
USD/CHF image Still in this trade for +38 pips. This is the only trade that work well so far for me this week. I'm expecting that price either retrace to zone A to let me add on another short entry, or make a NSL and hit my target.
Ratios & Harmonics: a Different Way to Trade
- Sakeplz replied Nov 28, 2016
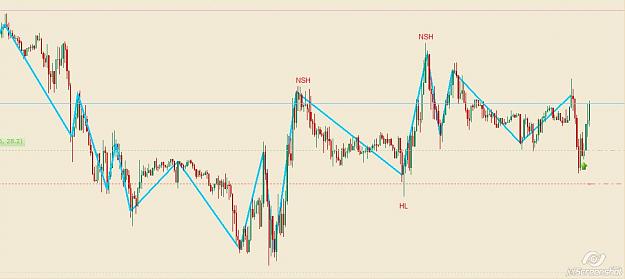
EUR/USD image First trade of the week. As soon as I entered I got stop out. Next time I'll wait to see if there's a weakness in price before I enter.
Ratios & Harmonics: a Different Way to Trade
- Sakeplz replied Nov 25, 2016
USD/CHF image I entered a bit early but I followed my trading plan and didn't exit my trade when I see price steadily climb to the recent HL. My target would be the next structure but would exit early if there's a sign of weakness when it test the ...
Ratios & Harmonics: a Different Way to Trade
- Sakeplz replied Nov 25, 2016
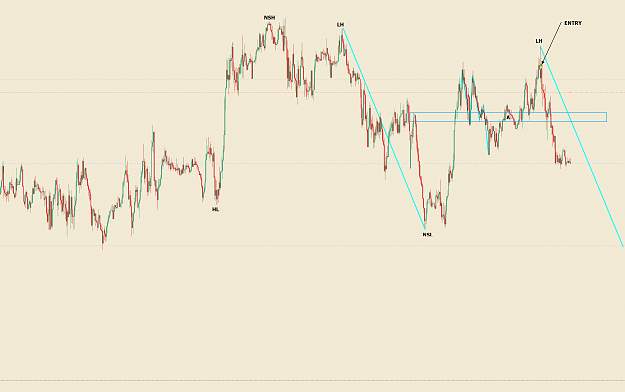
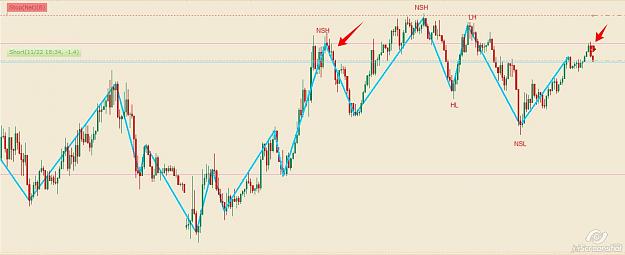
Gbp/Usd image Reason for trade is the same as the first Gbp/Usd trade. NSH on the short expectation which match with the long-term NSH. Entry based on the many candle wick spike which represent demand, and price fail to close below that HL. Edit: ...
Ratios & Harmonics: a Different Way to Trade
- Sakeplz replied Nov 25, 2016
Gbp/Usd image Reason for entry: Price didn't close below the HL which would invalidate my expectation for a NSH. Another reason was the strong bullish rejection at that level. I didn't enter on the bullish candle but instead waited for price to ...
Ratios & Harmonics: a Different Way to Trade
- Sakeplz replied Nov 24, 2016
image Got stop out for -18 pip. Got stop out for -18 pip
Ratios & Harmonics: a Different Way to Trade
- Sakeplz replied Nov 23, 2016
NZD/JPY image This is a risky trade since it's going against a long-term expectation for a NSH. Reason for the trade is after the candle spike, the bull fail to follow through and bring price up that level. Instead there was a weak pullback in ...
Ratios & Harmonics: a Different Way to Trade
- Sakeplz replied Nov 23, 2016
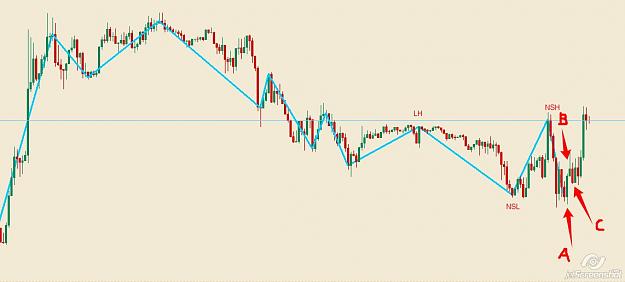
image I saw this Gbp/Usd setup and didn't take it. My hesitation was due to seeing the candlestick at (B) and (C). If I was at the comp when I seen the candlestick (A) I would had most likely jump the gun and taken the trade due to: 1. Price ...
Ratios & Harmonics: a Different Way to Trade
- Sakeplz replied Nov 23, 2016
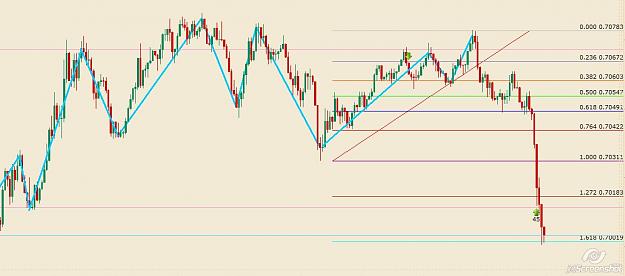
image Close for +45 pips, hit my target at the 1.272 level.
Ratios & Harmonics: a Different Way to Trade
- Sakeplz replied Nov 22, 2016
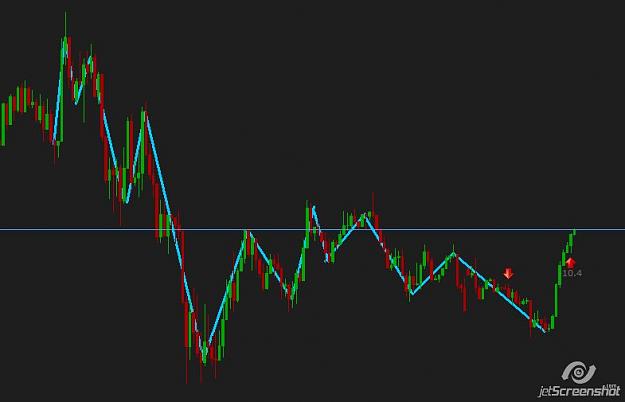
NZD/USD image My expectation is a NSL and entry was based on the bearish engulfing candle at the previous NSH. If I'm right, price should not climb above the previous NSH and hit my stop at the LH and creating a NSH.
Ratios & Harmonics: a Different Way to Trade
- Sakeplz replied Nov 21, 2016
My Eur/Usd trade of the day. image My stop is currently place below this current structure that I'm expecting to hold, if price were to went against me I would secure 10 pips.
Ratios & Harmonics: a Different Way to Trade
- Sakeplz replied Nov 20, 2016
Manually got out for -10 pip when price close above the LH. image
Ratios & Harmonics: a Different Way to Trade
- Sakeplz replied Nov 20, 2016
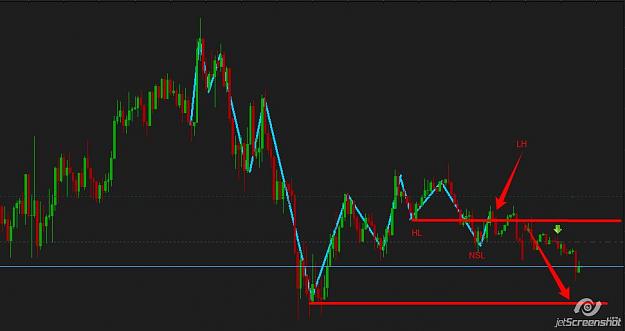
EUR/USD 5 MIN image This is my analysis of the trade. Price had broken the HL, creating a NSL. Entry is shown on the chart and stop is above the LH, my expectation is for price to reach test the structure marked. Sorry for the line on the chart, ...
Ratios & Harmonics: a Different Way to Trade
- Sakeplz replied Nov 18, 2016
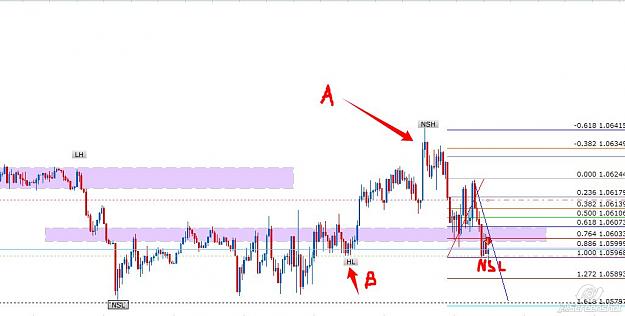
Close the trade for +16 pip due to sign of weakness. image Mr. Pip, when price had made a NSH should my HL be marked at when (A) is at or where (B) should be at?
Ratios & Harmonics: a Different Way to Trade
- Sakeplz replied Nov 18, 2016
image Set stop loss to +4 pip, I expect for price to hold below the red horizontal line, and for the bull to not be able to close above it.
Ratios & Harmonics: a Different Way to Trade
- Sakeplz replied Nov 18, 2016
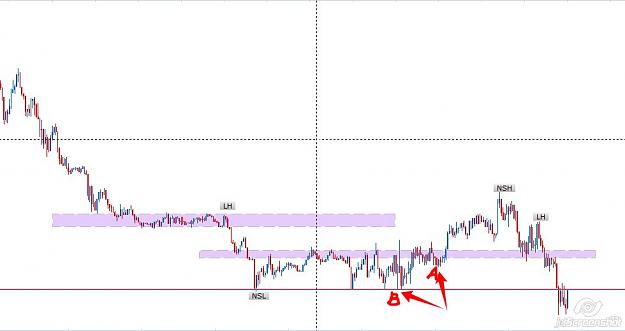
Morning everyone, hope everyone trade went well today. My USD/JPY trade got stop out yesterday but it's fine. Here's my trade for EUR/USD 5 MIN. image The long-term expectation is a short. Price had made a recent NSH (A) but ended up breaking down ...
Ratios & Harmonics: a Different Way to Trade
- Sakeplz replied Nov 17, 2016
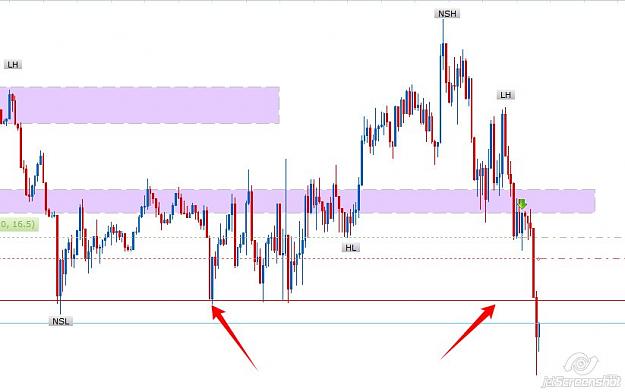
NZD/USD 5 MIN image The L/T expectancy is short. Price pulled to the zone marked on the chart and the bull struggle to overcome the zone and was not able to close 100% on the zone but instead loses steam which shown by the many candle wick and a ...
Ratios & Harmonics: a Different Way to Trade
- Sakeplz replied Nov 17, 2016
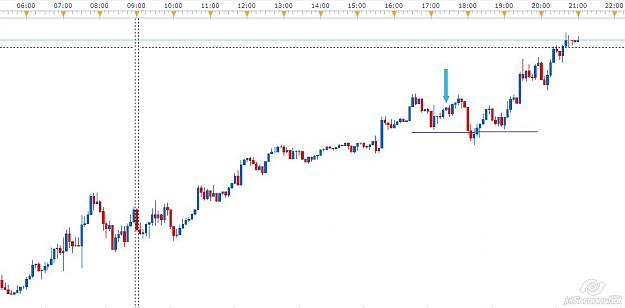
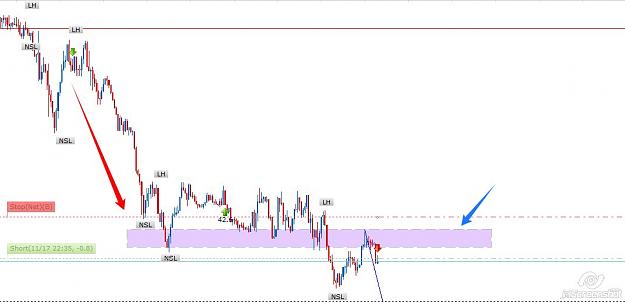
image For my first trade, I went long at the arrow and I got stop out at the blue horizontal line on the chart. I usually risk 1% and a little under 2% on all my trade, never more than that. You never know if someday you have 5 loss in a row. And ...
Ratios & Harmonics: a Different Way to Trade