- Search Metals Mine
- 179 Results (7 Threads , 172 Replies )
-
 Proximus replied Nov 24, 2014
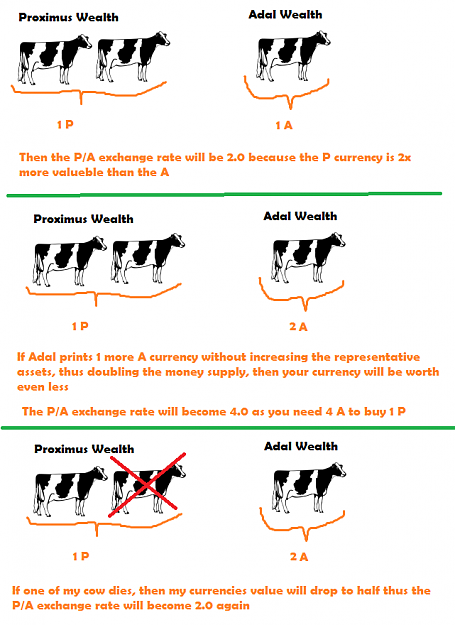
Ok then, i confused the volume with the market cap. Anyway the volume only causes volatility, but the price itself is i think defined by the market cap of each separate currency.I`ve looked into fundamental analysis, and i tried to quantify it but ...
Statistical mean of the market [quant corner]
- Proximus replied Nov 10, 2014
Ok i`ve found a serious issue with my method, it actually ignored the highest highs and lowest lows, the green candlestick that you drawed on the previous picture made me figure that out lol, so my eternal thanks for that. I actually only looked at ...
Statistical mean of the market [quant corner]
- Proximus replied Nov 10, 2014
It can happen but unlikely, maybe after i narrow down my field of research then i make those numbers more accurate by working with the tick data, but for now its ok to use 1m bars. I dont rebuild the chart at every time, it just iterate through it ...
Statistical mean of the market [quant corner]
- Proximus replied Nov 10, 2014
Well i`ve took a little time of trading and all this forex business, but now i`m back and i will continue my research. I needed this break, it was just too stressful with all my research that i`ve been doing very hardly. So now i`m resuming to check ...
Statistical mean of the market [quant corner]
- Proximus replied Oct 30, 2014
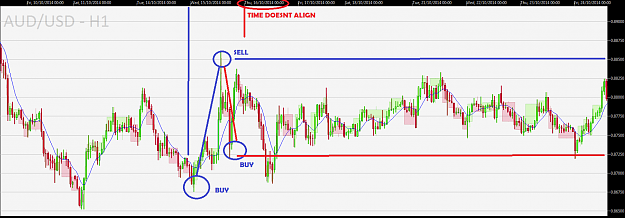
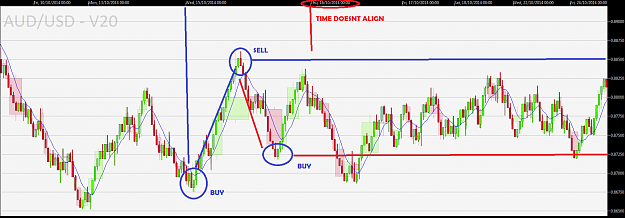
No you dont understand, the 2 charts don't align, therefore if you backtest only on the price chart you will get a fake backtest result which doesnt match reality. Because only the time*price chart which the broker gives is valid, there you execute ...
Statistical mean of the market [quant corner]
- Proximus replied Oct 27, 2014
Here is it. Note that the indexes of the bars might not line up as they are drawn index by index, not by time, since my "holy grail" chart is a pure price charts so there is no time dimension. So since the candles are drawn index by index, there ...
Statistical mean of the market [quant corner]
- Proximus replied Oct 25, 2014
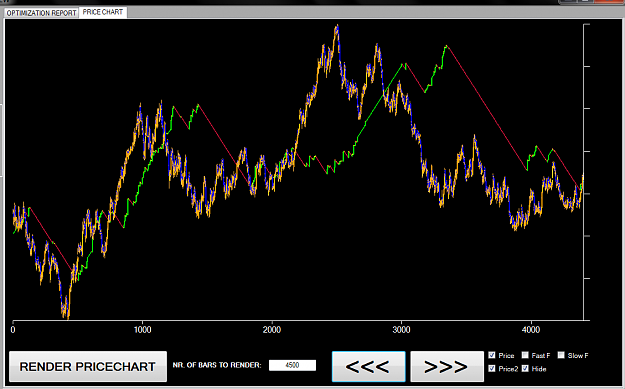
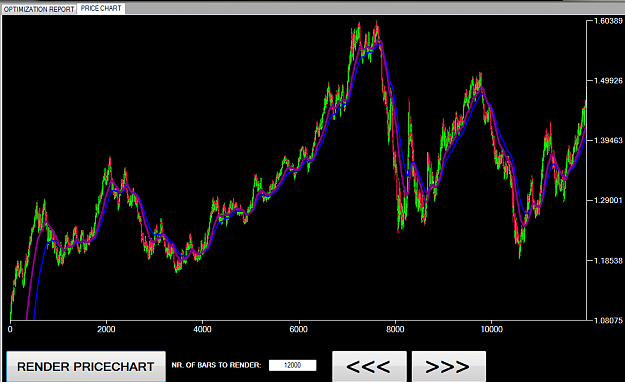
Ok here is my filter 3.0 After transforming the price to a noiseless stream, i succeeded finding a very nice transformation, which filtered so much noise out that it is possible to trade only trends, and all inbetween was filtered out, so a trend ...
Statistical mean of the market [quant corner]
- Proximus replied Oct 23, 2014
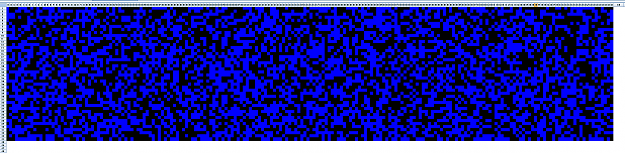
Hey i`ve transformed the price (removed as much noise as possible without distorting the accuracy of the candles) image Does it look less random than the one shown @ post 28 Can you spot any patterns here, it should be more relevant since i ...
Secret footprint in the markets
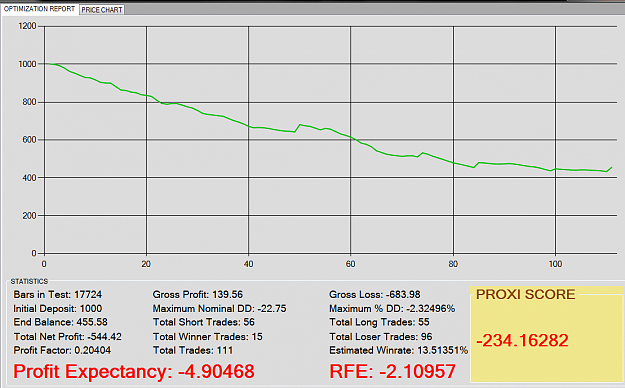
- Proximus replied Oct 23, 2014
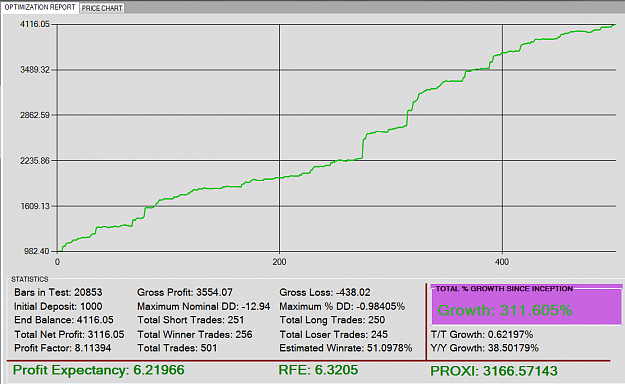
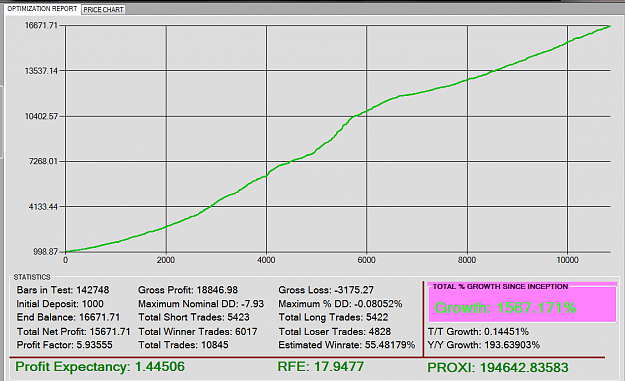
Ok i`ve just reconsidered my goal as i think 10,000% is not really needed, i think 5000% is already better than enough. image This is a fake optimization report made on fake historical data, so dont get excited and think that I`ve found the Holy ...
Statistical mean of the market [quant corner]
- Proximus replied Oct 23, 2014
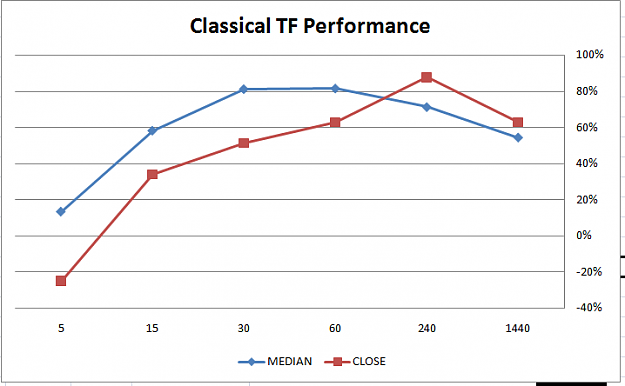
Actually I took the liberty to analyze the TF's again, and yes my conclusion still stands, I just dont see how Adal's claims that tick charts are good, is correct. image I`ve tested my basic filter on all timeframes with median and close prices, ...
Statistical mean of the market [quant corner]
- Proximus replied Oct 22, 2014
Ok screw the entire PROXI SCORE benchmark system, it's a useless crap. It is not worth to measure the drawdown, because it only distorts my research. I have to conclude that the DD is not important, the DD will be adjusted only by the position size, ...
Statistical mean of the market [quant corner]
- Proximus replied Oct 22, 2014
Ok so far, my research is pretty much capped as the problem with the price is that it's too choppy, no matter what filter I put in, those nasty spikes always get around it. Adding 2-3 filters to filter them out would only cause more lagg and would ...
Statistical mean of the market [quant corner]
- Proximus replied Oct 21, 2014
Yup, not really good. I`ve tested all orders of the EMA, from 1 to 6 ( ARIMA(0,6,1) )and the 4,5,6 capped at the same result. (GAMMA & EPSILON & ZETA coefficients both under 0.01 and identical in value suggesting that you dont need more than 3) Only ...
Statistical mean of the market [quant corner]
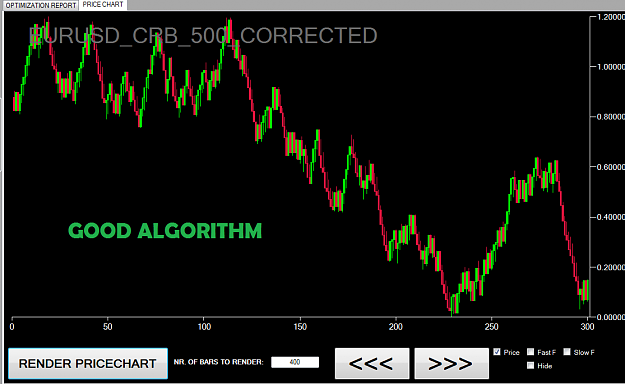
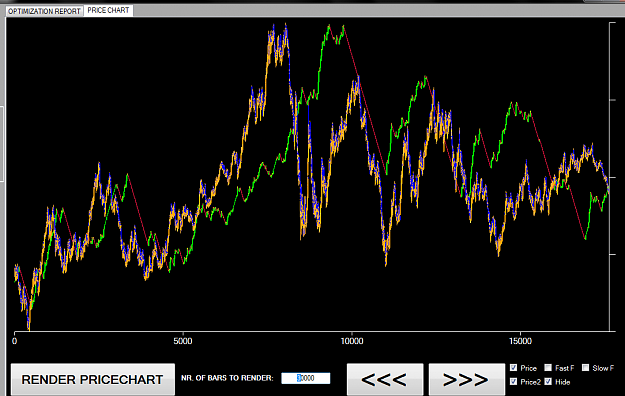
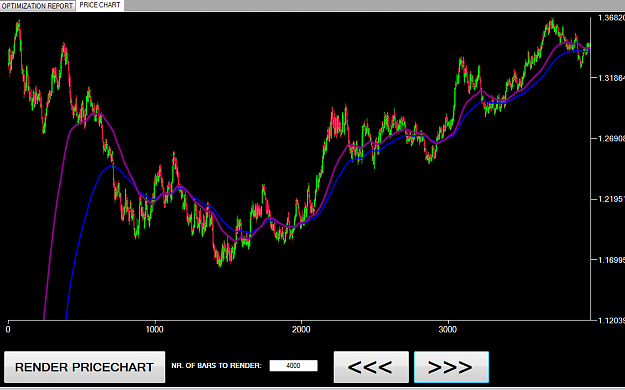
- Proximus replied Oct 19, 2014
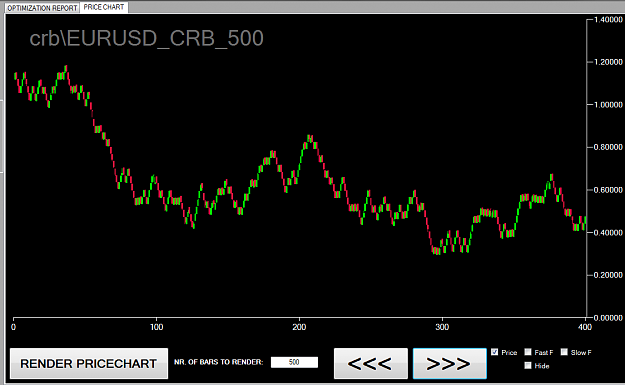
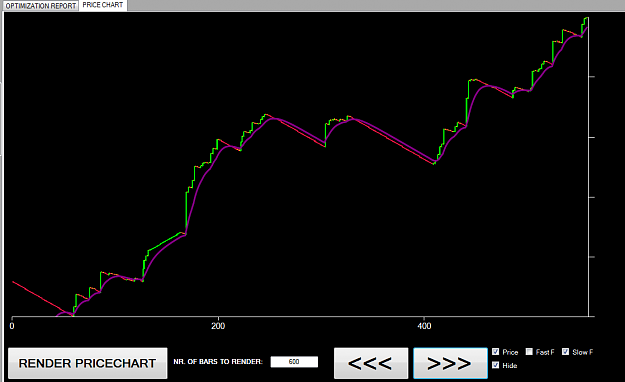
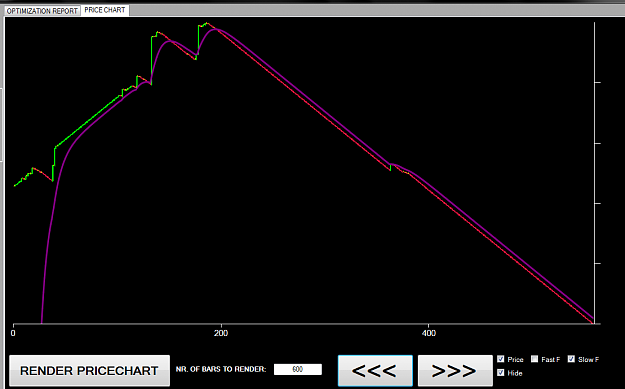
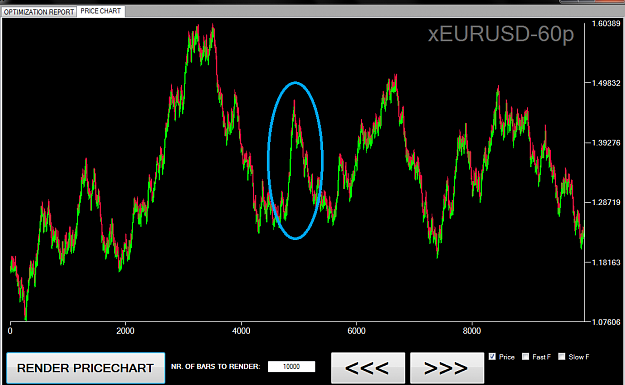
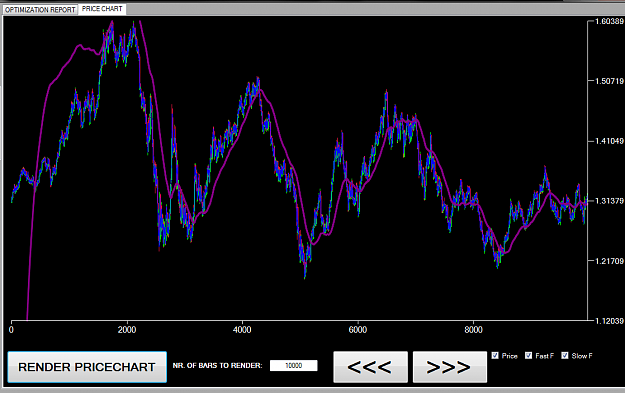
On a price chart it looks like this: image Just ignore the first 500-600 bars, it needs those to stabilize itself, and that part, precisely the first 1000 bars are not counted in the optimization, because that is reserved for the filter to ...
Statistical mean of the market [quant corner]
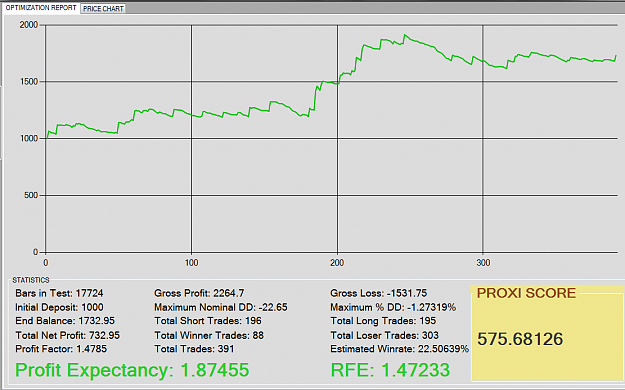
- Proximus replied Oct 19, 2014
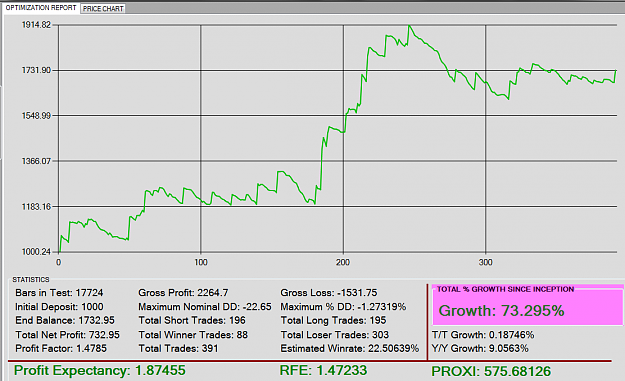
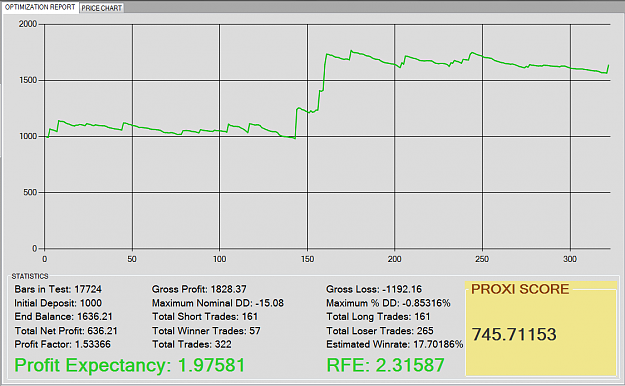
Found a better filter: (FILTER 2.8) image 745.71 PROXI SCORE (+90.01) 2.31 RFE (+0.66) 322 TRADES (-75) 17.7% WINRATE (-4.9) 1.53 PROFIT FACTOR (+0.04) A little bit better ,although i dont like the fact that we had 75 less trades, and also dont ...
Statistical mean of the market [quant corner]
- Proximus replied Oct 15, 2014
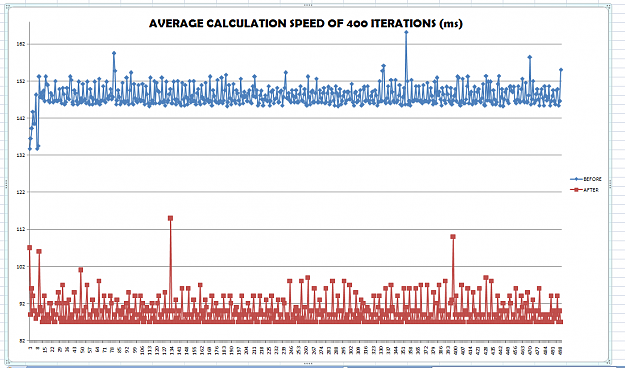
My program was getting too slow as i added new features to it to calculate my stuff better, so it really got slow. So I had to check my code and make it more efficient, therefore i packed more stuff into variables and functions rather than just ...
Statistical mean of the market [quant corner]
- Proximus replied Oct 14, 2014
Thats only if the filter is configured wrong Most of the time this happens: image The initial spike gets smoothed out, causing lagg yes, but the benefit of accuracy due to smoothing is bigger than he lag handicap caused by smoothing. Therefore it ...
Statistical mean of the market [quant corner]

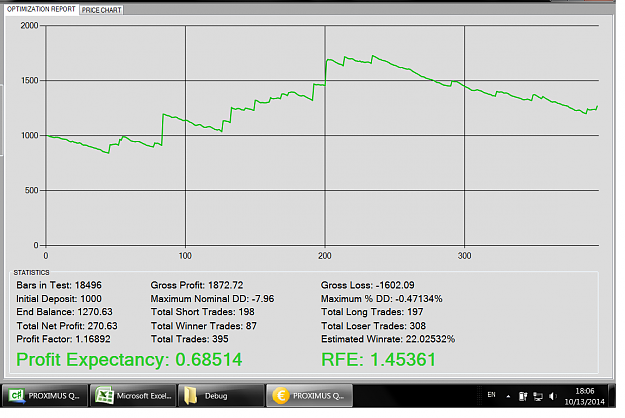
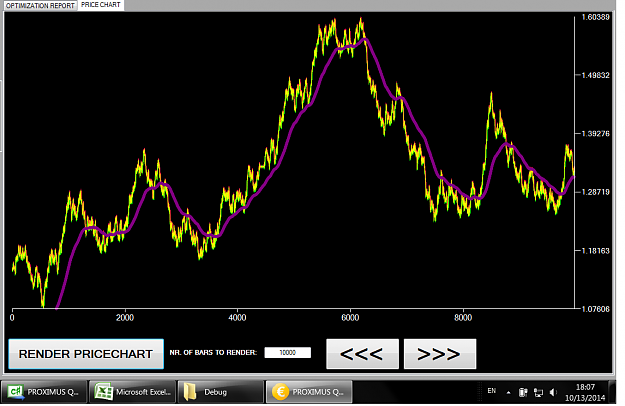
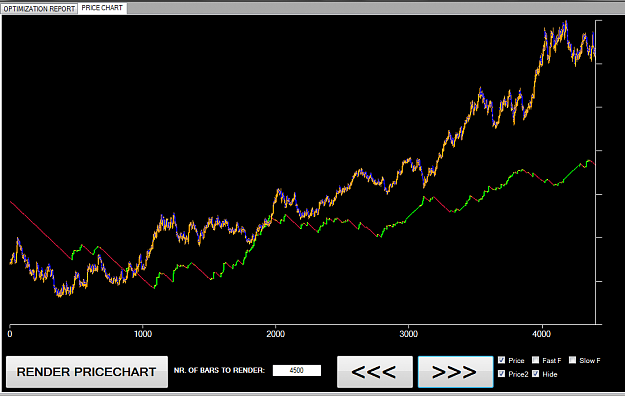
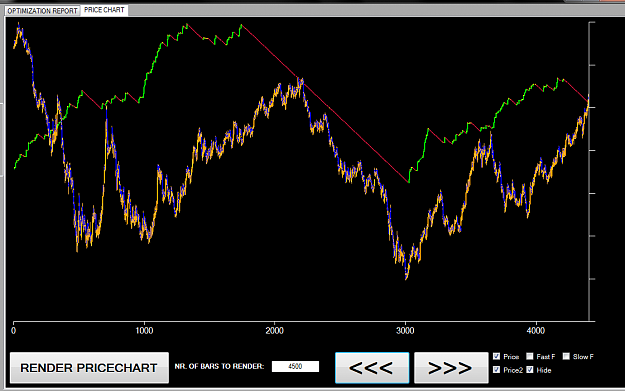
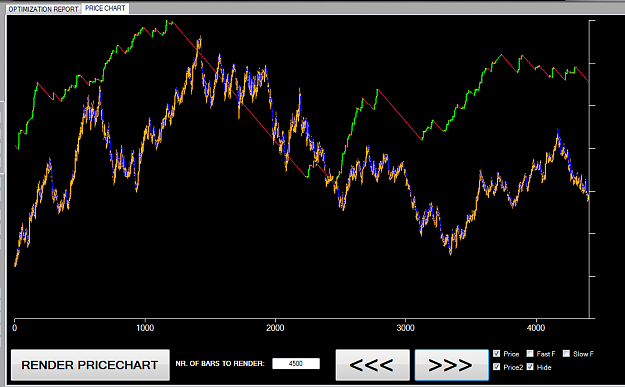
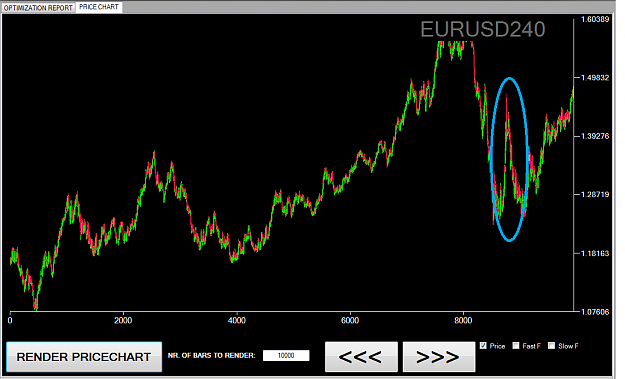
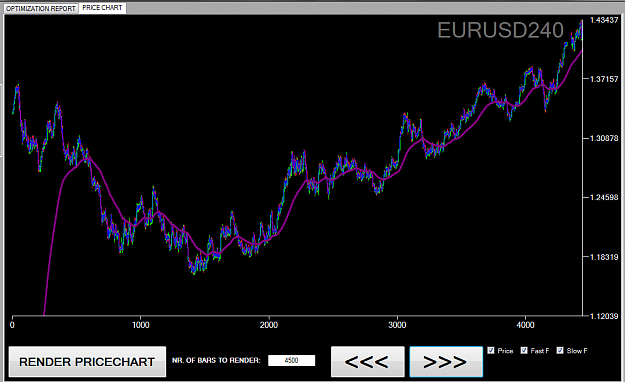
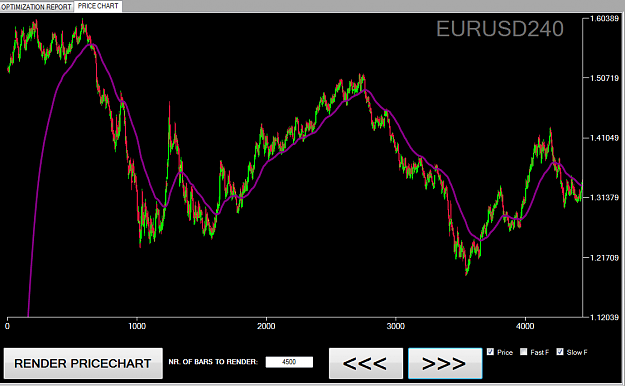
- Proximus replied Oct 13, 2014
Also the 2 moving average method, atleast for my current filter is not an option. It may be for other filters, but the current one can't handle it. image image image This is the best result with 2 filters, and it's not good, so at the moment ...
Statistical mean of the market [quant corner]
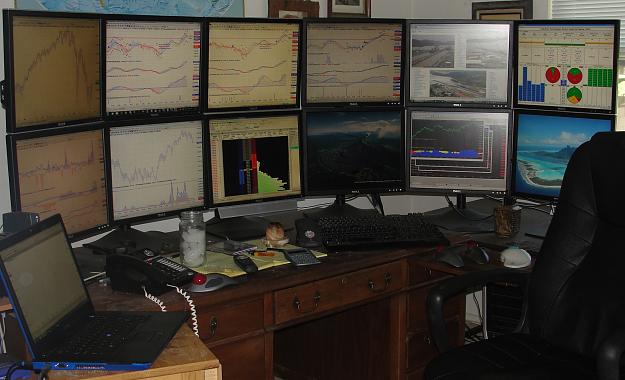
- Proximus replied Oct 13, 2014
No! Typical retail trader: image image Typical professional trader: image Found the difference? Hint: it's not the gender, it's the fkin number of monitors
95% Lose in FX is a Myth: % Profitability in the US last year


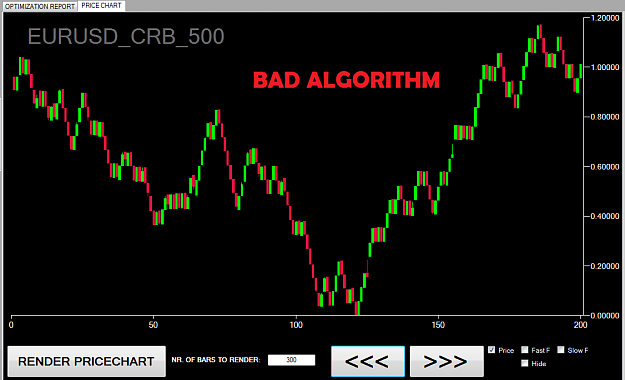
- Proximus replied Oct 13, 2014
Ok i`ve checked if the range bars were good enough, but looks like it is not: The 10 pip constant range bar failed horribly on the long run, so i used 46 pip bars, because 46 pip is the average bar size on H4 timeframe to be similar. So the best 46 ...
Statistical mean of the market [quant corner]