- Search Metals Mine
- 22 Results
-
 Polaris4dy replied Jun 5, 2014
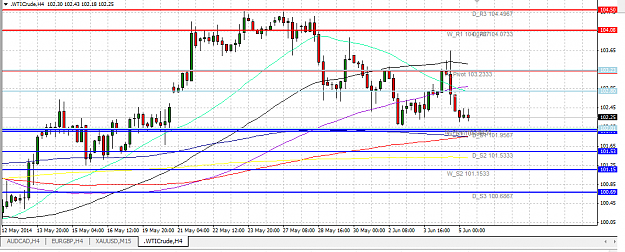
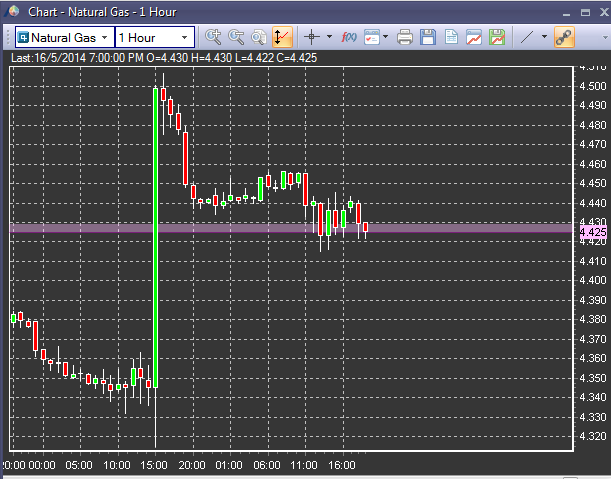
crude seems to be ranging...sell limit at 104.08 (weekly pivot resistance) target 103.23 buy limit(better one) at 102.01(monthly pivot +daily pivot support+weekly pivot support) + SMA300 and SMA200 nearby...target 102.8 daily pivot
About the course
- Polaris4dy replied May 30, 2014
ooohh yeah ada ichimoku juga..
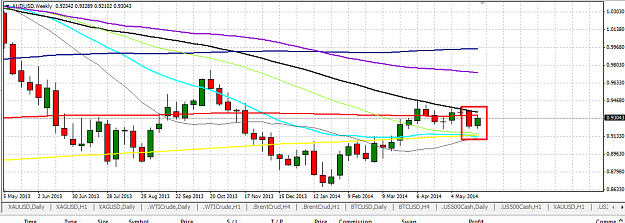
AUD/USD on the weekly chart there is an inside bar as well...
- Polaris4dy replied May 26, 2014
power short to daily pivot support 1...long term outlook is bearish too due to weekly power. Legit?
About the course
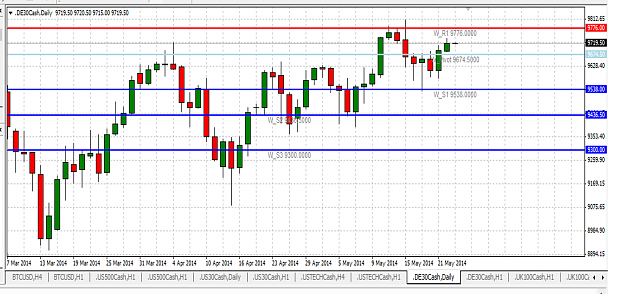
- Polaris4dy replied May 22, 2014
set a sell limit at 9776...color+weekly pivot resistance + previous resistance....most probably won't hit the sell limit..invalidated in 1 day... PS: I'm trying to put what was learned in the course into practice
About the course
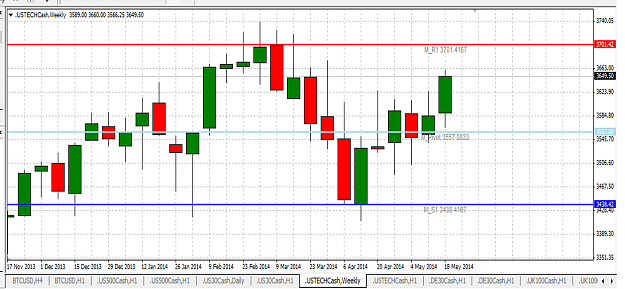
- Polaris4dy replied May 22, 2014
this one can short at 3700 next week...if it gets to 3700, there will be previous resistance + monthly pivot resistance + colors.. note that previous color failed too... no sma in all TF to support though...
About the course
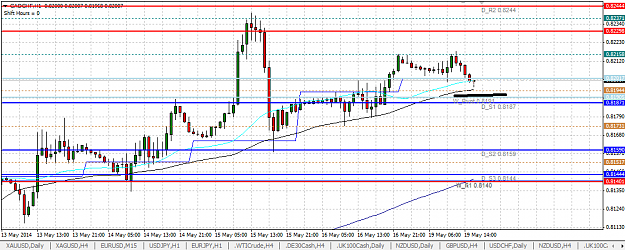
- Polaris4dy replied May 19, 2014
CAD/CHF maybe wait for long first close below SMA 32 and 64, plus weekly pivot support there...take profit in new high? maybe completely wrong though
About the course
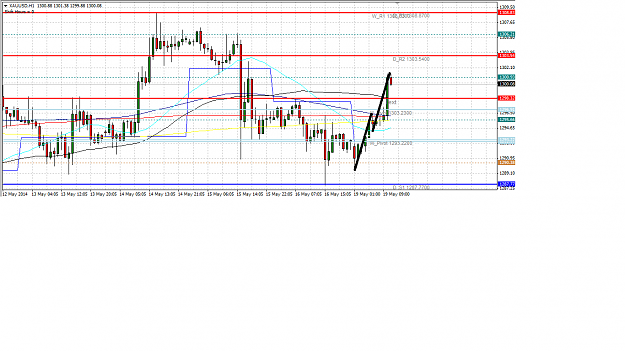
- Polaris4dy replied May 19, 2014
something like that I think..above 1303.54 price has daily pivot resistance 2(not very important though)..the stronger resistance will be 1309 weekly pivot resistance+daily R3 PS: I don't have very good feeling about this ABCD though...a bit "rush" ...
About the course
- Polaris4dy replied May 16, 2014
yeah mate, you added him on skype? I'll add you soon! very inspired by your patience...last time you hold from 1180 all the way to 13xx, this time from 1272..haha I'm trying hard to hold small position for long time now..see how it works Cheers bro, ...
About the course
- Polaris4dy replied May 11, 2014
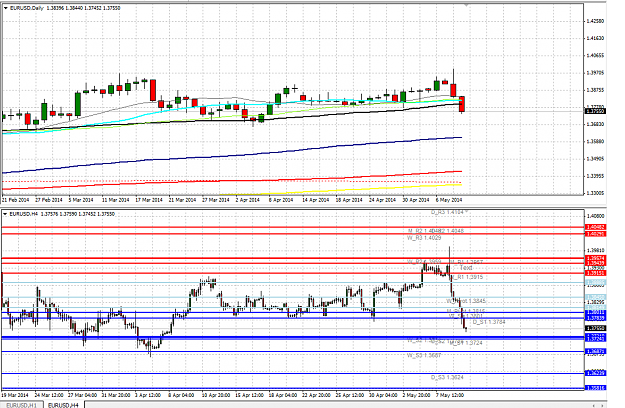
Hey guys, trying my hands on pivot play this time.. EUR/USD looks very nice to long....Weekly, monthly and daily support + first time close below SMA 32&64. I will open long as soon as the market start (X1), add more long if it touches 1.3725 (X2) ...
About the course
- Polaris4dy replied Apr 22, 2014
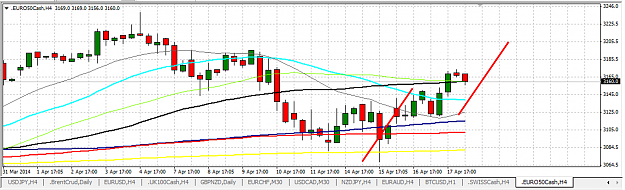
euro50cash...AB CB in the making..target 3200...many SMAs supporting... Btw, take it with pinch of salt, I'm practicing what I've learned, 80% chance I'll be wrong
About the course
- Polaris4dy replied Apr 22, 2014
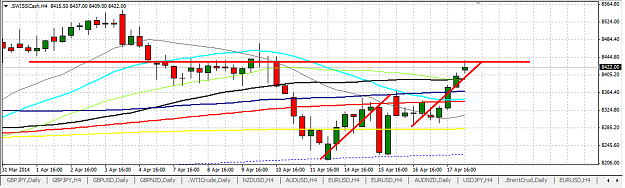
swisscash..I think it is due for a pullback to sma200...previous resistance + ABCD...volume is dying out too... my broker has the chart but I couldn't place the order...weird...
About the course
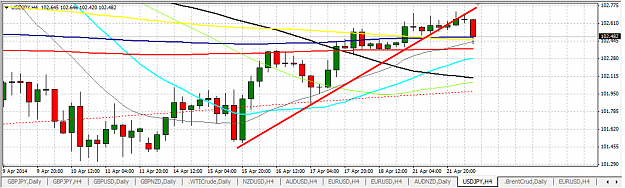
- Polaris4dy replied Apr 22, 2014
any opinion on USD/JPY? trying to put theory into practice, it looks like trendline false break...all SMAs are below supporting... is it wise to long in this case?
About the course
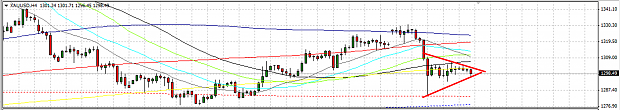
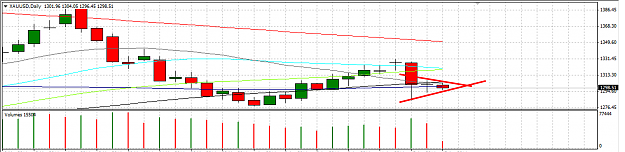
- Polaris4dy replied Apr 17, 2014
technically both H4 and Daily timeframe shows bearish pennant..target around 1270...maybe quite probably not today...but daily volume seems to be dying... you can put a sell stop below this price, when it falls, I have a feeling it's gonna fall with ...
Only Gold!
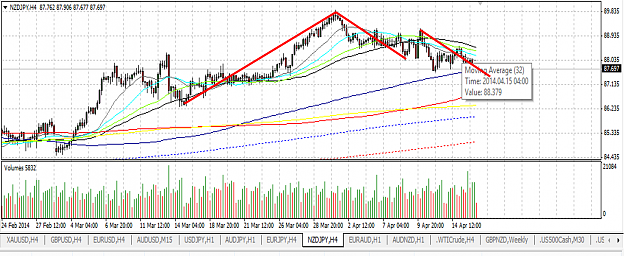
- Polaris4dy replied Apr 16, 2014
NZD/JPY bullish crab at 4H supported by SMA200...entered small long
About the course
- Polaris4dy replied Apr 15, 2014
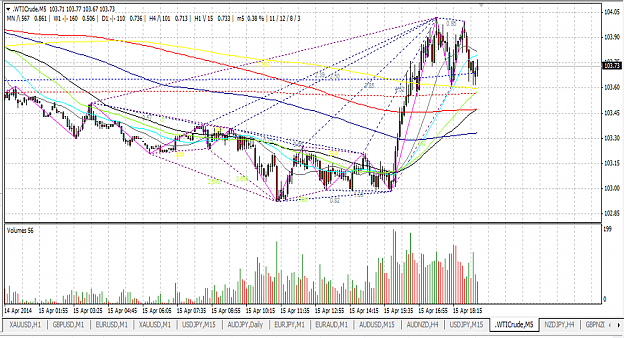
Nice link! more or less it gives a point of view from "big player".....afterall all these seems like a mind game... any opinion on Crude Oil anyone?? it seems like M5 chart shown double top...also, on 1H chart bullish gartley seems to have ...
About the course
- Polaris4dy replied Apr 11, 2014
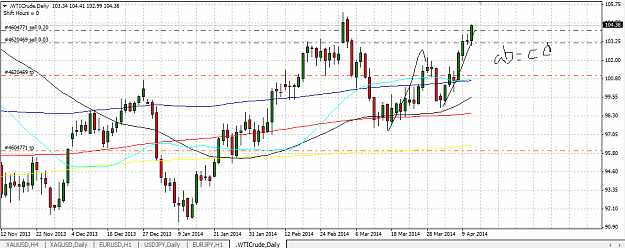
I took a small short on crude oil...daily chart seems like AB=CD + previous resistance..no SMA to support though, that's why small short =D
About the course
- Polaris4dy replied Apr 11, 2014
Great to see all of you here again..I am back! have been suspended for these past few days
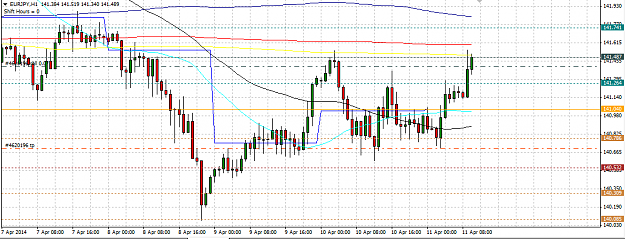
About the course Eur/Jpy is at previous resistance, also SMA400 1H. I have entered a small short here. I will wait until price cross SMA300 to form AB=CD and then bigger ...
- Polaris4dy replied Apr 6, 2014
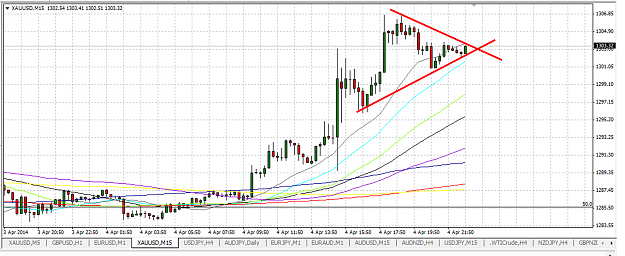
The 1H chart looks more like a bearish bat pattern. 15min chart looks like a triangle...and price is currently at the apex which means it will goes sideway for a while...maybe.. but on the week open normally it will either gap up or gap down
Only Gold! I'm ...
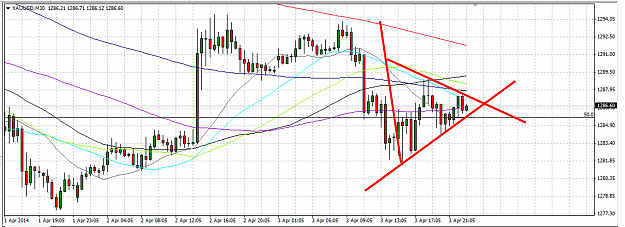
- Polaris4dy replied Apr 3, 2014
Hi Nitsan, in gold 30min chart, can I consider this as a pennant? it doesn't look too good Thanks!!
Only Gold!
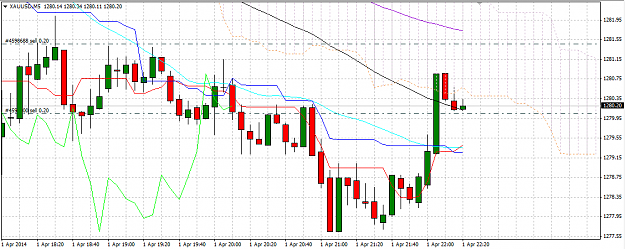
- Polaris4dy replied Apr 1, 2014
price testing previous support turned resistance (1280). plus ichimoku cloud on the 5M chart. I am holding my short a while longer..
Only Gold!