- Search Metals Mine
- 22 Results
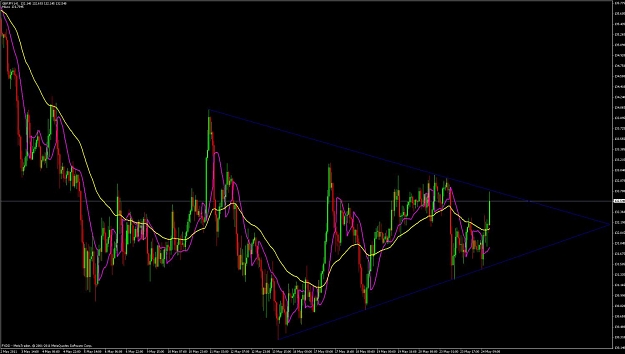
- Pipsqueak replied May 24, 2011
I'm paying very close attention to this wedge.
Auslanco - GBP/JPY and GBP/USD (newstrade)
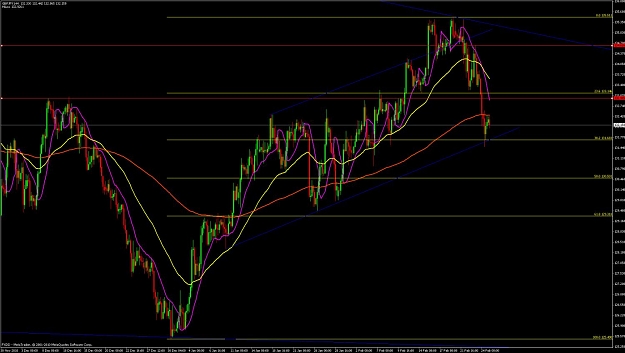
- Pipsqueak replied Feb 25, 2011
4h-channel so I'm long targeting 134 area.
Auslanco - GBP/JPY and GBP/USD (newstrade)
- Pipsqueak replied Jun 11, 2010
The yellow trendline is the key area I'm looking at. A daily close below 132 would put GJ in an extremely bearish mode with bear in complete control as a daily close below this level will have broken many strong supports such as the daily gann and ...
Auslanco - GBP/JPY and GBP/USD (newstrade)
- Pipsqueak replied Jun 10, 2010
I see price falling to this red trendline where I will buy again for another 100 pips move. That seems to be all GJ will at a time these days. Just taking what she gives. Hourly chart has been making higher lows ever since 130.40 so GJ is "creeping ...
Auslanco - GBP/JPY and GBP/USD (newstrade)
- Pipsqueak replied Jan 8, 2010
Bad NFP simply provided the dip to bring in more buyers for GJ. It's amazing how price stopped right at the pip on the trendline. As long as this blue trendline holds, my target of 151.50 still stands.
Auslanco - GBP/JPY and GBP/USD (newstrade)
- Pipsqueak replied Jan 5, 2010
Looks like TL is holding. Could be heading back up to 151.60 area from here.
Auslanco - GBP/JPY and GBP/USD (newstrade)
- Pipsqueak replied Dec 22, 2009
UJ is getting ever so close this daily UTL. Maybe one more burst up to 92.30 and then back down. GU broke 1.5950 support so it could be heading down as low as 1.57. I'm favoring GJ bear right now. But I'll wait for some signs of weakness in UJ or GJ ...
Auslanco - GBP/JPY and GBP/USD (newstrade)
- Pipsqueak replied Nov 27, 2009
Yes trend is still down on the weekly and daily. This is a retracement. But a "retracement" with GJ is still a very large move. Possible short area at the broken blue daily trendline.
Auslanco - GBP/JPY and GBP/USD (newstrade)
- Pipsqueak replied Nov 27, 2009
Thanks. @Rgitt05 I trade pretty much naked with very few indies. Just a gann line, ema50, and trendlines so not sure if my charts will help much. Much of my analysis comes from just chart watching. I just look at what happened every time a trend ...
Auslanco - GBP/JPY and GBP/USD (newstrade)
- Pipsqueak replied Apr 28, 2009
If the upper trendline (blue) holds, then GJ could still falls back down to the low again. But if it breaks, then it will head much higher because this upmove is also a bounce from the daily trendline. Bounces from the daily trendline can result in ...
Auslanco - GBP/JPY and GBP/USD (newstrade)
- Pipsqueak replied Apr 15, 2009
I have a key trendline there (chart). Also, 4H gann is at around 148.30, so a close above 148.60 would make 150/151 possible. Price needs to stay above the daily pivot (147.87) for the bull to continue. Price closes back below 147.87, it's possible ...
Auslanco - GBP/JPY and GBP/USD (newstrade)
- Pipsqueak replied Apr 6, 2009
If today's candle closed below 149.50, it would form a very nice pinbar on the daily. Last time this happens down at the lower daily trendline, price has climbed from 135.60 to 151.50. If today's close at around 149.50, I would short and target the ...
Auslanco - GBP/JPY and GBP/USD (newstrade)
- Pipsqueak replied Apr 6, 2009
This trendline is being strongly tested. It seems the bulls are not backing off. But I do not want to take new long here at 151. If it breaks and flies to 155 or higher then so be it. These trendlines are ususally pretty strong levels.
Auslanco - GBP/JPY and GBP/USD (newstrade)
- Pipsqueak replied Apr 5, 2009
Price is getting extremely close to this upper daily trendline at aroung 151 area and momentum is still strong. Just because price reaches a trendline does not mean it will bounce. There will be some resistance at 151 but we have to observe the ...
Auslanco - GBP/JPY and GBP/USD (newstrade)
- Pipsqueak replied Mar 27, 2009
Price should be heading back up to the top of this channel, which is about 142ish.
Auslanco - GBP/JPY and GBP/USD (newstrade)
- Pipsqueak replied Mar 25, 2009
Battle of the pivot. So far still no hourly candle closed below the daily pivot. It seems there are still plenty of buyers and they step in usually near the end of the hourly candle. If hourly closed below the daily pivot, it would so the buyers ...
Auslanco - GBP/JPY and GBP/USD (newstrade)