- Search Metals Mine
- 31 Results
-
 PipCop replied Jan 13, 2015
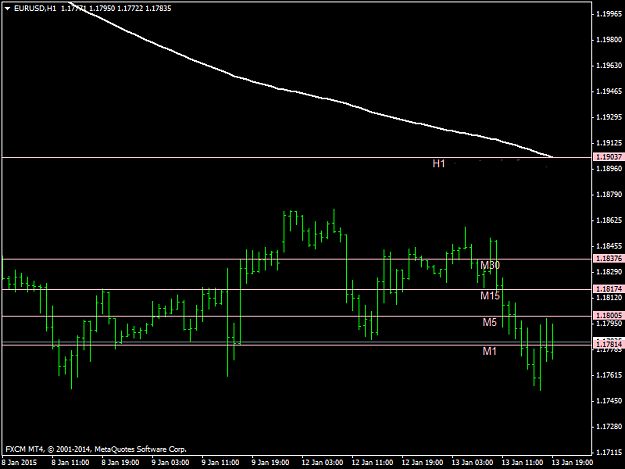
Hello, Looking for this indicator, a 200ema showing the placement of the 200 on the 1,5,15,30, 1hr, 4hr on same chart, would prefer an mq. file should one have it in there collection. Tks PC
I will code your EAs and Indicators for no charge
- PipCop replied Dec 12, 2014
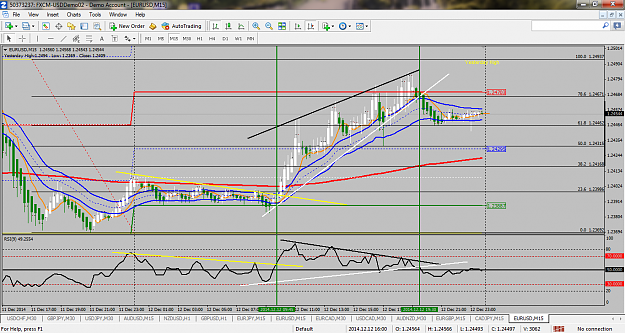
This may help the new people on the block, Trend Lines......Lines are color coded with the RSI so that you can see how beneficial the RSI comes into play S/R and FIbs Watch how Price reacted as it moved up to the 50% level stalled,consolidated, then ...
Magic 5 - five pips only
- PipCop replied Sep 4, 2012
Congratulations to all team members of Genisis matrix. Job well done. I wanted to share a chart to show how one could be caught in the middle of a trade without first looking to see where all our pivots, ma, s/r, whatever one is using before placing ...
Genesis Matrix Trading
- PipCop replied Aug 31, 2012
Hello Traders, Long before the "trading made simple" thread was started our charts looked just as you see here. Big E took this a step further and eliminated a few things and ventured onto the higher TF. I still incorporate the indicators and mas ...
Trading Made Simple
- PipCop replied Aug 28, 2012
Excellent Thread — Hi Hugh, I have read through the thread and your pdf file on swing trading. Very well put, I prefer the Heiken Ashi also, eliminates a lot of noise. I wish I had the opportunity to trade the London open and US session. The ...
Swing trading with heiken ashi and stochs
- PipCop replied Nov 8, 2010
Conservative Trading — Big E has shown the use of the AO and Osma. As you look back you can see how this applys when using the 21 & 233 stratergy. Safe trade when in agreement, the aggresive approach using the TDI and Osma. As you can see , ...
Craig Harris Stochastics Method
- PipCop replied Nov 2, 2010
To the downside — One more chart showing trades going to the downside using the TDI
Craig Harris Stochastics Method
- PipCop replied Nov 2, 2010
TDI — Hello Big E, great posts and charts. The TDI offers many other ways to use this indicator. Plotting tred lines from higher highs to lower highs with a break of that line with green over red ,along with showing divergance. I have included ...
Craig Harris Stochastics Method
- PipCop replied Oct 25, 2010
Your trade — This should clarify things for you
Craig Harris Stochastics Method
- PipCop replied Oct 25, 2010
HA vs Candles — Here are two charts one with candles and the HA. The candles shows a big gap on Sunday when the market opened, the Ha is showing a long white candle. Anytime the market gaps like that it will eventually fill before price ...
Craig Harris Stochastics Method
- PipCop replied Jan 5, 2010
Todays Recap — This is a recap of how I traded the E/U. From the black dotted line are four swings that I entered and exited using CH method. The first trade just above the big# and set my TP at the next big #1.4450 +25. Next trade was a break ...
Craig Harris Stochastics Method
- PipCop replied Dec 31, 2009
TDI cross over — You are correct but it does not happen all the time. Look at the candles on the first trade and second one. The run down prior to the first trade the TDI ran through the band and crossed back up. The reversal candle is in ...
Craig Harris Stochastics Method
- PipCop replied Dec 31, 2009
Re-entrys — The more you watch the videos on craigs method, you will learn something new. He uses the big and mid range numbers to enter or exit with stochastics in agreement. The chart I have posted the big and midrange are plotted in yellow. ...
Craig Harris Stochastics Method
- PipCop replied Dec 30, 2009
Tokyo Channel — This should explain what Craig is talking about on retracements
Craig Harris Stochastics Method
- PipCop replied Dec 30, 2009
BRAVO — Big E I could'nt resist adding this picture, well spoken on your post.
Craig Harris Stochastics Method

- PipCop replied Dec 16, 2009
Correlation between EUR/USD and USD/CHF — The correlation between these pairs is interesting to watch. Should you be in a trade ie: long the EUR/US then take a short on the US/CHF and vice versa for a short on EUR go long on the CHF. The ...
Craig Harris Stochastics Method
- PipCop replied Dec 16, 2009
Convergance and Divergance — Hello All, Big E I will definitly respect your wishes on that. I am in agreement with you on the 5min charts. Swings and candles are much smoother. The rules stay the same. I am a big fan also of the Heiken Ashi ...
Craig Harris Stochastics Method
- PipCop replied Dec 14, 2009
Asian Session Indicator — I have viewed the Tokyo Channel several times and Craig mentions the start of the Wellington New Zealand Session. This would be 15:00 hrs or 19:00 hrs GMT. ( The MT4 charts are plotted in GMT.) The next vertical line ...
Craig Harris Stochastics Method
- PipCop replied Nov 18, 2007
Channels — Here is a 1hr chart showing price moving within the channel, once price violates either the upper or lower this will give you the direction of where the market is headed next. Used on any TF
Simple Method of Scalping any pair on 5 min chart , specially GBP/JPY - by Imran Sait
- PipCop replied Nov 17, 2007
The first chart posted is a 5min, this is the 15 min. I added the fib levels to show the retracement , mkt retraced .38.2% before resuming upwards. The first lag shows entry everthing in agreement, 2nd lag still climbing. Markets will always retrace ...
Simple Method of Scalping any pair on 5 min chart , specially GBP/JPY - by Imran Sait