- Search Metals Mine
- 13 Results
-
 Orly replied Mar 24, 2023
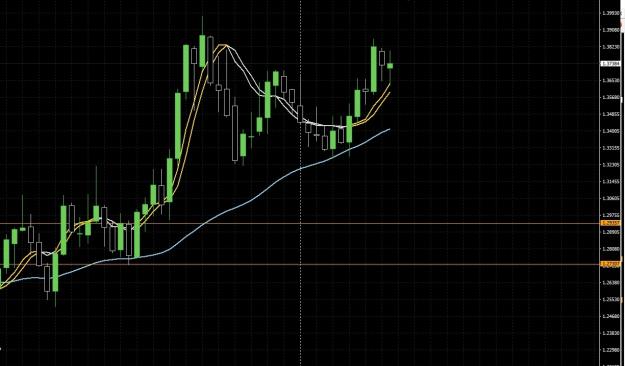
Sure. Mesa just means "table" in Spanish. In a Mesa, there comes a top, some sideways action that can look a number of ways, and then a return to the other "leg" of the table. USDJPY can be seen going straight across, like a true table. Other ...
USD/CAD
- Orly replied Feb 4, 2016
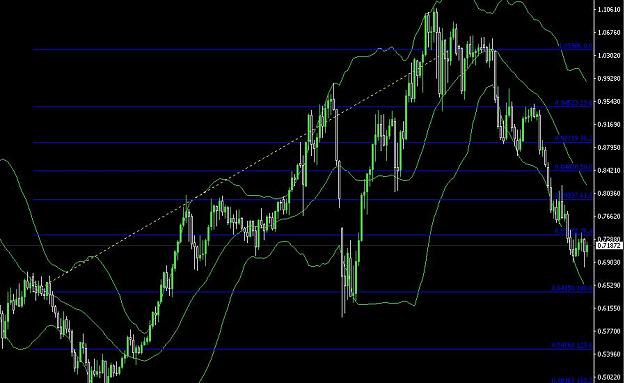
Fibonacci levels are places on the price map where traders feel most comfortable. These are price regions where the most traders are "happy" with the price. Most traders will place Fibo levels incorrectly, however. The tendency is to place the Fibs ...
Where is the logic behind applying Fibonacci to trading?

- Orly replied Nov 12, 2014
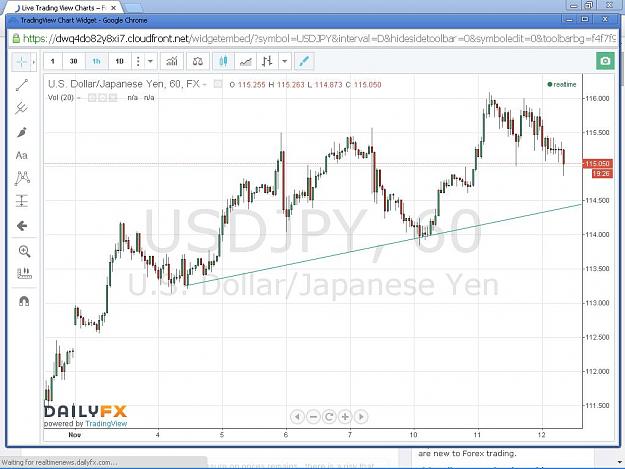
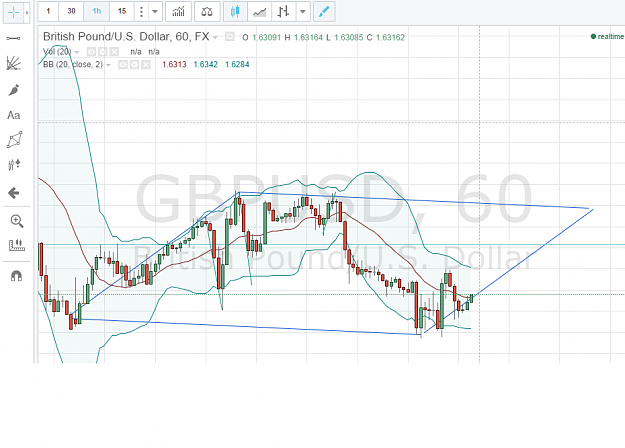
The first test will be the rising trendline. The second test will be the gap. There is an open Fall Line at about 108.9. url
USD/JPY Discussion
- Orly replied Sep 26, 2014
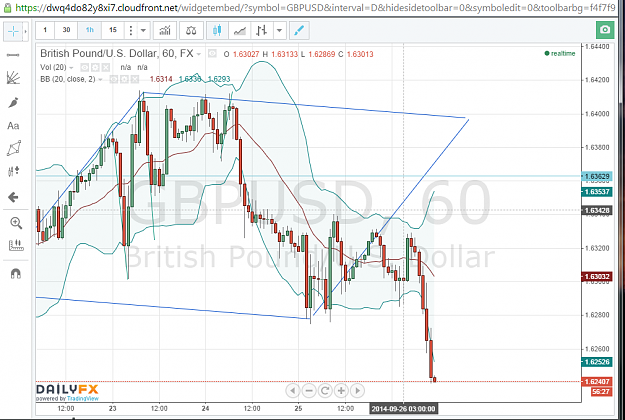
So has my intuition proved wrong (again...)? image A few questions about it, if you don't mind... Would this move, supposing you got in when I posted the initial pic, have triggered your mental stop-loss and would you have killed the trade? You ...
Funny Looking Rectangles & Useless Drivel
- Orly replied Sep 25, 2014
image Intuitively, this is where I would draw the funny-looking rectangle.
Funny Looking Rectangles & Useless Drivel
- Orly replied Oct 16, 2013
DollarCHieF is breaking back to the upside inside a long Weekly channel. image Upside target is 0.994 as the Swissie takes it on the chin in this round of "Keep the DXY Steady, Please."
USD/CHF
- Orly replied Dec 30, 2012
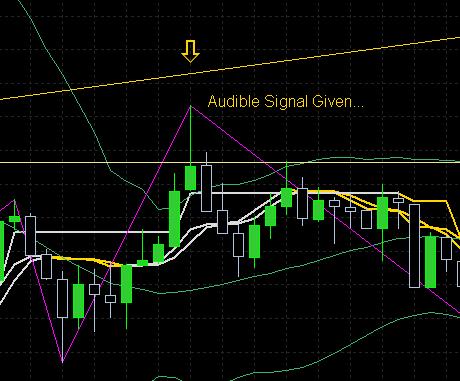
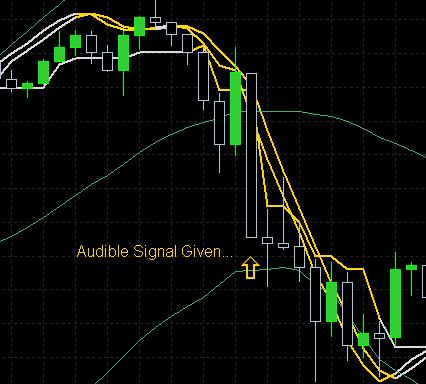
Happy New Year! Is there an indicator that can give an audible alert when either: The price breaks 3-pips or more below or above the Bollinger Bands, or The candle is more than twice the size in total pips (including wicks...) as the previous four ...
I will code your EAs and Indicators for no charge

- Orly replied Dec 29, 2012
Happy New Year! Is there an indicator that can give an audible alert when either: The price breaks 3-pips or more below or above the Bollinger Bands, or The candle is more than twice the size in total pips (including wicks...) as the previous four ...
Will code profitable EA's for free


- Orly replied Dec 23, 2012
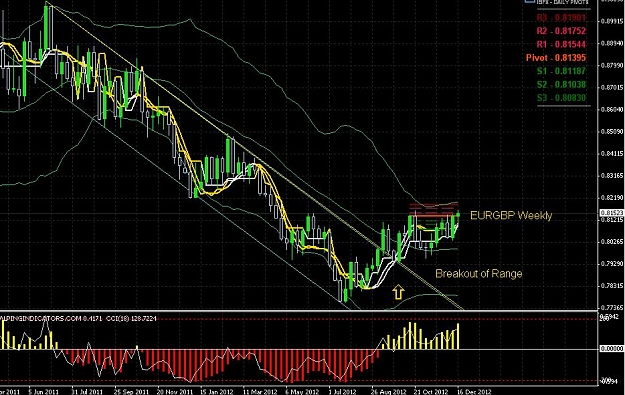
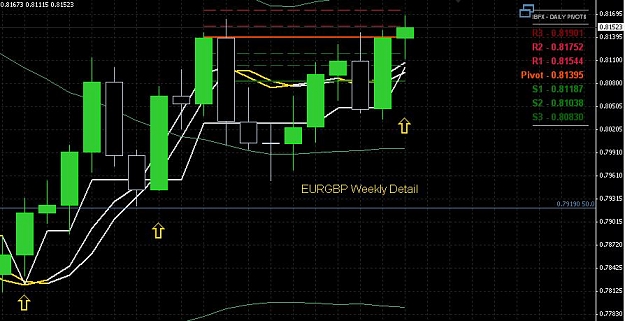
Mayyyybbeeee... Bert, the Weekly Chart shows a distinct break above a down channel. Now, this is not to say that the pair shouldn't retrace to reload a bit. I have it lower to the Daily Pivot at ~0.8140 before it continues higher. Watch for the ...
EUR/GBP - What a great pair to trade!
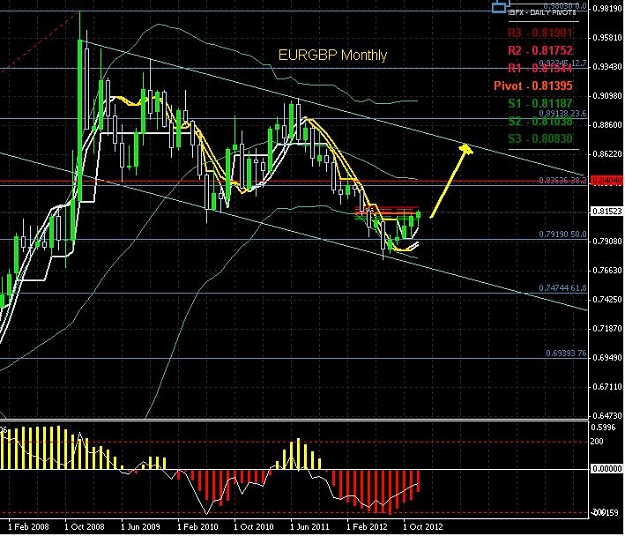
- Orly replied Dec 23, 2012
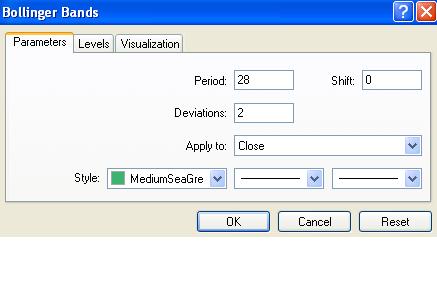
It looks like the pair has bottomed on the Monthly chart and is rising back through the down-channel. Look for a stall or a reversal near the red-line or to the middle Bollinger Band (28, 2, 0...), which also corresponds to a long-term Fibonacci ...
EUR/GBP - What a great pair to trade!
- Orly replied Nov 27, 2012
Watch the completion of the cup with handle for a bounce higher or failure...
EURUSD
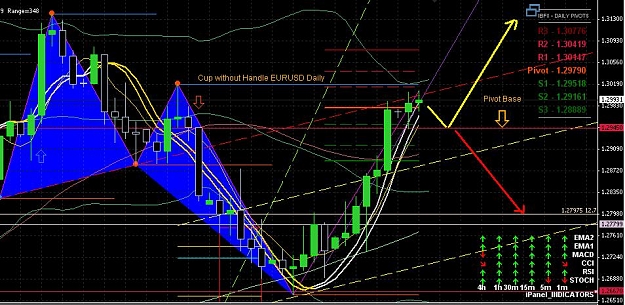
- Orly replied Nov 27, 2012
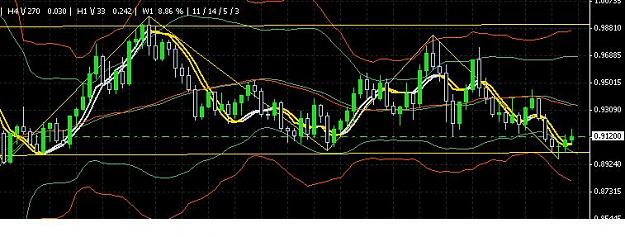
There is a cup with handle pattern forming on the EURUSD H4. The cup has formed but the handle has not yet. Look for a retracement to the Daily pivot. A strong break below 1.2945 will signal a failure of the coninuation pattern. A break back above ...
EURUSD

- Posts by Member Search: 'Orly'