- Search Metals Mine
- 68 Results
-
 Now replied Feb 22, 2011
See attachment, updated version, works flawless on my MT4 platforms.
FF Calendar Indicator for MT
- Now replied Sep 13, 2010
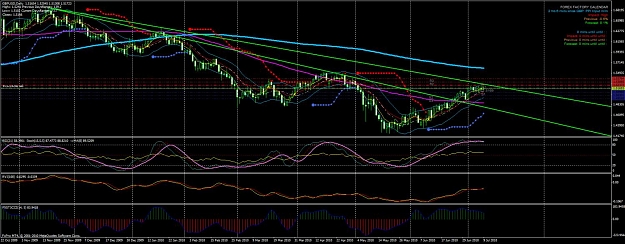
Continuation of last weeks consolidation, keeping the door wide open for strenght to come. Pair is lagging on todays risk taking. url 60 DMA is crossing up 200 DMA on daily chart. Consumer date and CPI data tomorrow might prove essential for a ...
Cable Update (GBPUSD)
- Now replied Sep 9, 2010
More consolidation before re-test of 1.6000 levels? 60 and 200 DMA providing solid support zone. RSI hovering around 50 and stoch crossing up from under 20. See chart.
Cable Update (GBPUSD)
- Now replied Aug 14, 2010
Possible bottom formed this week at 84.72. Trendline down originating from the highs of May 5th at 94.97 needs to be broken to confirm this view, currently around 86.50-60. Price allready closed above 33 and 60 DMA on 4 hour chart. Went long one ...
USD/JPY Discussion
- Now replied Jul 13, 2010
Only real charts tell the story and are helpfull to others. Retrospect? The charts I post are real-time and I put my own money on the line on every trade that I post. What about you? Back to the business: SL moved to 112.45 to lock in additional ...
EUR/JPY Anytime!
- Now replied Jul 13, 2010
Went long at 111.78 with two lots, SL moved to 112.10 to lock in profit Asian session should pick up with "clues" from NY session. See this baby at 115.80 by weeks end.
EUR/JPY Anytime!
- Now replied Jul 9, 2010
One thing that has me concerned since this call, S&P and DJ futures are not giving in yet. We sure see a home-runner once they tumble.
Cable Update (GBPUSD)
- Now replied Jul 9, 2010
Same here, still holding one lot short from 1.5180 with SL moved to 1.5130. Clear trendline rejection on daily.
Cable Update (GBPUSD)
- Now replied Jul 9, 2010
Yeah, but it sure took some time before the bull threw in the towel.
Cable Update (GBPUSD)

- Now replied Jul 9, 2010
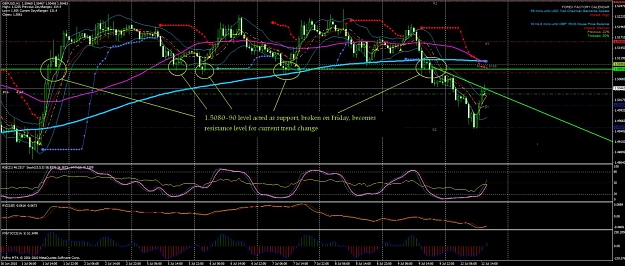
Short, cable 1.5180 SL 1.5245 USD Index bouncing at 61.8 Fibonacci (see daily USDX chart). Cable at upper trendline resistance (see daily chart). Bad GBP fundamental data the whole week. See charts. Have a good one. Cheers.
Cable Update (GBPUSD)
- Now replied Jul 8, 2010
Dollar Index - Fibonacci — Dollar Index nearing 61.8 retrace on daily chart. Correction over? Turning point ahead? Potential set-up is indeed forming. Cheers.
EURUSD
- Now replied Jul 7, 2010
Looks more like a backpacker going south. Short 1.5190 with SL at 1.5210.
Cable Update (GBPUSD)
- Now replied Jul 7, 2010
Short two positions at average of 1.2564 with SL at 1.2590. First target for lot 1 at 1.2520.
EURUSD
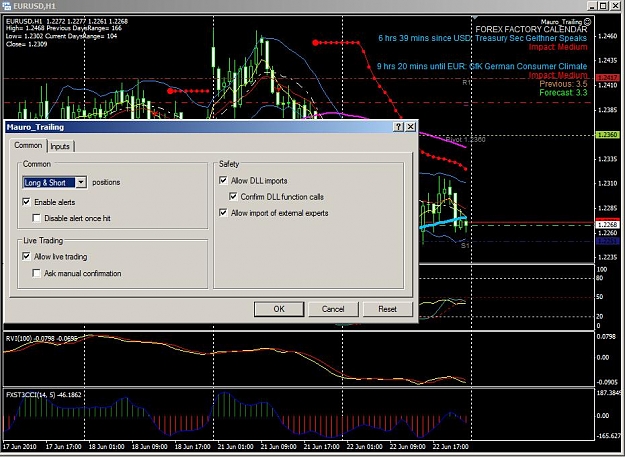
- Now replied Jun 22, 2010
You are right that is it. Have pasted it into experts. Am testing it on demo 4 digits broke'r. We will have to add an extra 0 for 5 digtis broker in the settings, will test as well. Looks promising as a tool to auto-add TP and SL and trail ect. Have ...
EURUSD
- Now replied Jun 22, 2010
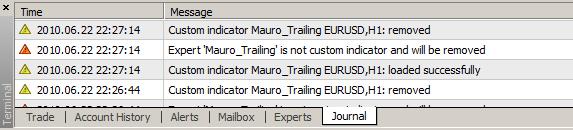
I am getting this error whiles loading the ex to my chart, any idea?
EURUSD
- Now replied Jun 22, 2010
S&P and DJ taking a beating. Received some technical analysis/predictions this morning that we might soon see another drop in the DJ to 9.000 (a drop that we experienced on May 6th) before a skyrocketing recovery to 14.000... . With the EUR/USD ...
EURUSD
- Now replied Jun 18, 2010
It is clear who is next in line, but only the market will determin when and how (source Scotia Capital):
EURUSD
