- Search Metals Mine
- 18 Results
-
 Noloqy replied Dec 21, 2011
I think you interpret it differently than I intended. What I tried to say is: image Note that n is countable. The intuition is as follows: If you have even a negative expectancy, if you trade long enough, there is a 100% chance that you won't end ...
Do you guys find that forex trading sucks?

- Noloqy replied Dec 8, 2011
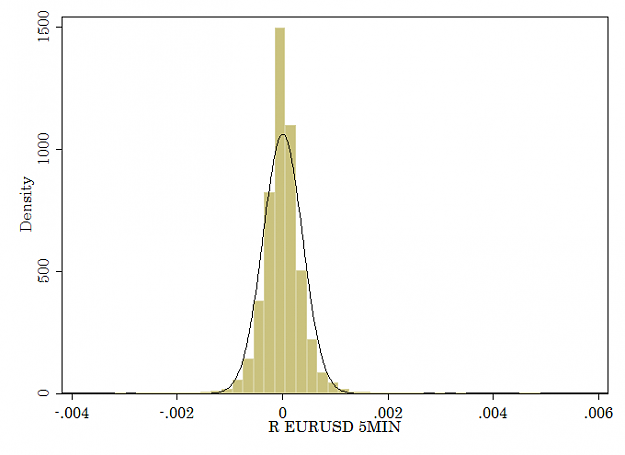
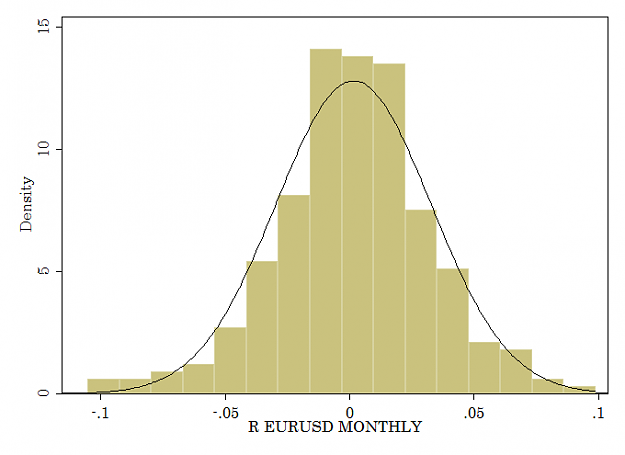
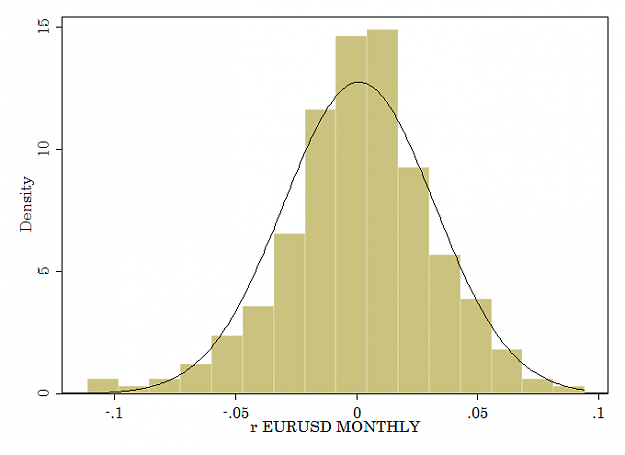
I just did some quick tests. Monthly returns go back to 1990; 5 minute returns go back to Jan 2011. Of course, one could object to that, though I believe the results hold in general. Considering the log returns in more detail: 5 minute: 11471 obs; ...
Market facts

- Noloqy replied Jun 15, 2011
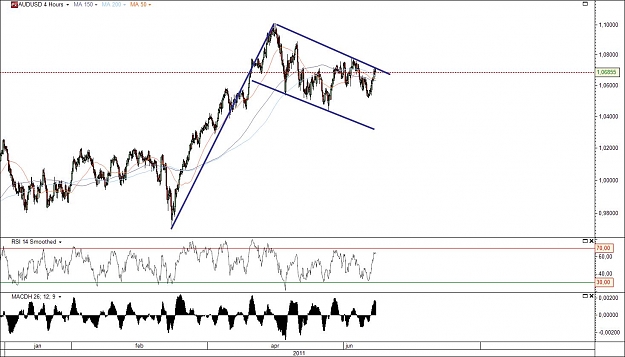
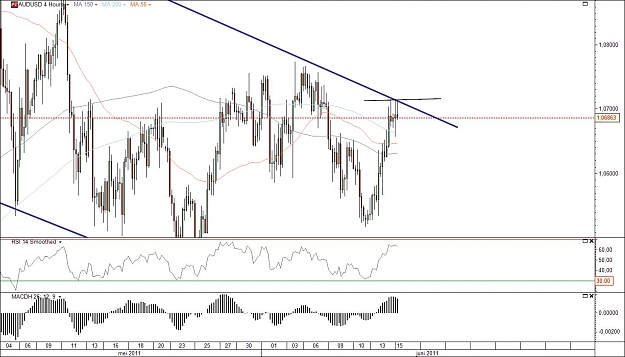
What do you think of this AUDUSD flag? If the inside bar develops I might be interested in this trade, especially since it coincides with my fundamental view on these currencies.
Silent Service Method
- Noloqy replied May 19, 2011
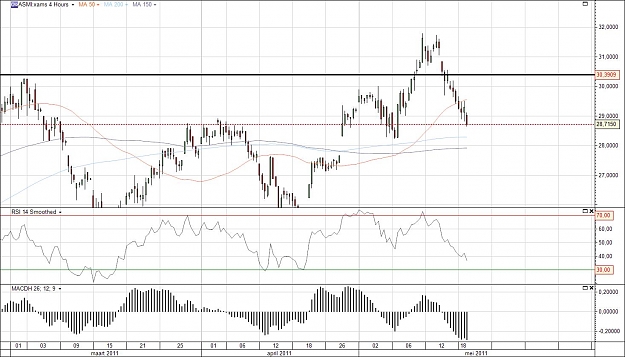
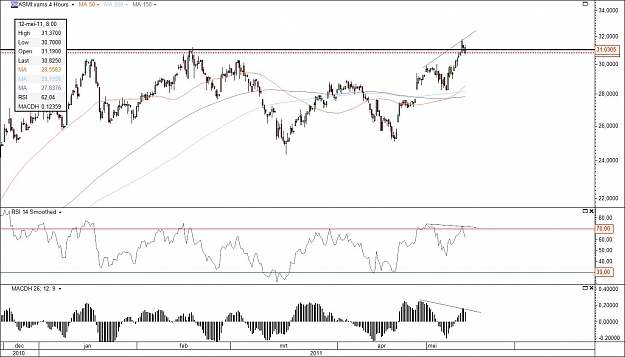
Following up on the earlier post, the price of ASMI dropped (as did the entire stock index
Silent Service Method .) Anyway, now we're at ~1.2 RR.
- Noloqy replied May 12, 2011
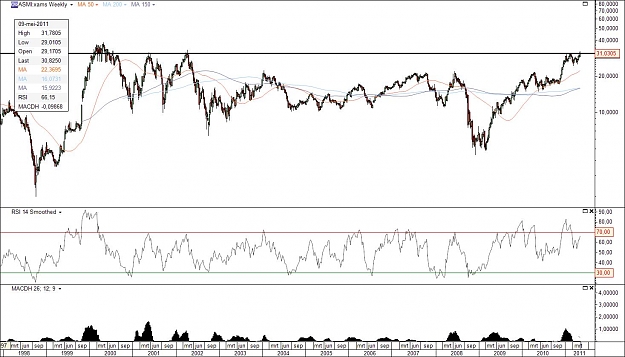
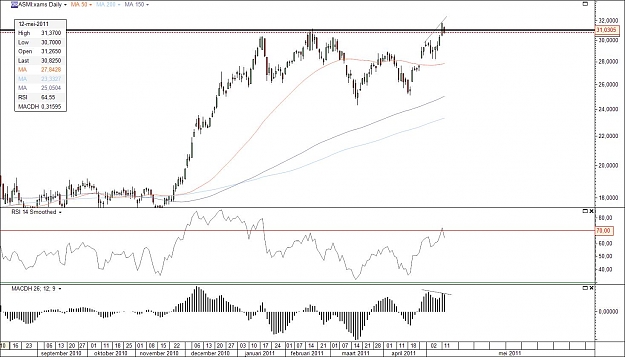
Clockwork and others, please have a look at the following charts. Different timeframes of a Dutch company called ASMI. I feel that if this daily bar remains an inside bar, there is a golden opportunity to short if it breaks below the previous day's ...
Silent Service Method
- Noloqy replied Dec 9, 2010
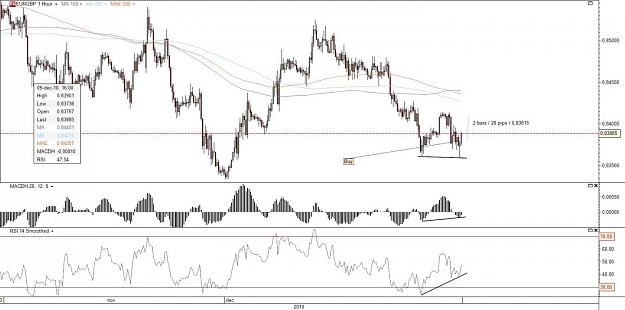
Short term EURGBP long. ~1:1 RR target. Too bad I missed it.
Silent Service Method
- Noloqy replied Jul 8, 2010
I also thought about this, and indeed you overcome certain problems. If you define the local extreme in a 24 hour domain, so that you compare it to the 12 hours preceding and the 12 hours following the bar, I still expect to see more extrema ...
Systematic trading
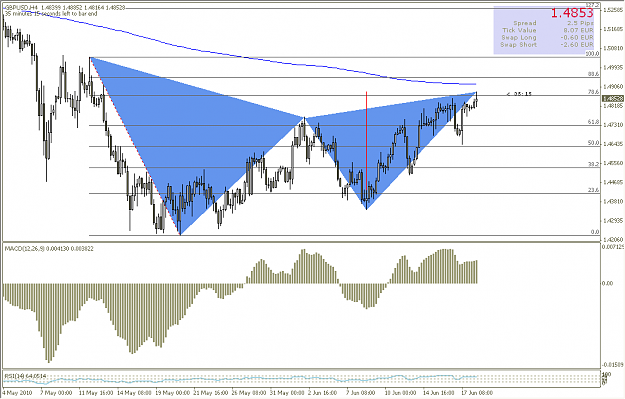
- Noloqy replied Jun 18, 2010
I was looking at the GBPUSD chart, and noticed another butterfly pattern forming. It has been quite a choppy pair lately, but if I get a nice PA signal I might short it.
Silent Service Method
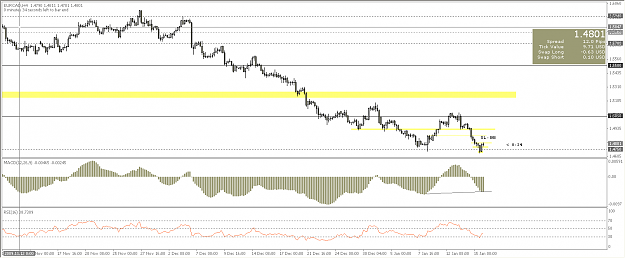
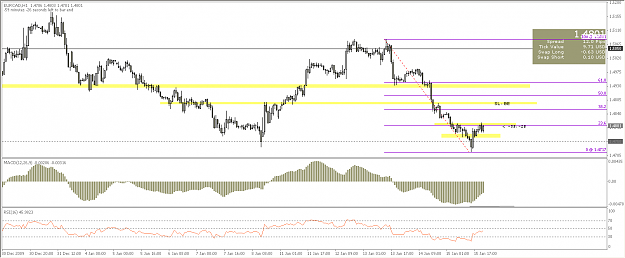
- Noloqy replied Jan 16, 2010
Hey guys, It has been a long time since I last posted here, but I've been busy with many other things. Today I decided I wanted to get back in the game, and started scanning the charts again. The first pair that caught my attention was EURCAD. It ...
Silent Service Method
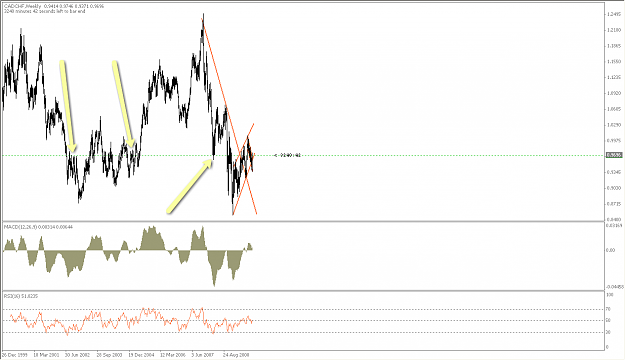
- Noloqy replied Oct 1, 2009
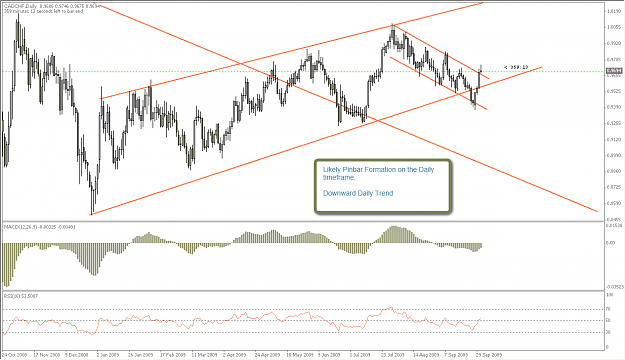
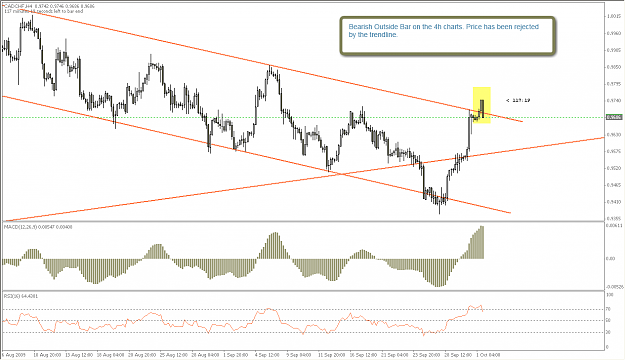
I took a CADCHF short, and am hoping for the best. What I love about price action, is that it CAN be somewhat reinforcing if you look at multiple timeframes. In the charts posted below, I see that there is a BEOB being developped. I also see that if ...
james16 Chart Thread
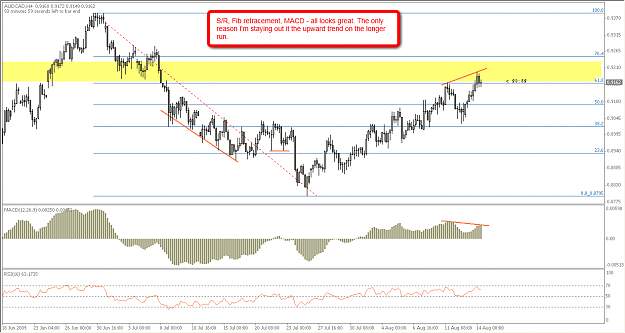
- Noloqy replied Aug 14, 2009
You often see people posting possible trades on very similar pair. For example one posts a EURJPY and another posts a USDJPY trade. If one shows a pinbar, chances are great the other does as well. This time I'll post an AUDCAD chart, somewhat ...
Silent Service Method
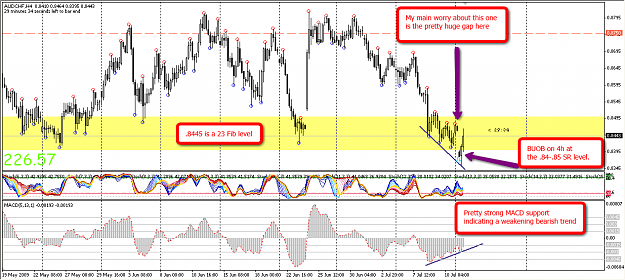
- Noloqy replied Jul 13, 2009
Hey guys, have a look at this one... Pretty interesting trade - my only worry is the gap. I'm betting on the bulls.
Silent Service Method
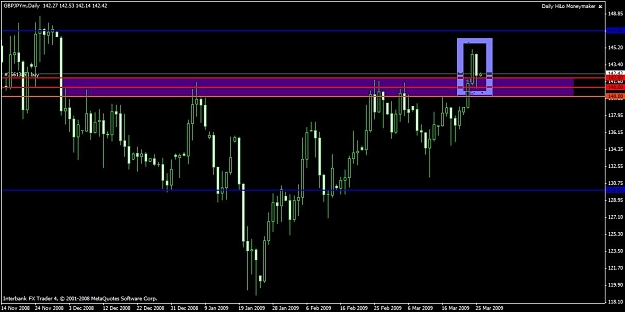
- Noloqy replied Mar 29, 2009
Hi nebuman, When I initially looked at the daily chart you posted, I noticed the 2 daily bars (see attachment). It's not exactly a BEOB, but those two bars together form a pretty decent pinbar if you ask me. Maybe this could have been an indication ...
Silent Service Method
- Noloqy replied Mar 13, 2009
Might be a nice opportunity. edit: hmm now that I look at it again the outside bar (bar before the current bar) would suggest a continuation down if I'm interpreting it correctly. In this case it might be better to wait for more bullish ...
Silent Service Method
- Noloqy replied Mar 11, 2009
I decided to go short on the CHFJPY. Found a daily candle that looked like a pinbar around the 85 resistance level.
Silent Service Method
- Noloqy replied Mar 7, 2009
Of course you could be very right. I wouldn't take the trade however. On the smaller timeframes you see price touched the 1.30 zone, then went back to the 1.27 zone and now its moving around 1.28. I'd wait for the price to settle at an S/R zone ...
Silent Service Method
- Posts by Member Search: 'Noloqy'