- Search Metals Mine
- 45 Results (2 Threads , 43 Replies )
- Where the Opportunities ExistStarted Oct 11, 2016|Commercial Content|46 replies

Where the Opportunities Exist {image} Problem Do you struggle to see the opportunity for you to ...
-
 Neio replied May 25, 2016
Here is a big idea but probably unpopular idea to successful trading... Less is More We are told that we need more information or data (backtesting) and the computation of that data (indicators, analysis) will enable us to make better predictions or ...
What are the big Ideas in successful trading?

- Neio replied Oct 17, 2015
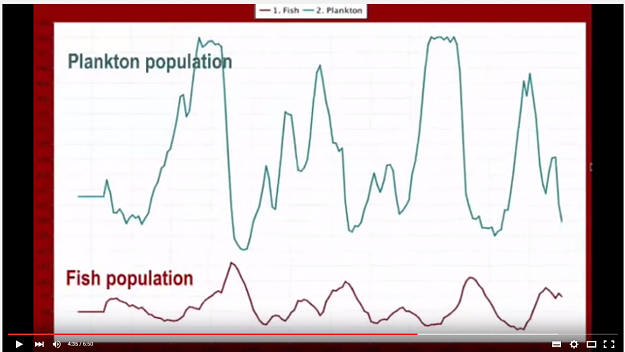
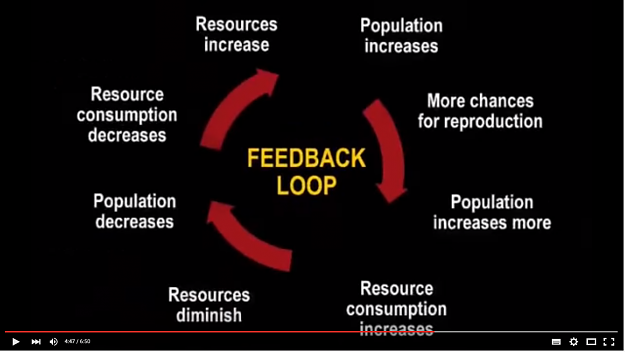
Excellent videos Tashkent, many thanks for sharing. I particularly liked these sections in the first video: image image Even though it is a complex system there is a bit of predictability in the relationship between the fish and the plankton. ...
Forex Trading Philosophy
- Neio replied Sep 23, 2015
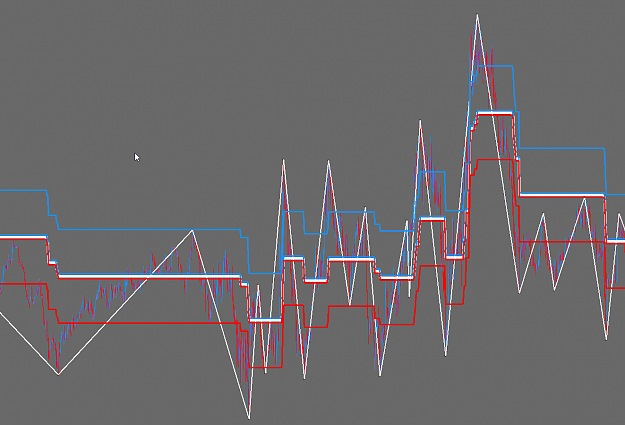
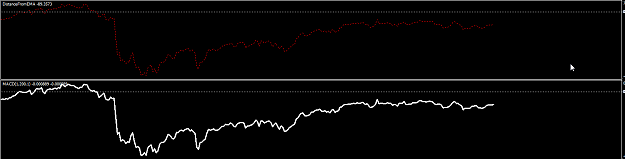
Hi Matheszabi, You know you can just configure the standard MACD to do the same as that indicator right? However I believe you are on the right track. image To be honest I am not surprised that you got no replies to your opening post as what you ...
Uptrend, Ranging or Downtrend?
- Neio replied Apr 3, 2015
Contrary to what you might think, I did share more than a quote and a nice looking equity curve. For me on this forum we have to accept that because of the way the world is there will be things that people discover that they will want to keep to ...
Higher Edge within a Single Candlestick
- Neio replied Apr 2, 2015
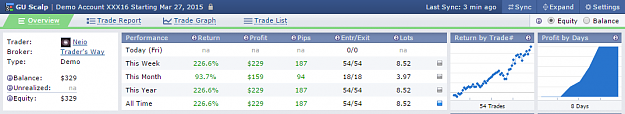
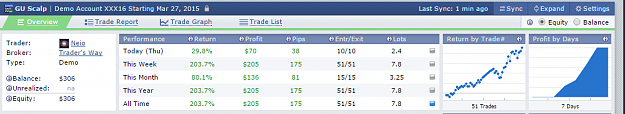
Hmmm... I think I have posted everything I wanted to share so far. I decided to remove my demo explorer but just for your info it is still doing just fine... image I think I may just abandon it now anyway as it serves no real purpose other than ...
Higher Edge within a Single Candlestick
- Neio replied Mar 31, 2015
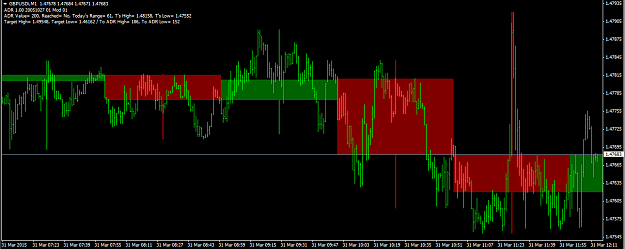
Armed with my intimate knowledge of 1HR GU candles I also like to know what is happening under the hood. Therefore I have a 1HR candle super-imposed on an M1 chart. This helps me to see the movement within each 1HR candle. image
Higher Edge within a Single Candlestick
- Neio replied Feb 13, 2015
Interesting discussion here and still trying to piece together the crumbs that have been left myself. I believe the point that is being made is that the reference point establishes your bias. If price has moved up from your reference point then you ...
About Candlesticks: Why they were created? What do they reveal?
- Neio replied Jan 10, 2015
The next thing I need to know is how to identify head fakes. Especially when coming out of consolidation. I think this indicator could be a good filter. Will try it out next week. image file I believe it identifies possible head fakes as ...
LFX Trading Proverbs
- Neio replied Jan 9, 2015
Thanks again....starting to see the wisdom in those words. Been working on testing some indicators this week to see how I can get them to show consolidation. Looking good so far.... image My advice for anyone interested in developing your own ...
LFX Trading Proverbs

- Neio replied Dec 28, 2014
The markets follow natural laws (or laws of nature) Part 1 The market moves in waves. Waves or the affect of waves are all around us in nature (sea waves, sound waves, brain waves, light waves? etc). Questions I have sought to answer for myself, "Is ...
Musings on the Market

- Neio replied Dec 28, 2014
The markets are mean reverting The markets do not move up and down in straight lines. The markets move in waves something I would like to expand on in my "market follows natural laws" belief. Even though there are trends the overall market can be ...
Musings on the Market
- Neio replied Oct 28, 2014
Hi Jhlewis, Great looking chart... ...also love this thread and some of the things that I have gleaned from it... Here is my own chart that I have created based on the concepts taught here... image
LFX Trading Proverbs
- Neio replied Oct 26, 2014
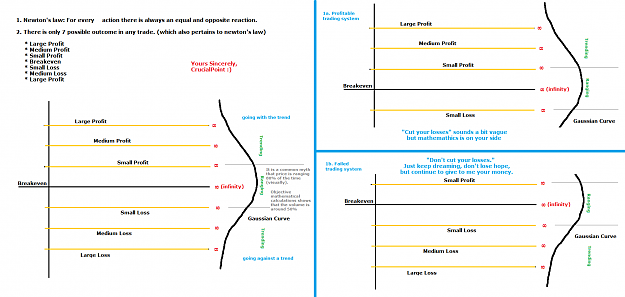
image This has always intrigued me so maybe we could initiate some discussion around this to finally clear this up. I don't have a degree in mathematics or anything like that but have studied these statements. Are we really talking about two ...
The similarity system

- Neio replied Oct 26, 2014
Great posts Rahimseven, However caution must be exercised with that as sometimes there are these rare events. Yes they are rare but could be enough to blow someone's account if their money management is not correct and they have certain ...
The similarity system
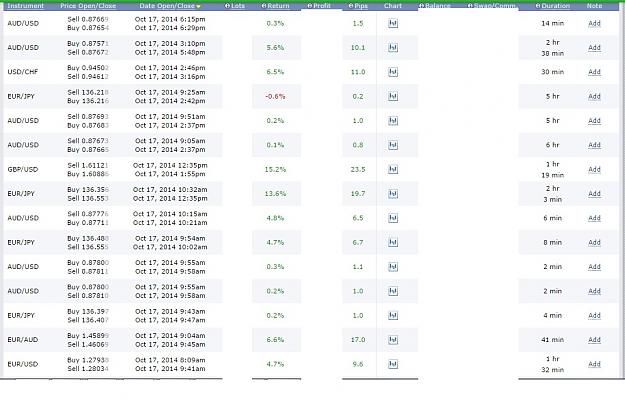
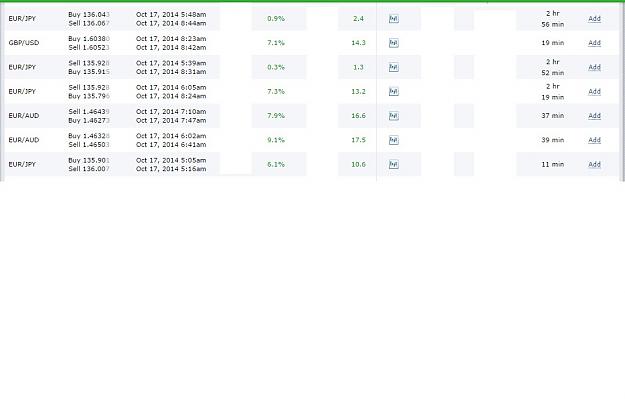
- Neio replied Oct 19, 2014
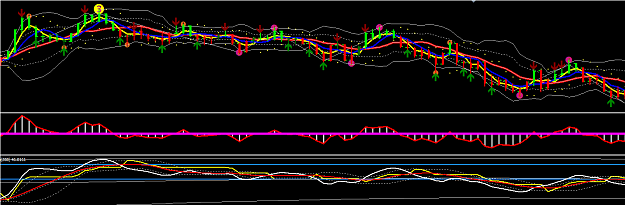
Here are my trades from Friday....using the same concept as Ullen but I have another tool that I use that helps me to time my entry towards targets. It is able to detect exhaustion of short term trends and most of the time is able to get me in just ...
Counter-trend trading
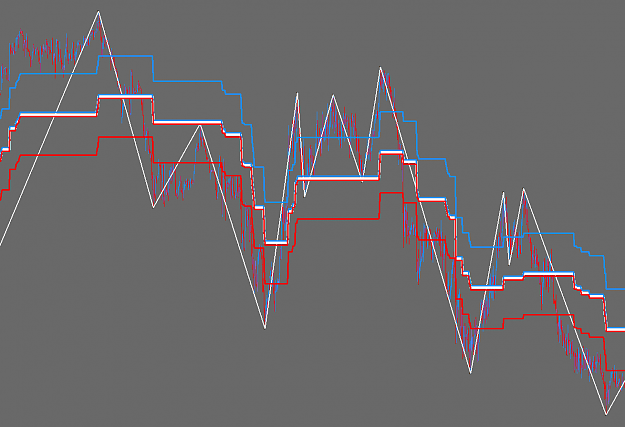
- Neio replied Oct 16, 2014
Still experimenting....EJ m5. Here is an idea for those that want some direction...how about looking at the threads that MM subscribed too? I am not there yet but working hard like a detective slowly piecing things together. image
Counter-trend trading

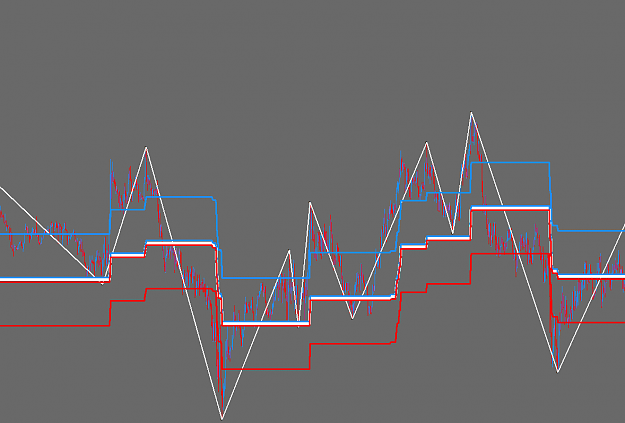
- Neio replied Oct 11, 2014
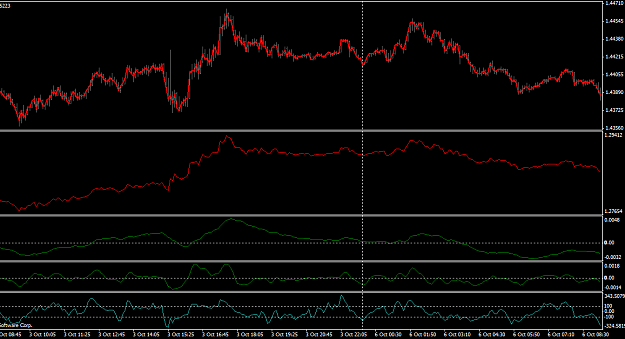
OK I see that KPRSA gave a possible reason in a post that followed. Here is what I have put together so far for EURAUD. Will have to see how this plays out in the real market. I am hoping that it allows me to see the real price or value. Thank you ...
Another Trading Journal
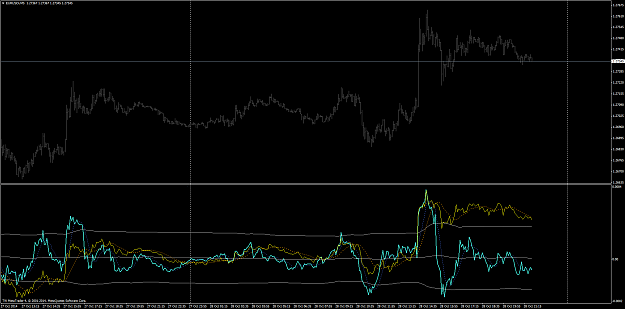
- Neio replied Sep 24, 2014
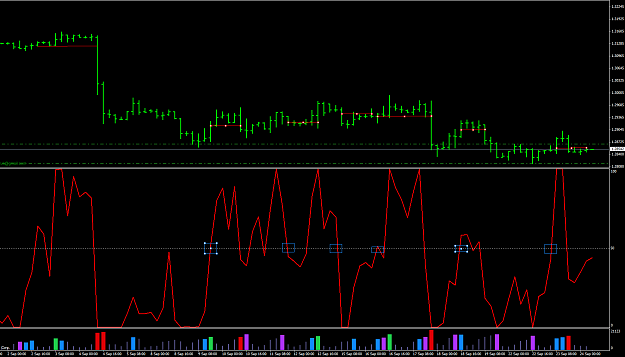
Here is a picture of a chart to show the observation... ...look how with the right stoch setting you can match the 50 levels to the key prices where the market will not tend to close more than 40 pips away before returning.... image
The similarity system
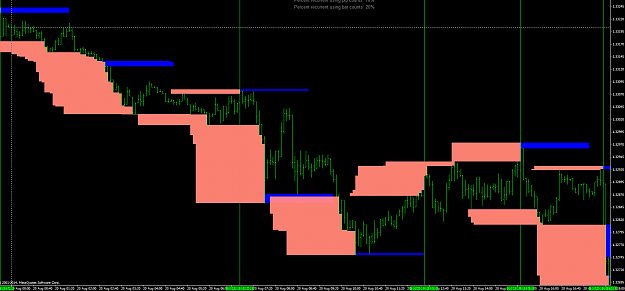
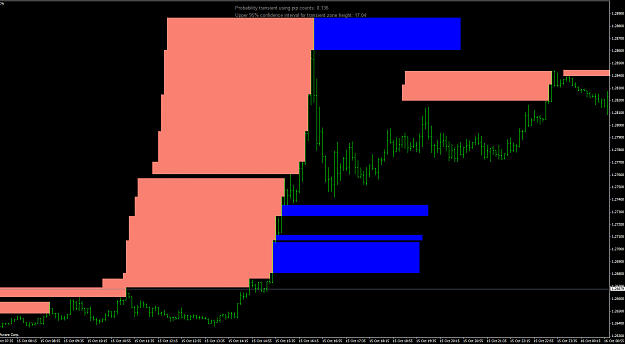
- Neio replied Aug 21, 2014
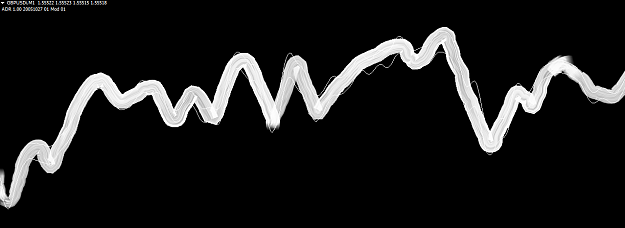
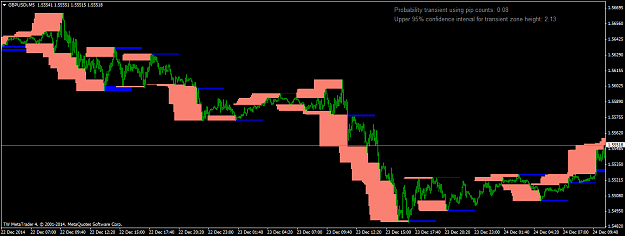
Here is an M5 chart to illustrate the trading with trend "beyond transient zone trades" The white line indicates the daily open. As you can see price is trending down below it. So we only take trades beyond transient zones that will help us to ...
The similarity system