- Search Metals Mine
- 50 Results (2 Threads , 48 Replies )
-
 MoForce replied Apr 27, 2010
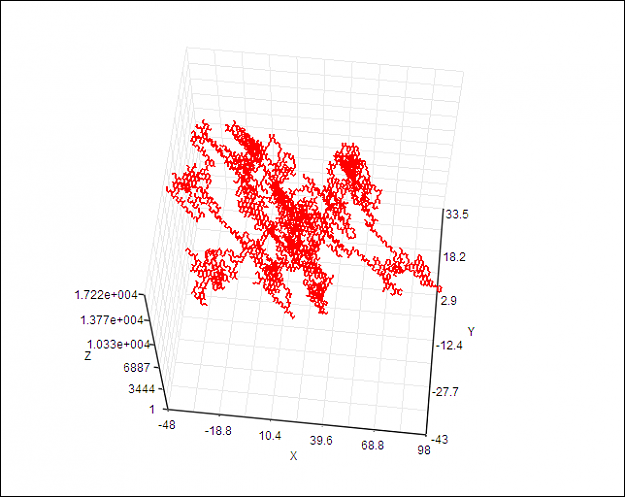
and just for kicks... I did a 3D version of a portion of the network (just a portion so it renders quickly)
Dynamic Multidimensional Arrays
- MoForce replied Apr 27, 2010
Here's a graphical representation of the growing network... it's based on the past 2 Months of 1Min data from G/U If this is not successful I'll be back in a month or two with another crazy idea
Dynamic Multidimensional Arrays so until then...

- MoForce's PwR SystemStarted Jul 19, 2009|Trading Systems|25 replies

PwR System(1.0) - By MoForce I'm introducing a new system I've only recently (yesterday, lol) ...
- MoForce replied Jul 10, 2009
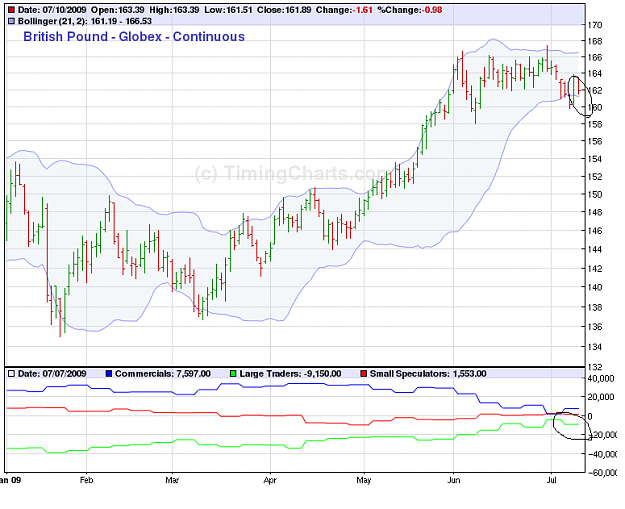
I agree with malcolmb, this recent upward move is just correction. Even the large traders are starting to bet on this going down. check it out
Cable Update (GBPUSD)
- MoForce replied May 11, 2009
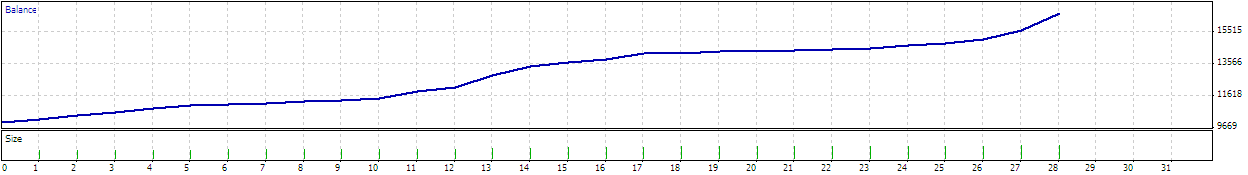
lol I ran the test again and yeah... 90.00% is what I got. For some reason I remembered 91
Looking for high quality tick data for MT4 (broker:IBFX)
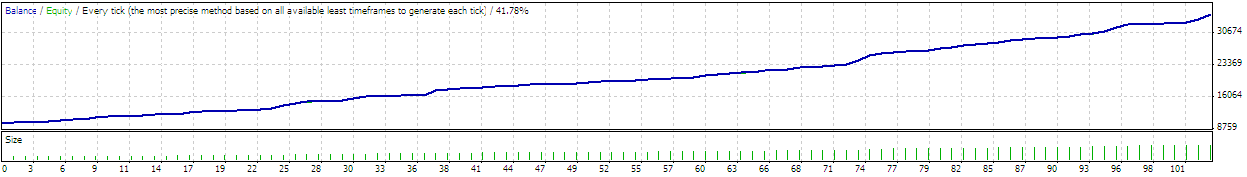
 I'll definitely check up on it often... especially during big movements like a 1000pip surge. I've noticed a nice pattern with about 100pip S/L. ...

- MoForce replied May 11, 2009
I got a couple requests for a long term graph... here's a back test since November 25, 2008 with no stop loss. Although there are no losing trades, some of the potential downdraws are huge, but the data is not accurate and many of those trades ...
Looking for high quality tick data for MT4 (broker:IBFX)
- Looking for high quality tick data for MT4 (broker:IBFX)Started May 11, 2009|Platform Tech|14 replies
I'm looking for high quality tick data to thoroughly back test the EA I created. I've done a ...
- MoForce replied Dec 4, 2007
I'm seeing something interesting.... I drew line closest to the point where we are now right after G/J broke through the bullish wedge and it finally makes sense why I made that line
Auslanco - GBP/JPY and GBP/USD (newstrade) That is one hellofa support line! I'm expecting a ...
- MoForce replied Dec 2, 2007
looks like a great long opportunity is forming
Auslanco - GBP/JPY and GBP/USD (newstrade)
- MoForce replied Nov 28, 2007
Here's one of my charts supporting this.... whenever the extremes of this band is hit the pair always retreats towards the center
Auslanco - GBP/JPY and GBP/USD (newstrade)
- MoForce replied Nov 25, 2007
well there is also this... as you can see I've been building up shorts ever since the failed break of that resistance line of the bullish wedge... so looks to me like we'll be seeing 220-119 pretty soon before we see 230+
Auslanco - GBP/JPY and GBP/USD (newstrade)

- MoForce replied Nov 23, 2007
Time to long
Auslanco - GBP/JPY and GBP/USD (newstrade) G/J just failed to break to the downside of the wedge and bounced off the support line....I'm aiming for 223.50-224 first
- MoForce replied Nov 21, 2007
GJ is still following a nice falling wedge formation so this is what could happen next... -G/J will follow the support line of the wedge for some time -or G/J will rebound to the upside towards 226 and we could see a break of the wedge resistance ...
Auslanco - GBP/JPY and GBP/USD (newstrade)
- MoForce replied Nov 19, 2007
well after some thought I've placed another short targeting 223.50 with an S/L of only +1. I've noticed we are currently in a bullish wedge formation AKA: Falling Wedge(as you can see on the chart below) so pretty soon we're gonna have a HUGE ...
CHART Reading for serious traders

- MoForce replied Nov 19, 2007
well after some thought I've placed another short targeting 223.50 with an S/L of only +1. I've noticed we are currently in a bullish wedge formation AKA: Falling Wedge(as you can see on the chart below) so pretty soon we're gonna have a HUGE ...
Auslanco - GBP/JPY and GBP/USD (newstrade)
- MoForce replied Nov 18, 2007
well what Aus was saying goes very well with my chart...I'm expecting a similar high as Aus showed. The yellow trend line G/J is nearing is very strong resistance so don't go long at that point especially without S/L. I'm aiming for the 23.6% level ...
Auslanco - GBP/JPY and GBP/USD (newstrade)
- MoForce replied Nov 13, 2007
This is my prediction for G/J... it will hit the 38.2% fib level and possibly the yellow trendline right above it. From there I'm expecting either some sideways movement or another big movement downward... that 38.2% level also happens to be at the ...
Auslanco - GBP/JPY and GBP/USD (newstrade)
- MoForce replied Nov 12, 2007
here's my chart
Auslanco - GBP/JPY and GBP/USD (newstrade) I so got this... and yes the above number is next
- MoForce replied Nov 12, 2007
This is just truly amazing... I knew this would happen
Auslanco - GBP/JPY and GBP/USD (newstrade)