- Search Metals Mine
- 14 Results
- MattZander replied Mar 8, 2020
Im expecting a bullish to move the market to retest resistance.
Gold Mining - Using Each Trading Day's Trend
- MattZander replied Mar 8, 2020
I deeply apologize for showing my trading analysis using non gold usd pair. I just want to share my trading strategy that use 70% fibonacci rules. Later i will post gold analysis only. As shown in my previous analysis gold is moving uptrend in long ...
Gold Mining - Using Each Trading Day's Trend
- MattZander replied Mar 8, 2020
Im waiting a big move downward. Later i will try trading gold... Im new in gold. Gold is very risky
Gold Mining - Using Each Trading Day's Trend
- MattZander replied Mar 8, 2020
Hello fellas... I give some tips using fibonacci trick. Practice this at demo account. Good luck. Remember to trade by the trend
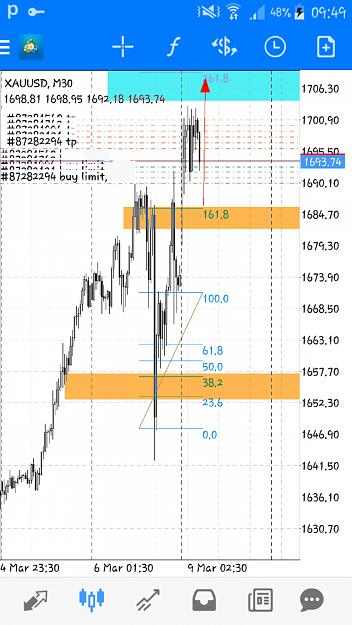
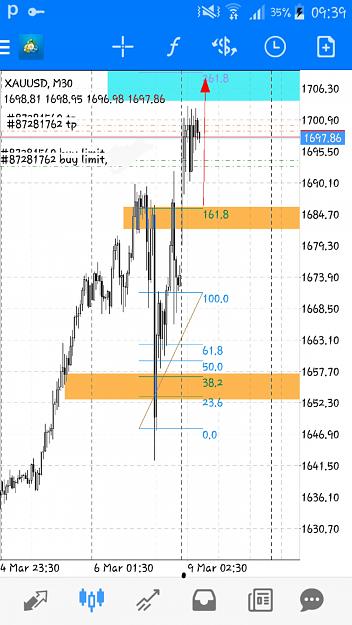
Gold Mining - Using Each Trading Day's Trend
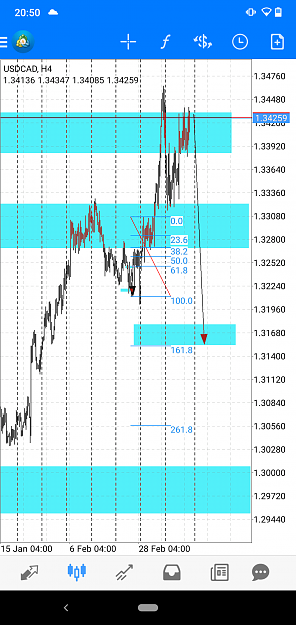
- MattZander replied Mar 8, 2020
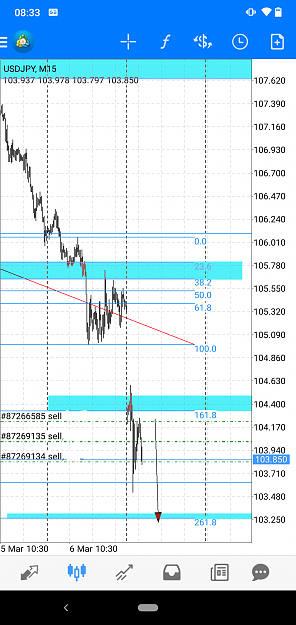
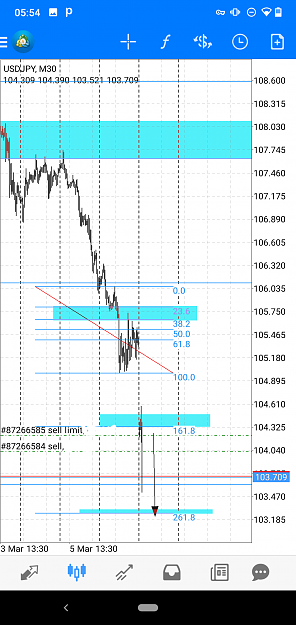
If BEARISH ever move the market down to fibo 161% then it will retrace to retest prev resistance then. MARKET CRASH down. I used to wait for bearish to step in first... But if you can confirm bearish is in control in current area. It can be great ...
Supply and Demand Trading Journal
- MattZander replied Mar 8, 2020
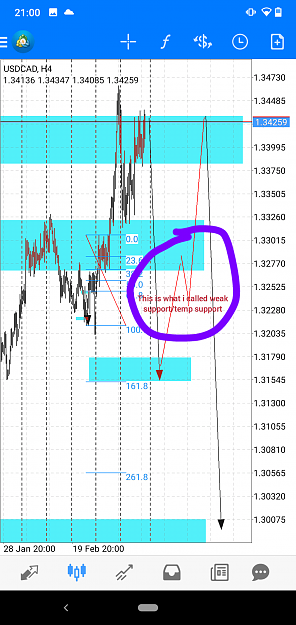
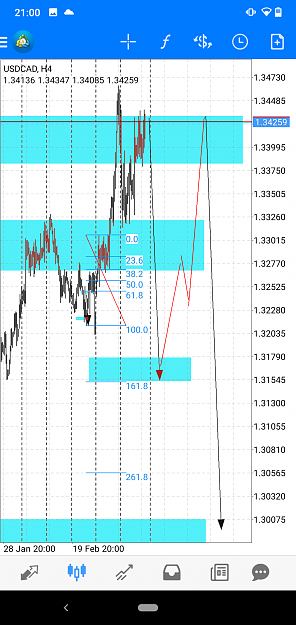
Hey, this is so good price action. I see USDCAD is going to fill the gap down below soon. This is strategy is working in lower time frame, but i never done it in high TF. Can you help me analyze this HUGE opportunity?
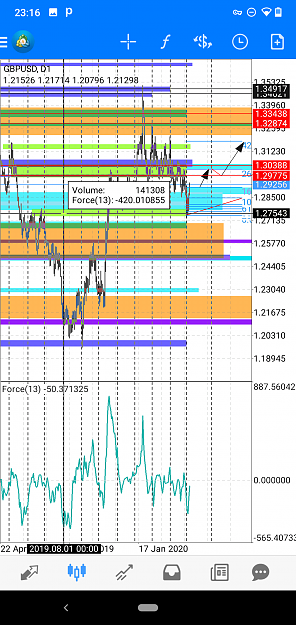
Supply and Demand Trading Journal
- MattZander replied Mar 7, 2020
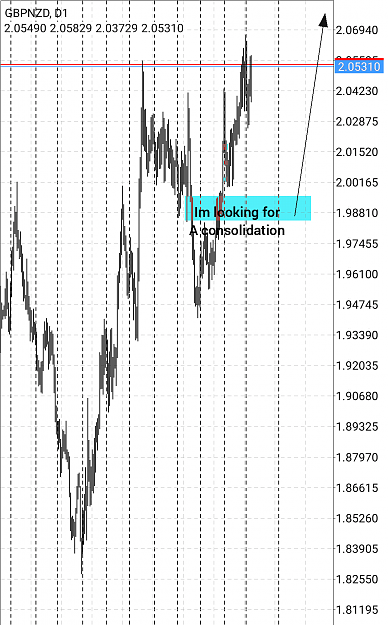
Im still stupid using price action. Thats why i subscribe this thread. If i do any supply demand wrong. Dont feel hesitate to correct my wrong analysis. I'm thanking for that. This is my projection, but i do not know where GBP will actually retrace. ...
Supply and Demand Trading Journal
- MattZander replied Mar 6, 2020
Skolj i can't see anything in your chart but line. Try my simple trading template. url
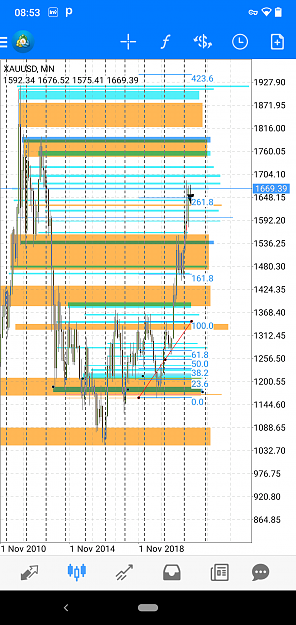
Gold Mining - Using Each Trading Day's Trend
- MattZander replied Mar 5, 2020
This entry is good. But selling gold actually is doing counter trend now. Monthly view is bullish. Although it can retrace down a little deep. Please note: I do not recommend any long/short as I do not open any gold. Regards
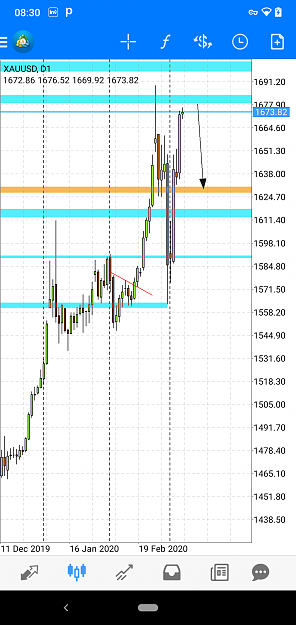
Gold Mining - Using Each Trading Day's Trend
- MattZander replied Mar 5, 2020
I never trade gold, but i made supply demand analysis. I do not make fibonacci analysis as i know i would not trade gold. It's movement is too fast sometimes, im abit afraid...
Gold Mining - Using Each Trading Day's Trend
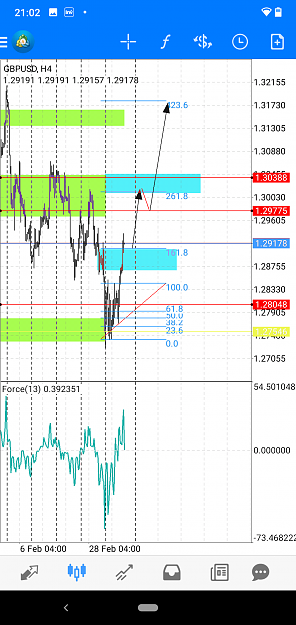
- MattZander replied Mar 5, 2020
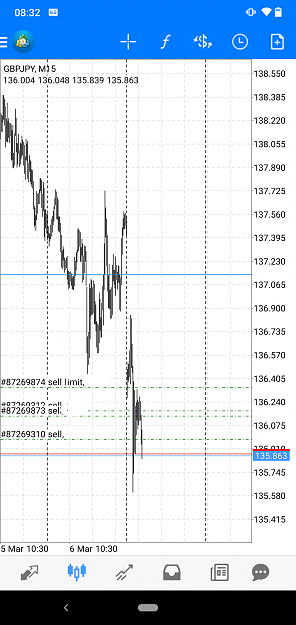
Yellow line I drew 1.275 remarks the imbalance of demand. Fulfilling elliot wave corrective wave and Fibonacci 50% in higher time frame. If GBPUSD ever cross below 1.275 and retest 1.275. GBP is going to crash (Based on supply demand)
Cable Update (GBPUSD)
- Posts by Member Search: 'MattZander'