- Search Metals Mine
- 28 Results
- Kowalczyk replied Apr 6, 2012
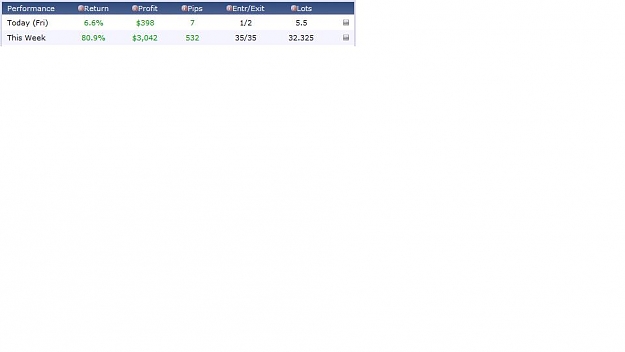
I don't mean to brag (well, sort of), but: image Disclaimer: This is only a side account (real) and not my main account. You should not take this kind of risk on your main accounts.
EURUSD
- Kowalczyk replied Apr 3, 2012
I would believe it if it was April 1st but not today. Last year, April Fools Day was also NFP. A 100 pip move down and back up. It closed the 4-hr chart in a massive dojo along with a 100 pip rise in the next 4 hr- candle.
EURUSD image ...

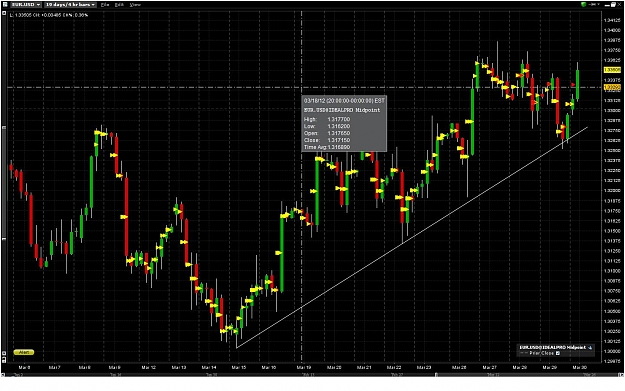
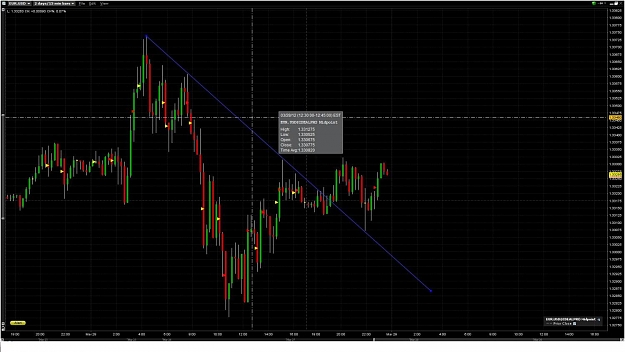
- Kowalczyk replied Mar 29, 2012
On my chart, it looks like you are forcing the trend line to fit. Never a good thing. image Not my favorite trade, but if the trend line is broken, it sometimes go back one last time before reversing the trend (trick people to go long or something ...
EURUSD
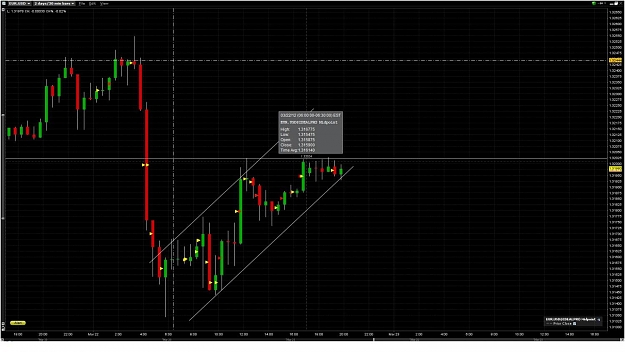
- Kowalczyk replied Mar 28, 2012
Even though I still like the down side, we might have a large move up soon. I still have a short position though. I've skipped enough profitable trades for one week already. image Long term and medium term are saying short. But short term chart is ...
EURUSD
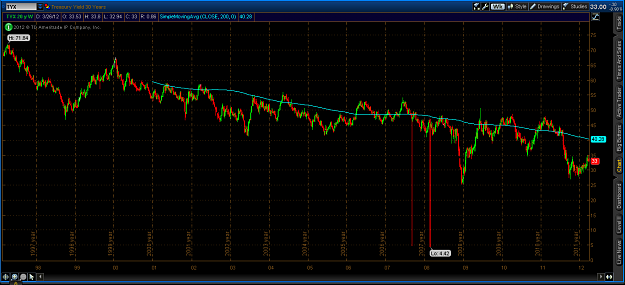
- Kowalczyk replied Mar 27, 2012
I am talking about US bonds. image The yield goes down, which means people (including China) are buying bonds. The bond yields are at an all time low which means investors can't get enough. To be fair, our Gov has been buying these bonds too but ...
EURUSD
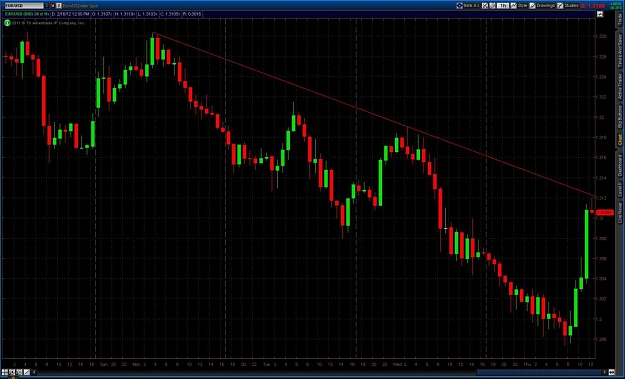
- Kowalczyk replied Mar 22, 2012
image Once again, this is nothing that I would trade. Just shows that price should be making a decision any time now.
EURUSD

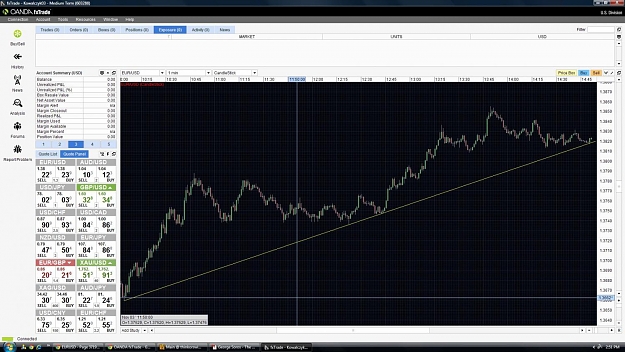
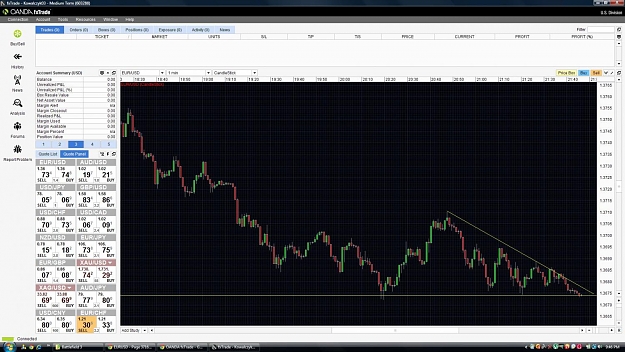
- Kowalczyk replied Nov 4, 2011
The line must be tested eventually. And its Friday. Anything is possible on a Friday afternoon. image And the weekly looks like it could close a little lower.
EURUSD
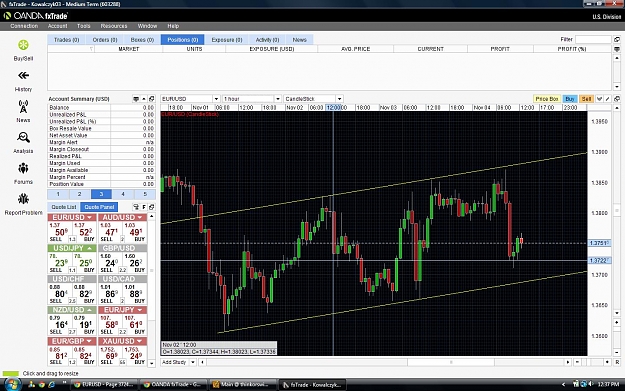
- Kowalczyk replied Nov 3, 2011
Here is what should happen. We reach the 1.3922-1.3945 area, retrace at least to the 1.3872 area and go for 1.3995-1.4013 area. Supply zones in agreements with fib retracements. image
EURUSD
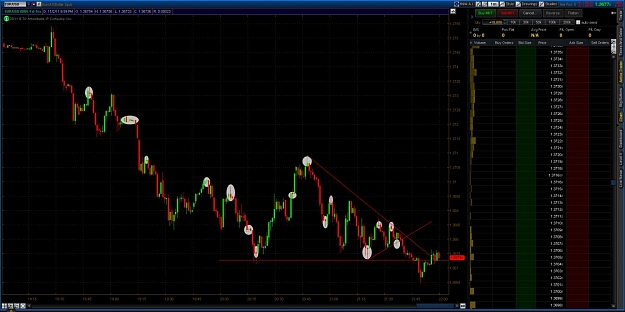
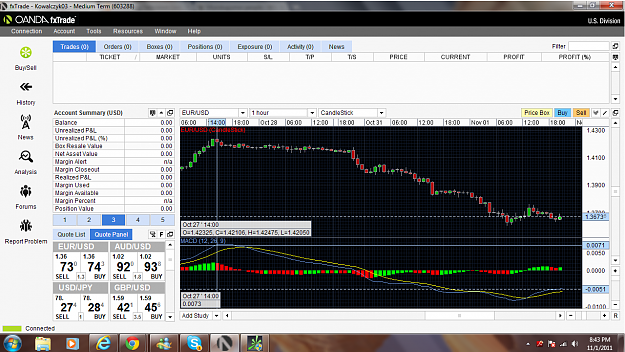
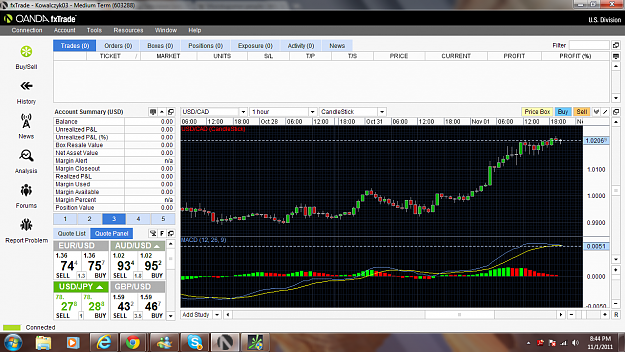
- Kowalczyk replied Nov 1, 2011
Yes, me too. You see that in the EUR/USD chart, every time EUR/USD hits a new low, the MACD fails to make a new low. That is MACD divergence. image But with the usd/cad, the MACD is making new highs along with the currency. image
EURUSD
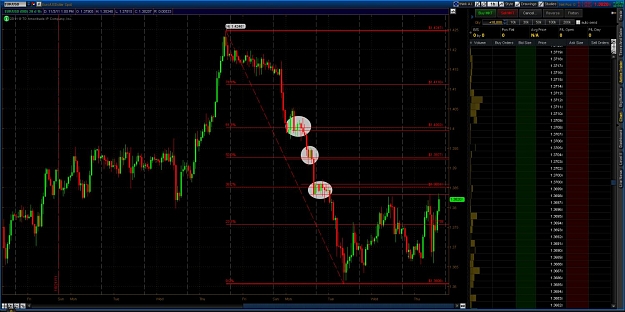
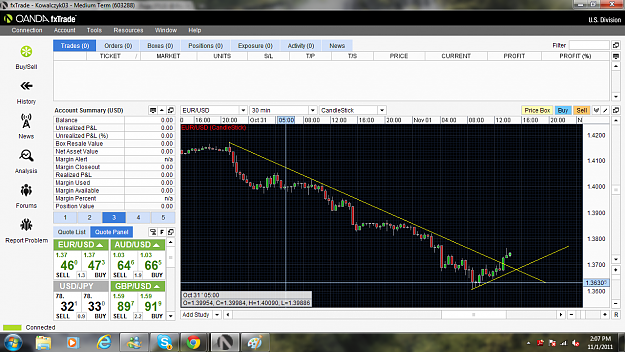
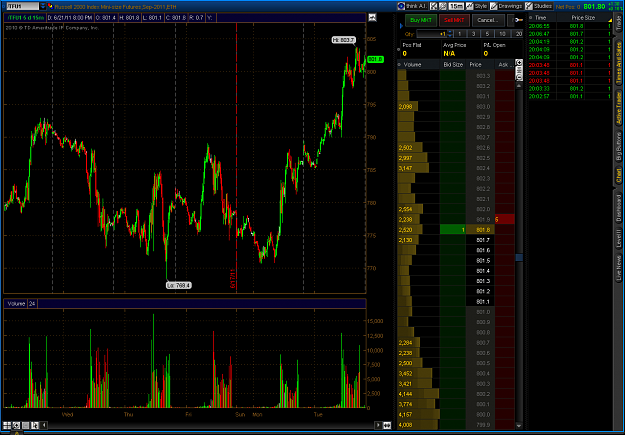
- Kowalczyk replied Nov 1, 2011
Maybe, if PA suggests we will go higher, I will exit my short and just wait to get long at ~1.3680. We should retest the broken trend line on the hourly before we go up. image
EURUSD
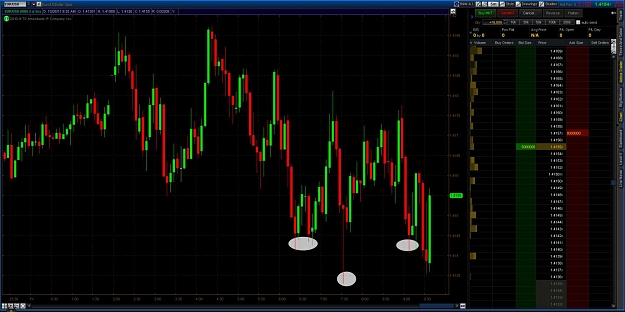
- Kowalczyk replied Oct 28, 2011
The us opening bell ruined it a little but I still think that it will hold. SL at 1.4130 image
EURUSD
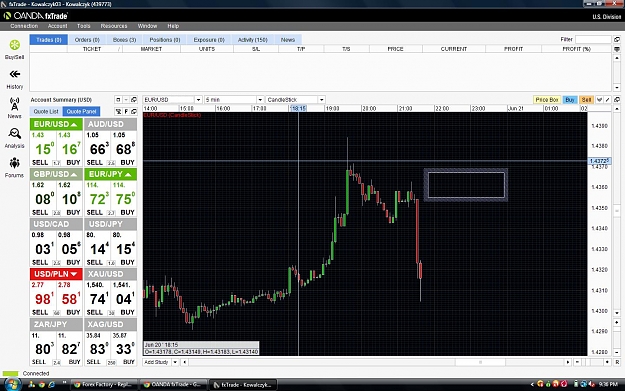
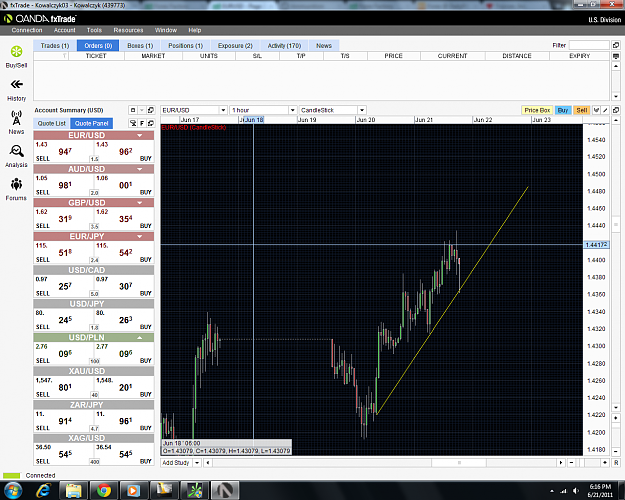
- Kowalczyk replied Jun 21, 2011
We are going higher. First, EURUSD skyrocketed. Everyone bought. Then it quickly reversed. Everyone thought, "Buy on rumor, sell on news". Everyone went short. Now, we are going to go even higher. The big boys probably just made a killing. My TP is ...
EURUSD
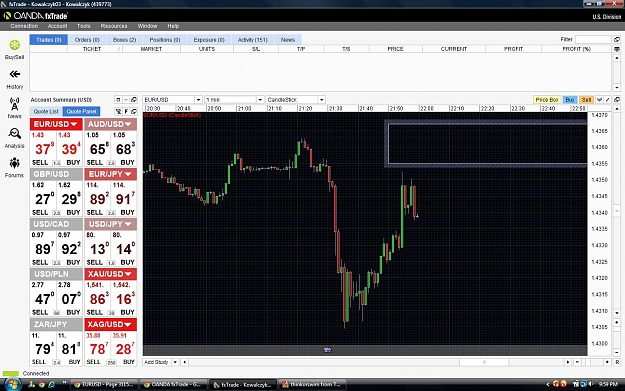
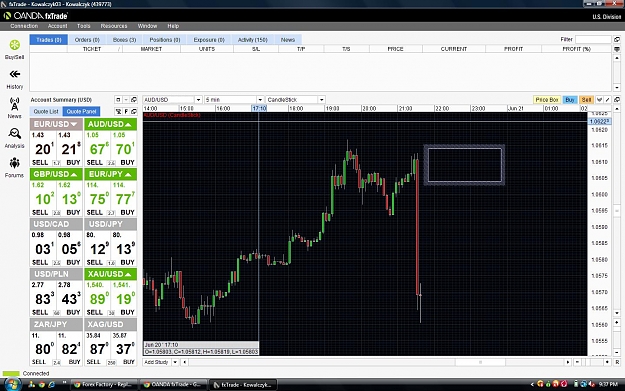
- Kowalczyk replied Jun 20, 2011
How to trade News — 4 to 1 return. Doesn't matter if its bullish or bearish. As close to a guarantee as you can get. Man I love trading news.
EURUSD