- Search Metals Mine
- 3,126 Results (1 Thread , 3,125 Replies )
-
 KeenPips replied Apr 28, 2024
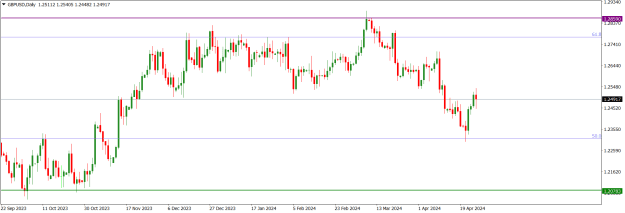
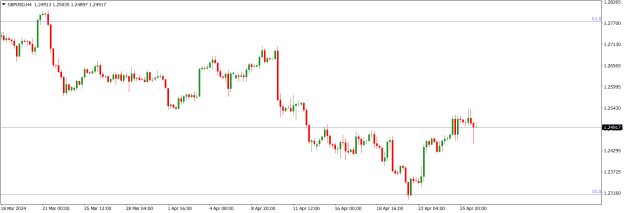
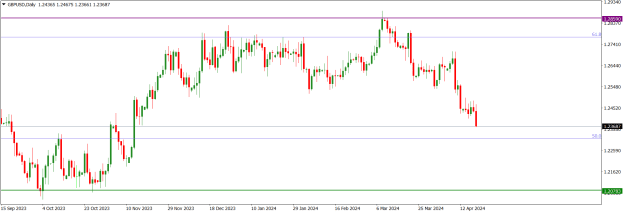
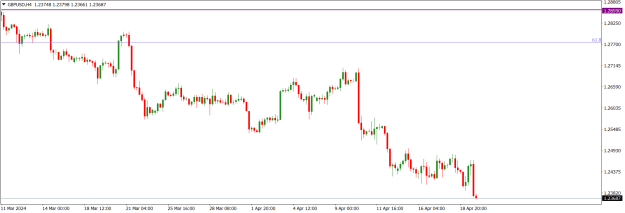
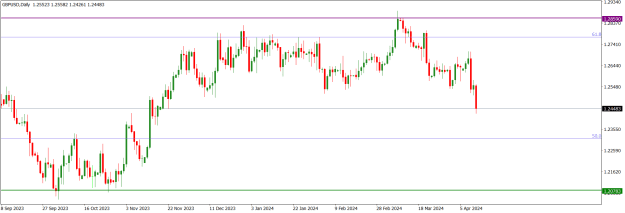
GBPUSD price action on the daily time frame is making a correction of a long-term bearish swing. Presently, price action is sideways at the 1.24910 horizontal resistance. But the technical impulse favours bears more than bulls. I may be wrong. Trade ...
Cable Update (GBPUSD)
- KeenPips replied Apr 28, 2024
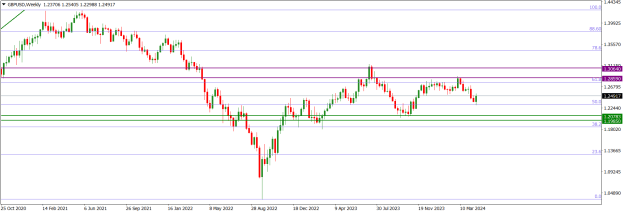
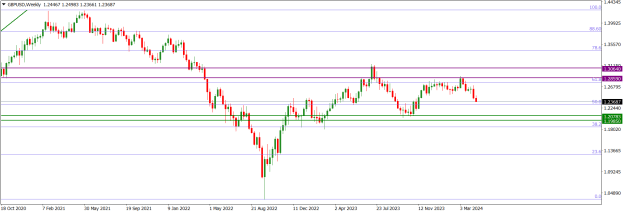
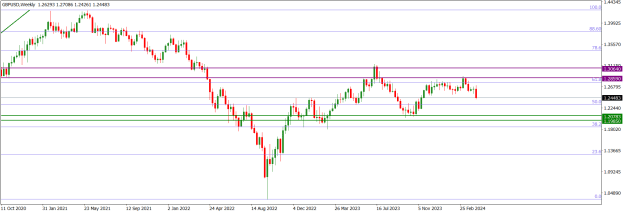
GBPUSD Weekly Technical Outlook GBPUSD market operation on the weekly time frame has turned sideways at the 50 Fib area of a long-term bearish swing. Seven weeks ago, there was a bearish rejection of the bullish retest of the 61.8 Fib area. Although ...
Weekly Top-Down Technical Analyses

- KeenPips replied Apr 28, 2024
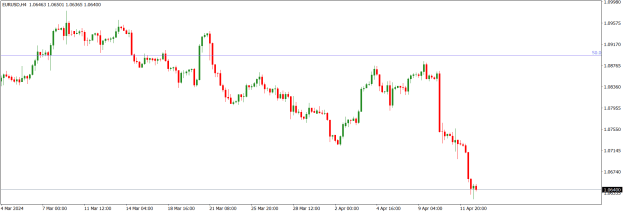
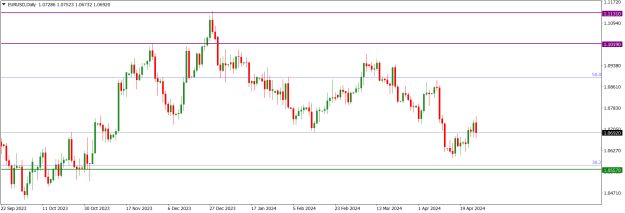
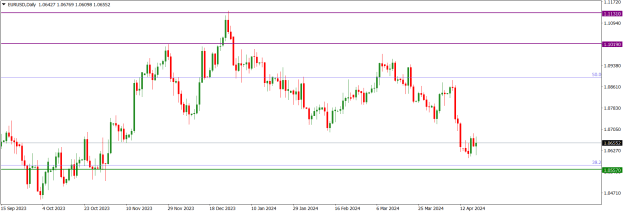
EURUSD price action on the daily time frame went sideways after a bullish correction of the bearish technical impulse. Presently, price action is located at the 1.06920 intra-day horizontal support and is a few pips above the 38.2 Fib area of a ...
EURUSD
- KeenPips replied Apr 28, 2024
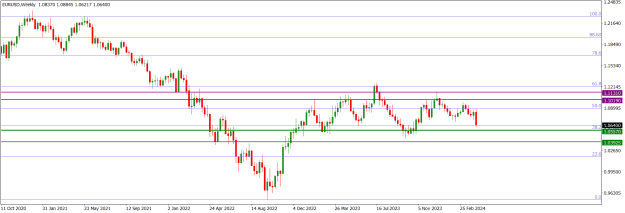
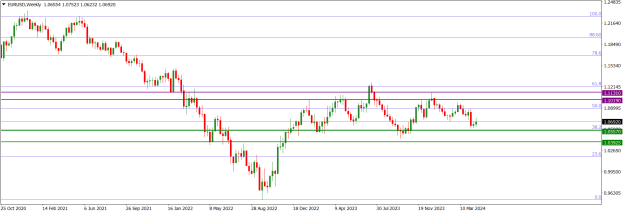
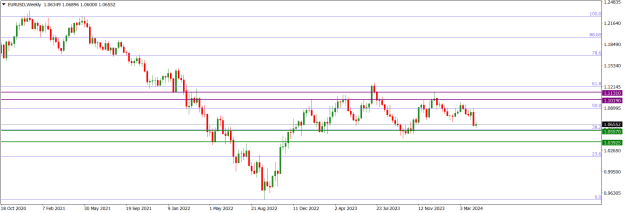
EURUSD Weekly Technical Outlook EURUSD market operation remains sideways near the 38.2 Fib area of a long-term bearish swing after a bearish drop from the 50 Fib area three weeks ago. The 1.05570 immediate horizontal support is in confluence with ...
Weekly Top-Down Technical Analyses

- KeenPips replied Apr 28, 2024
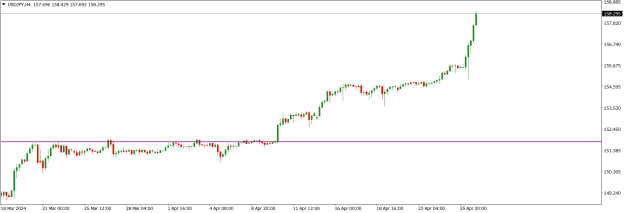
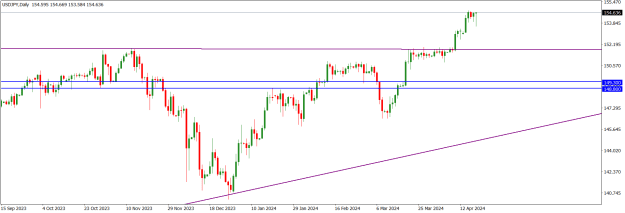
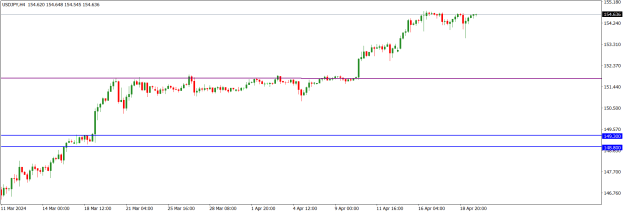
USDJPY price action on the H4 time frame made a northward drive to print an all-time high time at the 158.300 area. This was after a long period of sluggish momentum and consolidation. We should not be surprised to see bearish challenge of further ...
USD/JPY Discussion
- KeenPips replied Apr 28, 2024
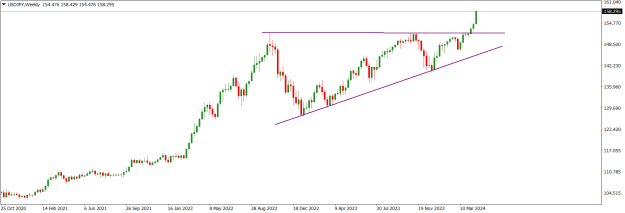
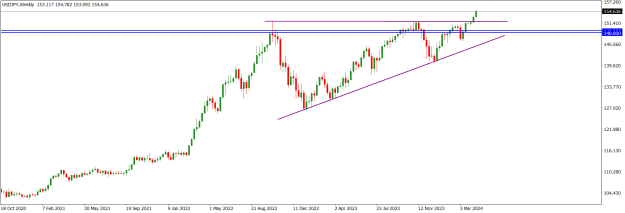
USDJPY Weekly Technical Outlook USDJPY market operation on the weekly time frame is bullish. Last week, the market operation printed a relatively big bullish continuation candlestick that resulted in an all-time high of 158.300. image USDJPY price ...
Weekly Top-Down Technical Analyses

- KeenPips replied Apr 28, 2024
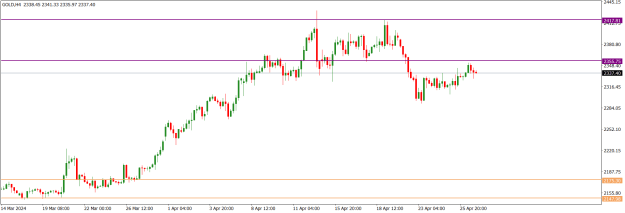
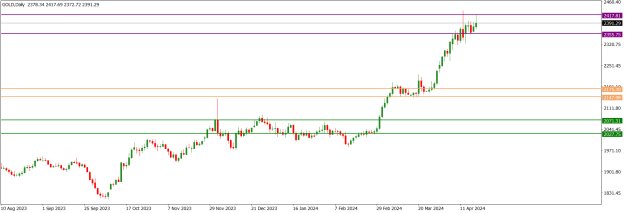
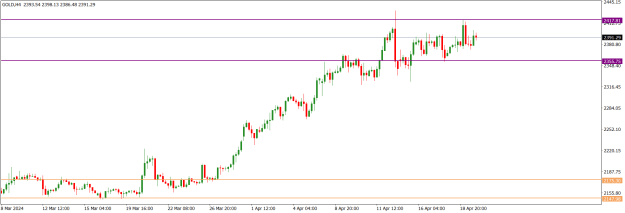
Although XAUUSD price action on the H4 time frame is presently sideways, price action was in a bullish correction of a relatively strong bearish drive. Technically, we may see further southward move in the early part of this week. I may be wrong. ...
XAU/USD & XAG/USD - Gold & Silver Traders Thread

- KeenPips replied Apr 28, 2024
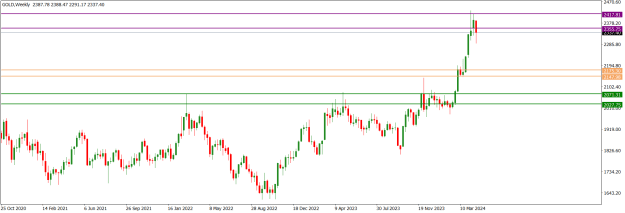
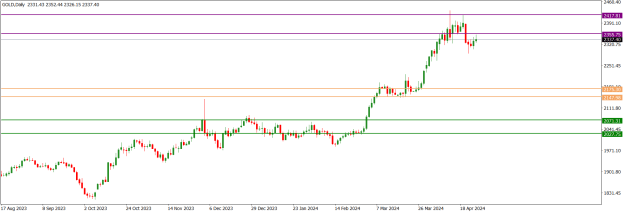
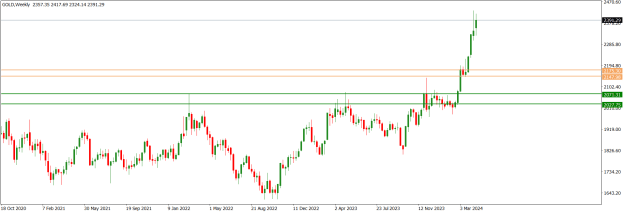
XAUUSD Weekly Technical Outlook Last week, XAUUSD market operation on the weekly time frame made a bearish rejection of the 2355.75/2417.81 horizontal resistance zone (purple). However, the bearish candlestick printed has a long tail, which ...
Weekly Top-Down Technical Analyses
- KeenPips replied Apr 21, 2024
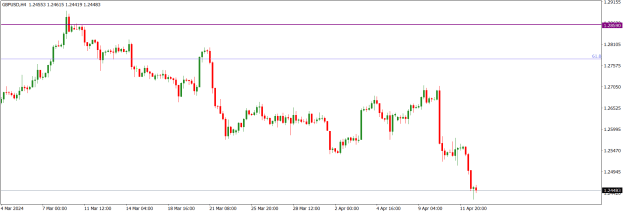
GBPUSD price action on the daily time frame is bearish. Presently, price action is tackling the 1.236887 horizontal support area. The dominant technical structure is bearish. I may be wrong. Trade safe and prosper. KP image
Cable Update (GBPUSD)
- KeenPips replied Apr 21, 2024
GBPUSD Weekly Technical Outlook GBPUSD market operation on the weekly time frame is bearish. However, there is a decline in bearish momentum. Last week, market operation printed a relatively smaller bearish candlestick than the one printed in the ...
Weekly Top-Down Technical Analyses

- KeenPips replied Apr 21, 2024
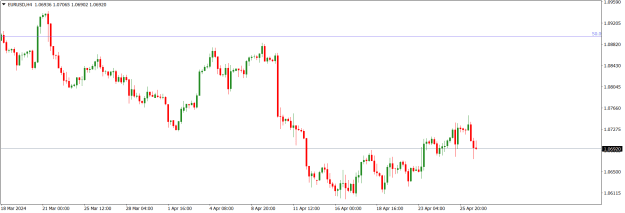
EURUSD price action on the daily time frame is in a bullish corrective mode. There was a bearish breakdown of the 1.07085 horizontal support arear a few days ago but price action went sideways thereafter before a brief bullish pullback. Technically, ...
EURUSD

- KeenPips replied Apr 21, 2024
EURUSD Weekly Technical Outlook The EURUSD market operation on the weekly time frame turned sideways last week after the bearish breakout of the previous week. Market operation is approaching the 1.05570 horizontal support area. image EURUSD price ...
Weekly Top-Down Technical Analyses

- KeenPips replied Apr 21, 2024
USDJPY price action on the daily time frame went sideways as it approaches the 155.00 area. Technically, as indicated in the long-tailed doji-like candlestick printed on Friday, bulls are still favoured to regain market influence at least on a ...
USD/JPY Discussion
- KeenPips replied Apr 21, 2024
USDJPY Weekly Technical Outlook USDJPY market operation on the weekly time frame is bullish. Last week, it printed a bullish continuation candlestick that extended its progression beyond the 152.00 horizonal resistance area. image USDJPY price ...
Weekly Top-Down Technical Analyses

- KeenPips replied Apr 21, 2024
XAUUSD price action on the H4 time frame is consolidating within the 2355.70/2417.81 horizontal channel (purple) after a bullish drive to print another all-year high. What price action does in the zone after Monday’s close should be watched. I may ...
XAU/USD & XAG/USD - Gold & Silver Traders Thread

- KeenPips replied Apr 21, 2024
XAUUSD Weekly Technical Outlook XAUUSD market operation on the weekly time frame is bullish. Last week, it printed a bullish candlestick which surged northwards to cover the long wick left on the candlestick printed in the previous week. However, ...
Weekly Top-Down Technical Analyses
- KeenPips replied Apr 14, 2024
GBPUSD price action on the daily time frame disposed bearish on Friday, but bulls are still influential in the market. The bearish candlestick printed on Friday has a bottom tail as price action tackles the 1.24480 intra-day horizontal support. The ...
Cable Update (GBPUSD)
- KeenPips replied Apr 14, 2024
GBPUSD Weekly Technical Outlook GBPUSD market operation on the weekly time frame printed a bearish candlestick last week. The bearish print broke below the consolidation area that had been in place for three weeks. Market operation is still in a ...
Weekly Top-Down Technical Analyses

- KeenPips replied Apr 14, 2024
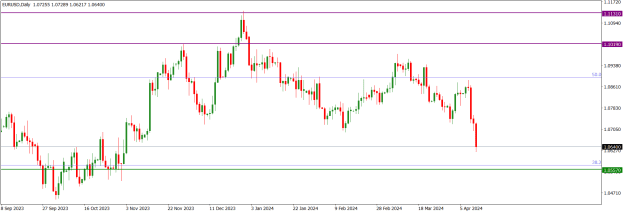
Although EURUSD price action on the daily time frame disposed bearish on Friday, bulls are still influential in the market. The bearish candlestick printed on Friday has a bottom tail as price action tackles the 1.06400 intra-day horizontal support. ...
EURUSD
- KeenPips replied Apr 14, 2024
EURUSD Weekly Technical Outlook EURUSD market operation on the weekly time frame printed a bearish candlestick last week. The bearish print broke below the consolidation area that had been in place for three weeks. Market operation is still in a ...
Weekly Top-Down Technical Analyses