- Search Metals Mine
- 28 Results
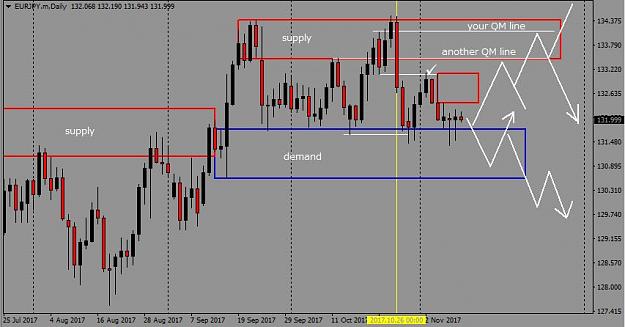
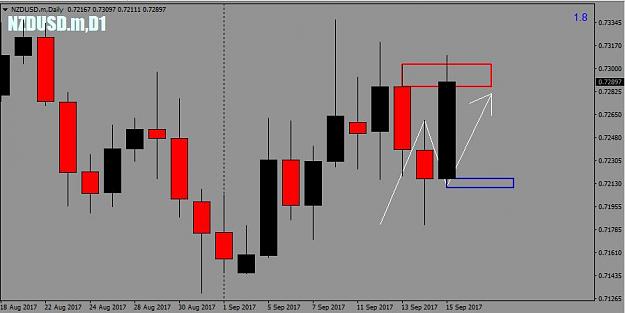
- Kamnoi replied Sep 15, 2017
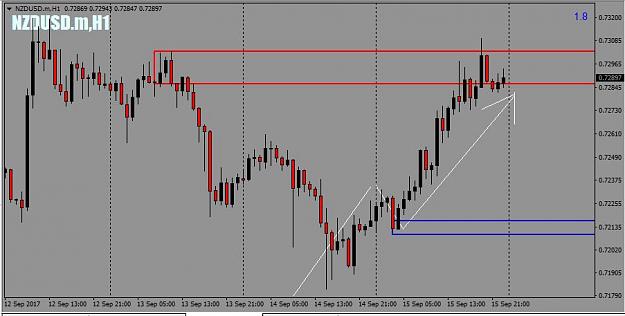
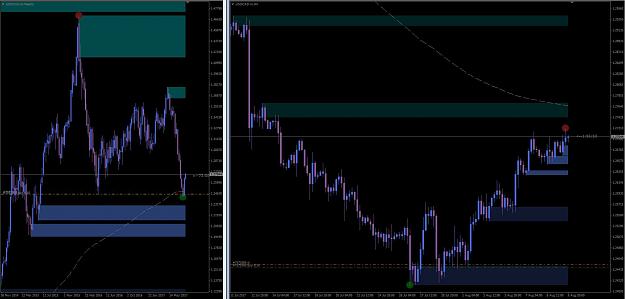
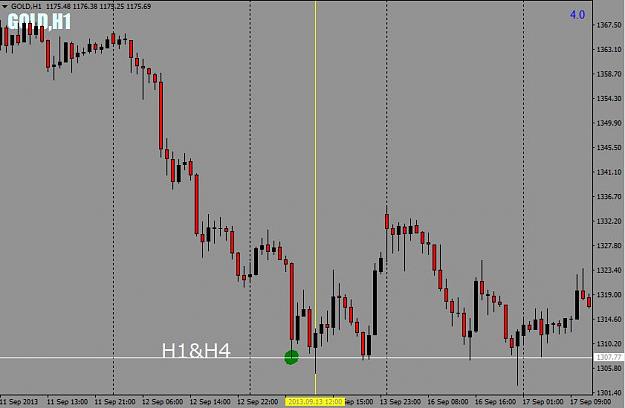
As C12 says, you really have to view pairs on multiple timeframes. Daily image H1 image
C-12's Supply, Demand and PA thread
- Kamnoi replied Sep 13, 2017
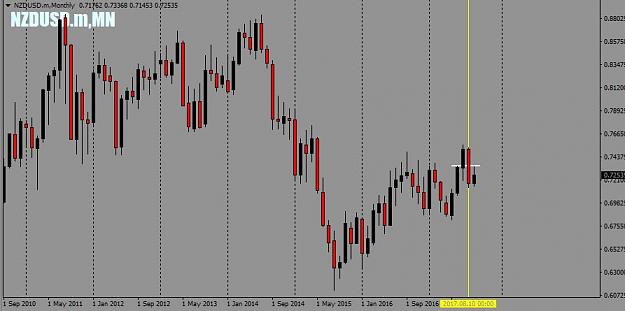
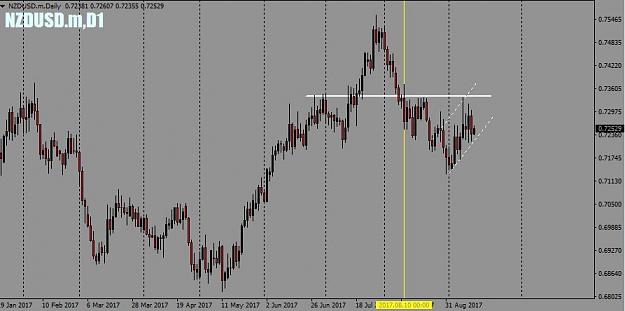
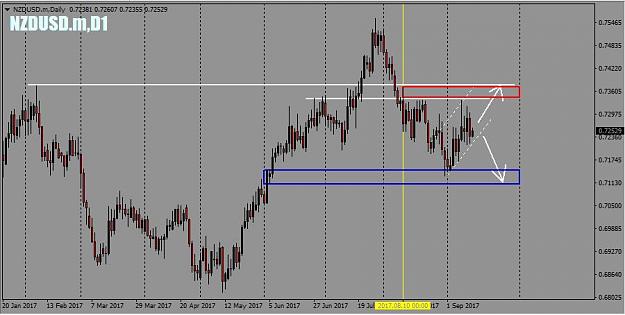
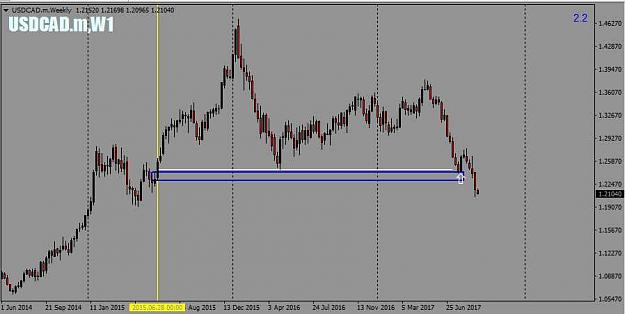
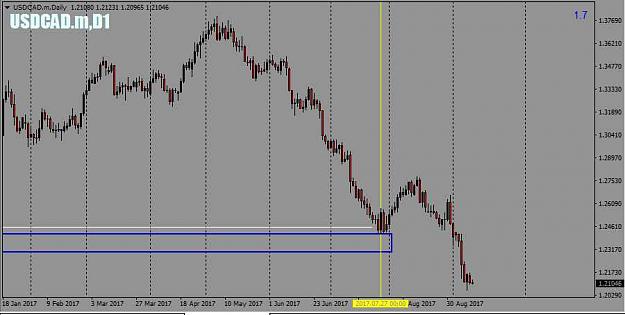
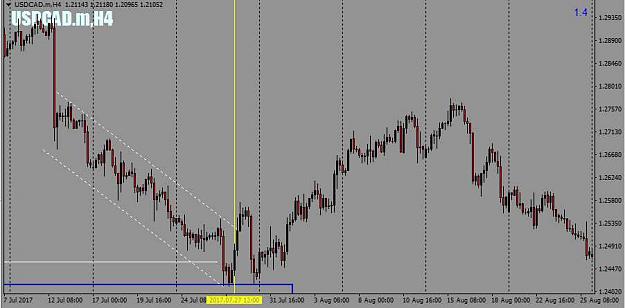
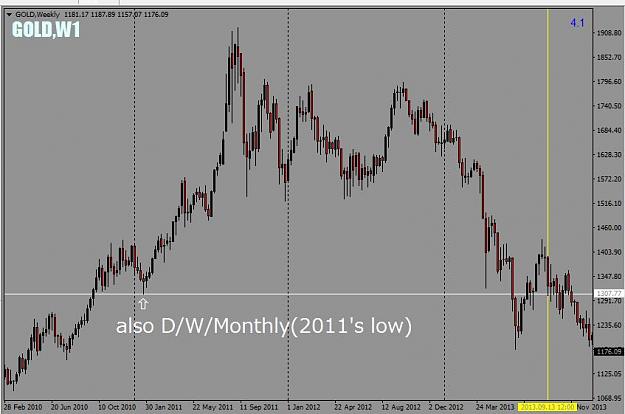
Hi Gemini Man. I think you are correct. some charts,monthly&dailly. image image image
Up and under price pattern
- Kamnoi replied Sep 13, 2017
Hi fxloser. My English is not good too and it's hard to understand for me from just reading the thread. so I always draw a line on my chart when someone upload their chart and trade. This helps me a lot. example url image ...
C-12's Supply, Demand and PA thread
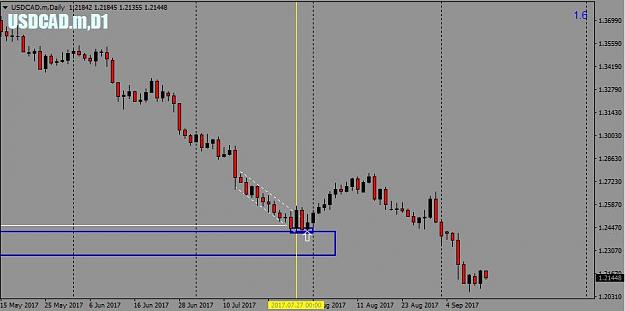
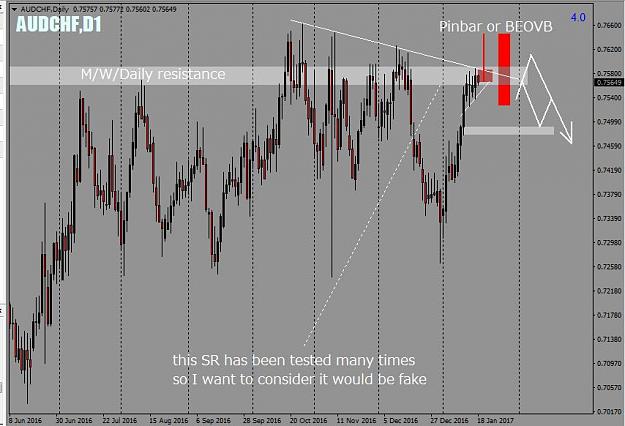
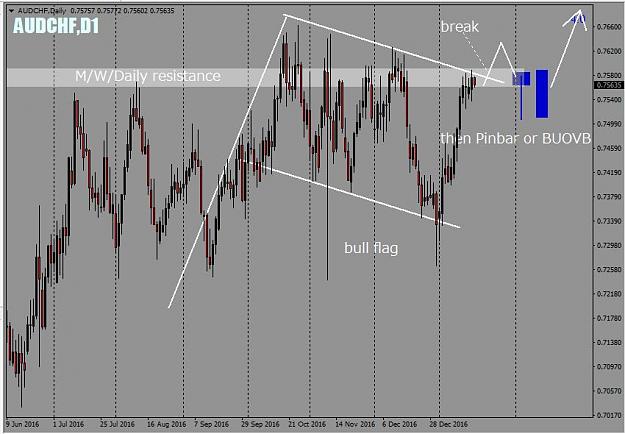
- Kamnoi replied Jan 17, 2017
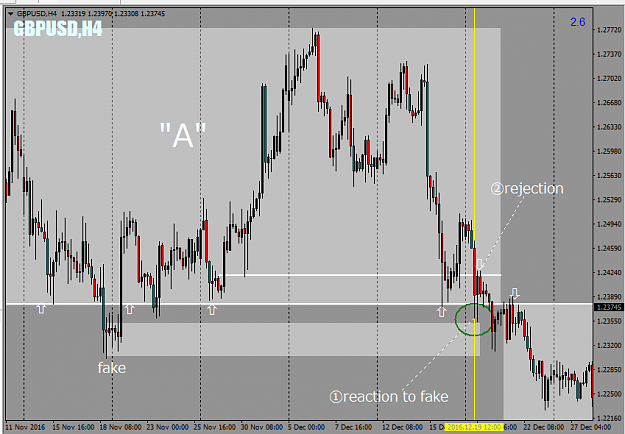
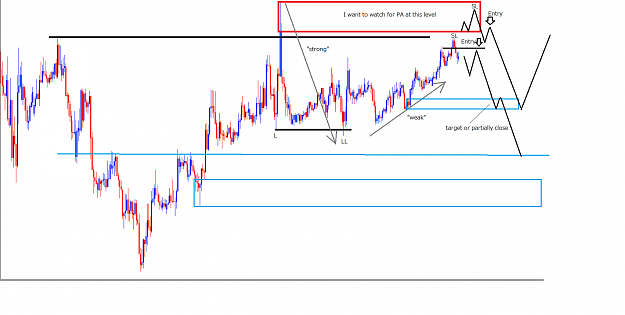
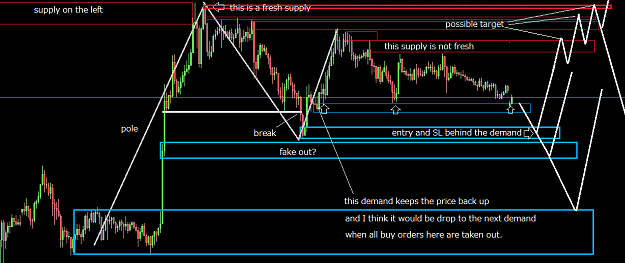
Price is near M/W/Daily Resistance right now. and this resistance has been tested many times in the past. so if I trade PA, I 'd like to see this resistance to be faked or break first. btw sorry for my English. I'm not good at it... Fake image ...
james16 Chart Thread
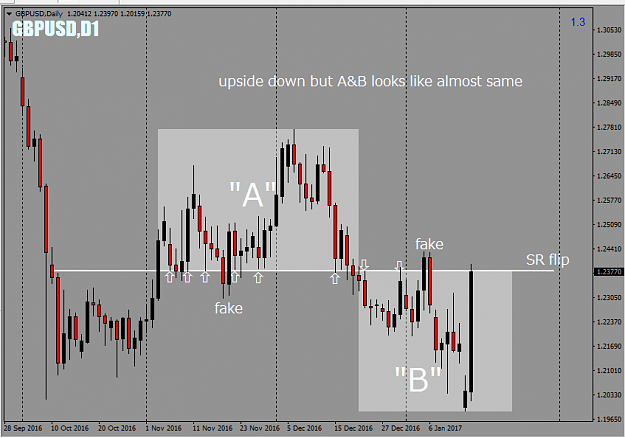
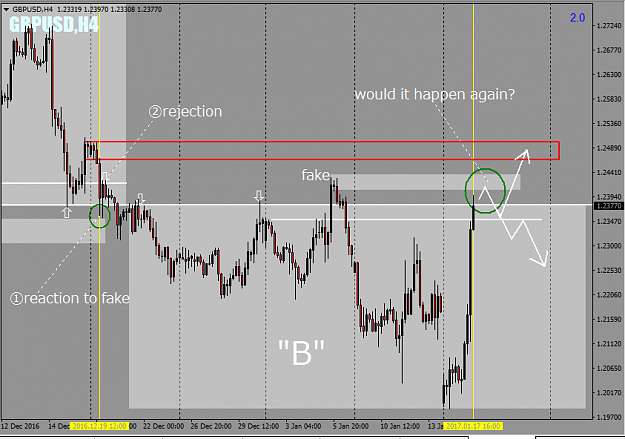
- Kamnoi replied Jan 17, 2017
upside down but A&B they looks almost same to me. it's interesting. image "A" - a reaction to the fake and the rejection after that image then "B" - now price is approaching to the fake. image
what happens next? Price action training
- Kamnoi replied Jan 6, 2017
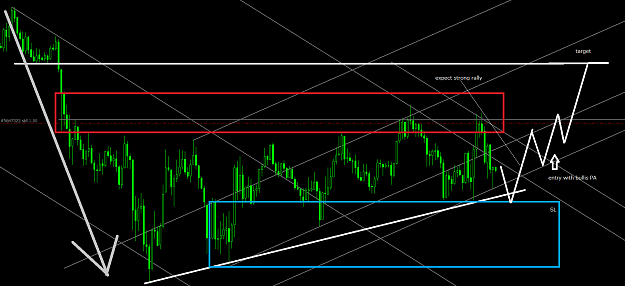
Up trend line still not break, so I'd like to think of a buy setup first. image
what happens next? Price action training
- Kamnoi replied Jan 5, 2017
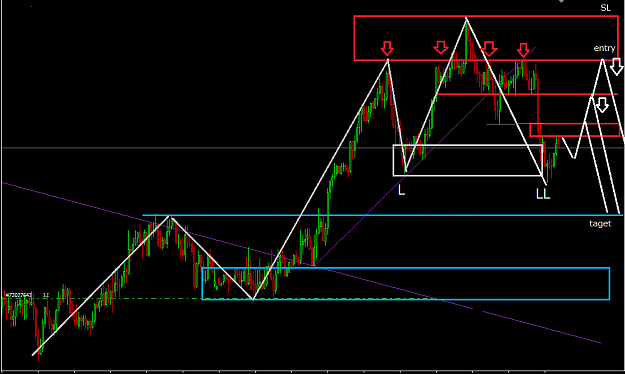
I would wait for sell opportunity on this one. image
what happens next? Price action training
- Kamnoi replied Jan 4, 2017
I agree with simond2002. I would sell only if I found HTF demand at this level. image
what happens next? Price action training
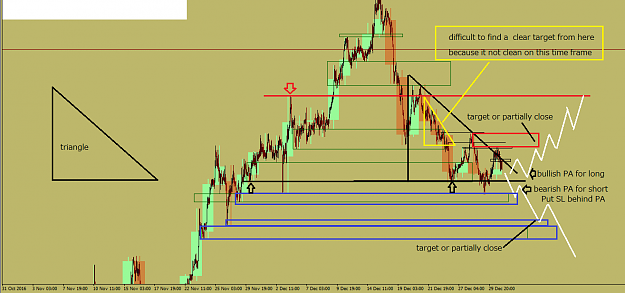
- Kamnoi replied Jan 2, 2017
I think the price is still in a triangle. it looks difficult to judge which way to go. I want to wait for the triangle to be break first. image
what happens next? Price action training
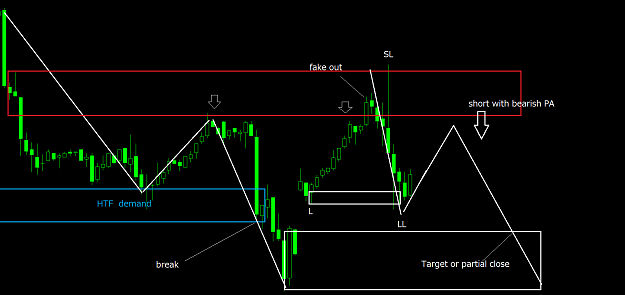
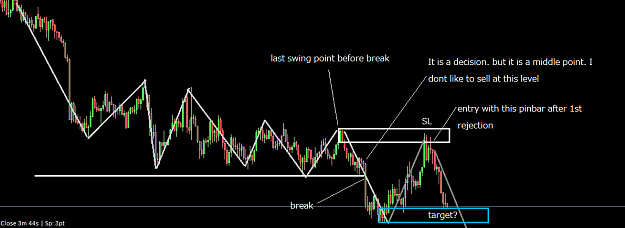
- Kamnoi replied Dec 29, 2016
short at last swing point before breakout ? image
what happens next? Price action training
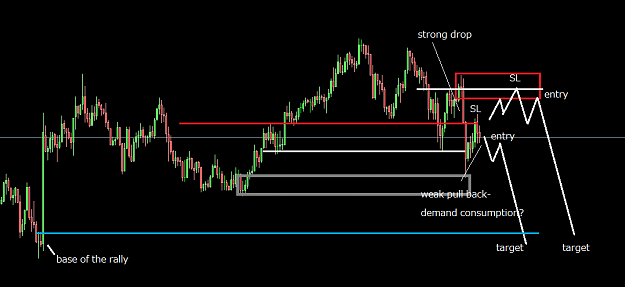
- Kamnoi replied Dec 28, 2016
I would wait for short setup on this one. image
what happens next? Price action training
- Kamnoi replied Dec 28, 2016
I probably wait for sell opportunity on this one image
what happens next? Price action training
- Kamnoi replied Dec 26, 2016
my view. sorry for my bad English. image
what happens next? Price action training
- Kamnoi replied Dec 7, 2016
>why the initial point was the one circled and not the one marked with purple line. I think the purple looks like rather minor support level but the one circled is very strong with the confluence from H1/H4/D/W/Monthly charts. >wouldn't the yellow ...
Up and under price pattern
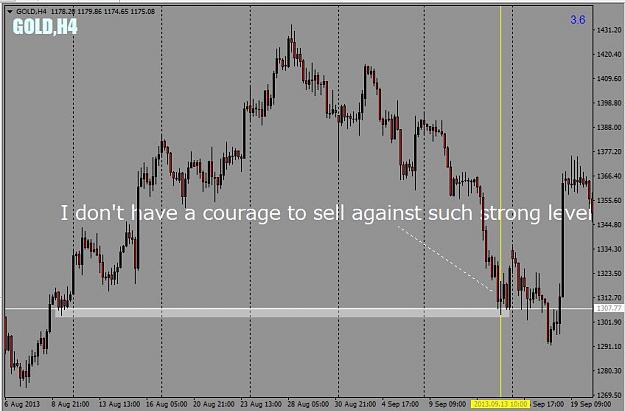
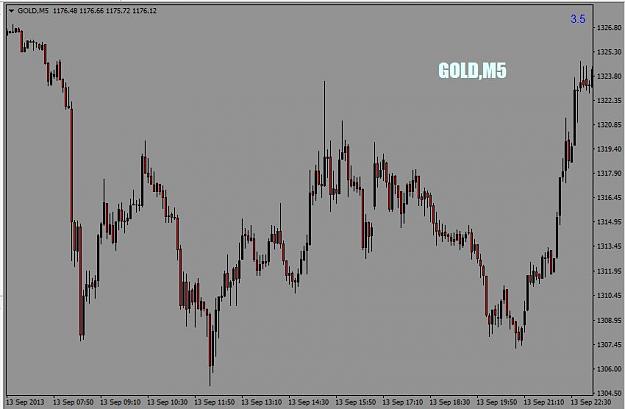
- Kamnoi replied Dec 7, 2016
It is Gold M5 chart from the next post - url image
Up and under price pattern
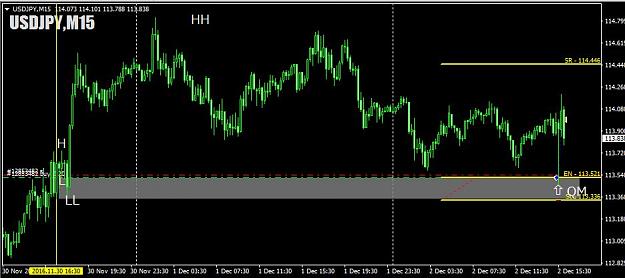
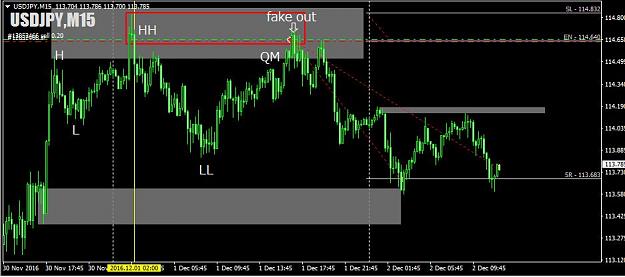
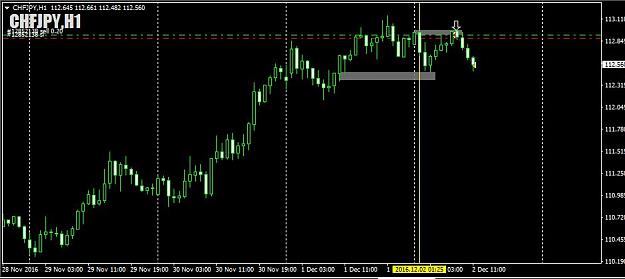
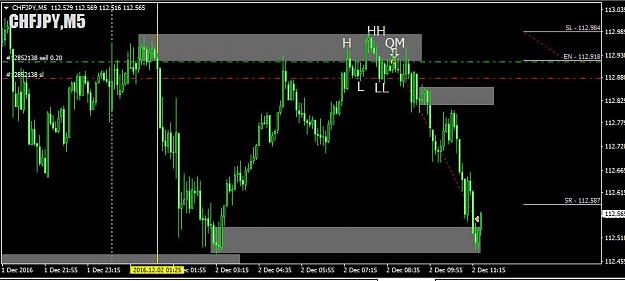
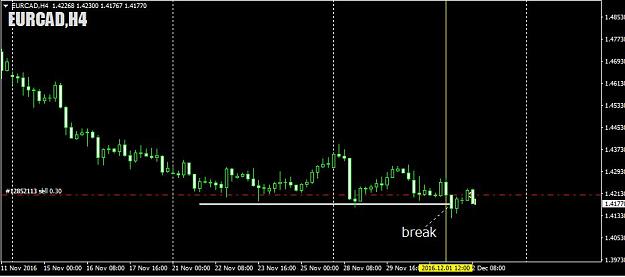
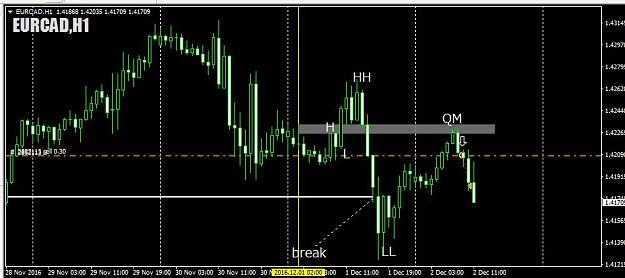
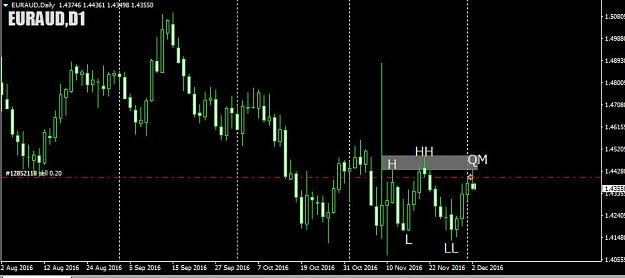
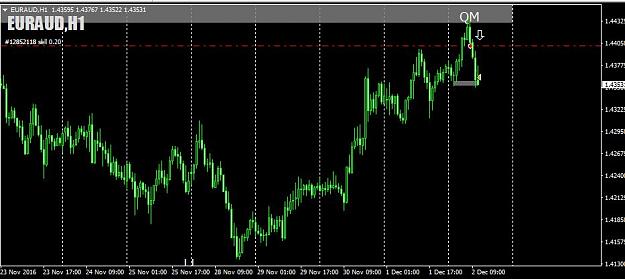
- Kamnoi replied Dec 2, 2016
CHFJ short 5M QM@H1 demand image image ECAD short image image EA short image image
Up and under price pattern
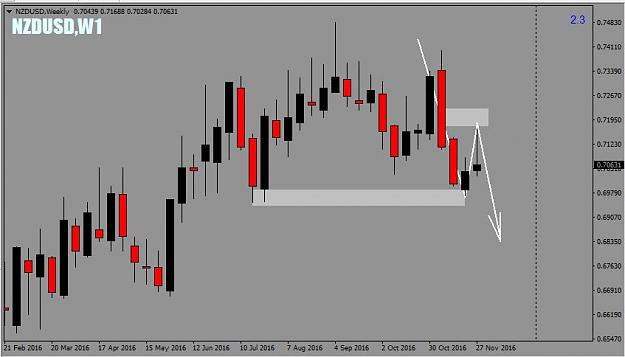
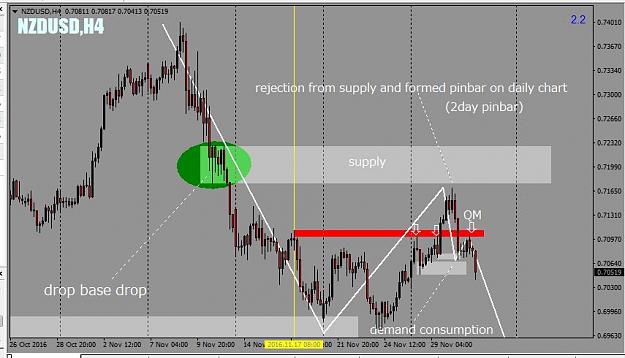
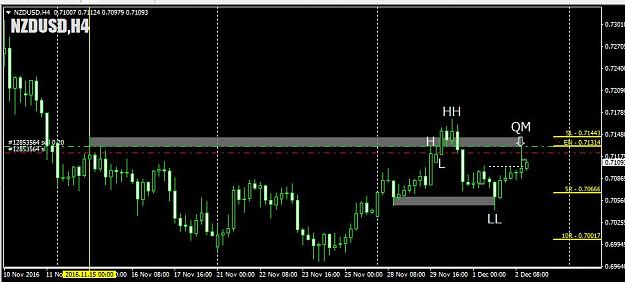
- Kamnoi replied Dec 1, 2016
this was my big picture for NU. weekly image then I went down to the lower time frames(4H/Daily) and looked into more details and took QM. image
Up and under price pattern