- Search Metals Mine
- 193 Results
-
 Jarass1080 replied Sep 30, 2022
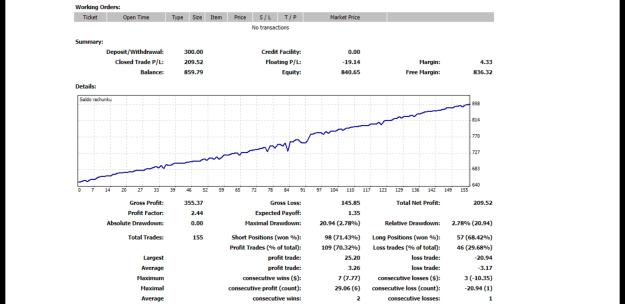
************************** the second month and a total of 175% of the profit. image
Free Grid EA Ikarus - From zero to hero
- Jarass1080 replied Sep 30, 2022
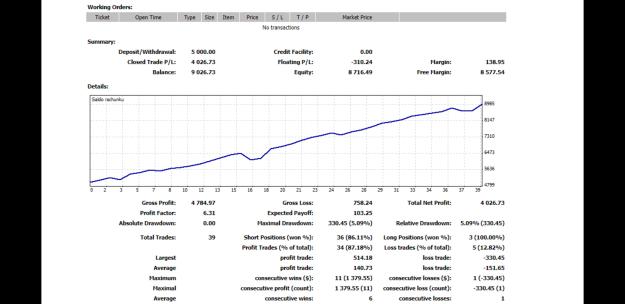
Hi 3 weeks and 135% profit in the live market The robot has great potential. image
Free Grid EA Ikarus - From zero to hero
- Jarass1080 replied Aug 29, 2022
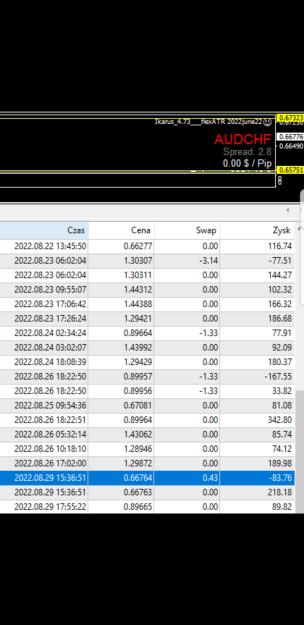
it is in a live market image
Free Grid EA Ikarus - From zero to hero
- Jarass1080 replied Aug 27, 2022
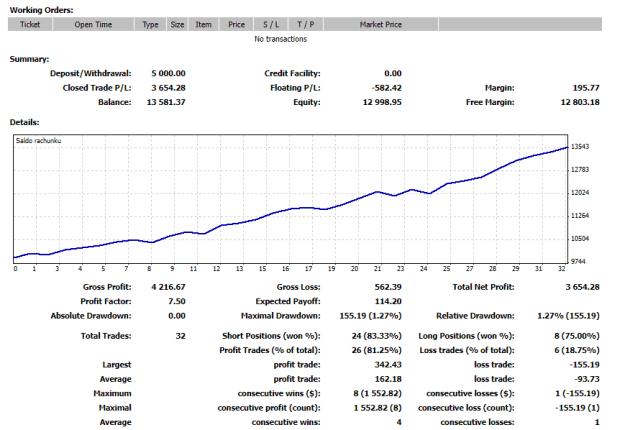
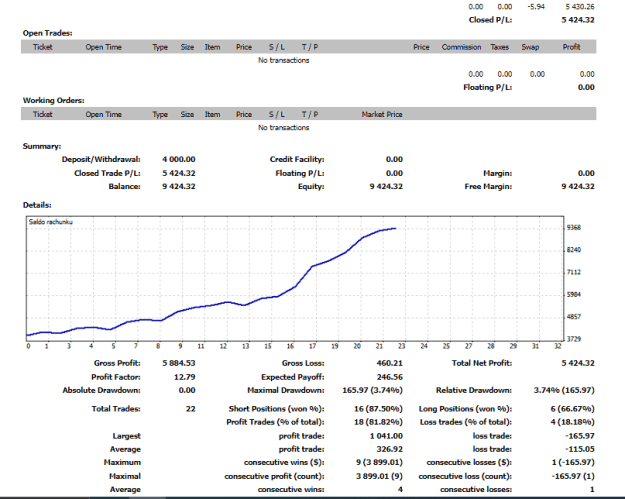
Also thanks to Mapi. I have been working with ikarus for some time. For me, the best versions are the ikarus 4.73 flex ATR. And 4.73 flexART 2022 june 22 Ikarus 4.73 flexATR after 2 months of work image Ikarus 4.73 flexATR 2022june22 after a month ...
Free Grid EA Ikarus - From zero to hero
- Jarass1080 replied Dec 13, 2021
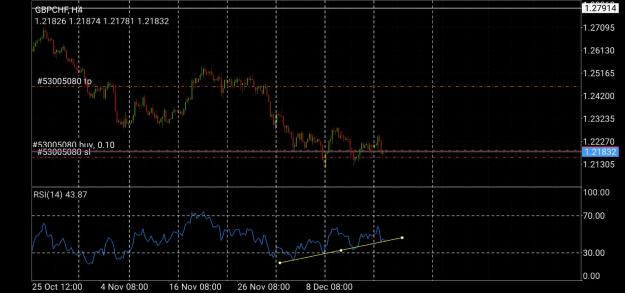
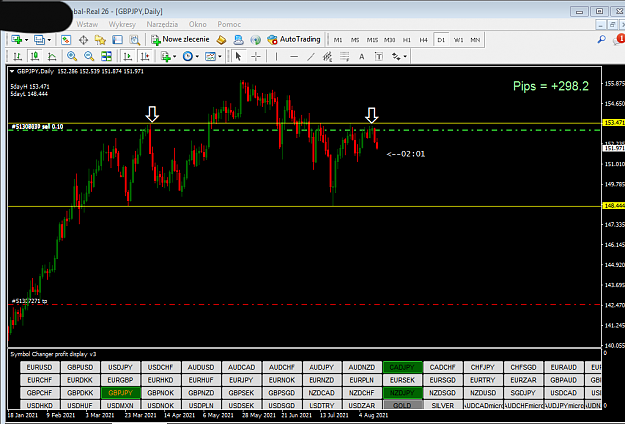
*********************************** You think Gbp Chf is ready? image
Intraday Trading - Live!
- Jarass1080 replied Oct 2, 2021
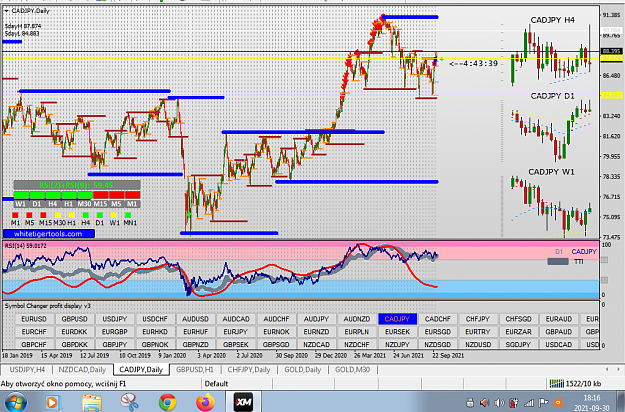
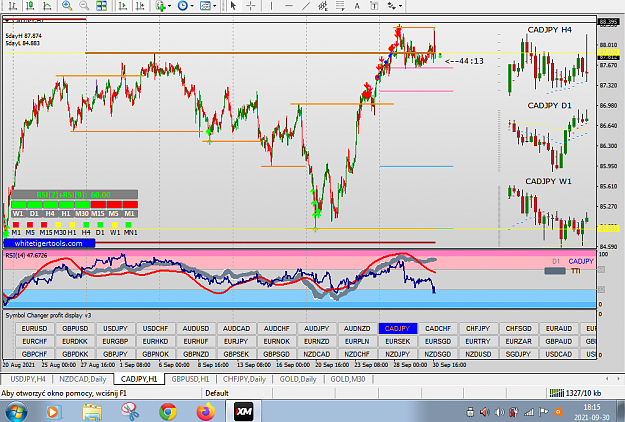
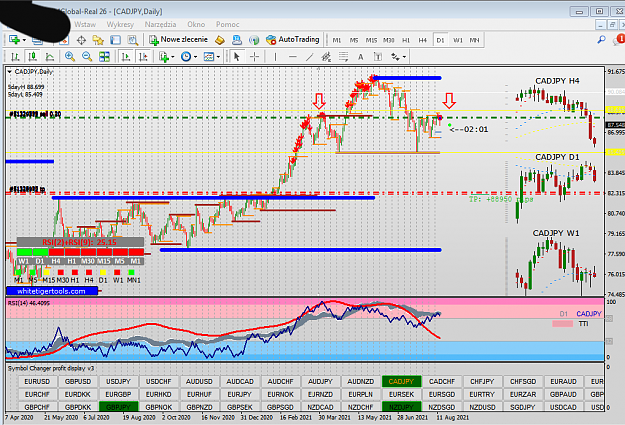
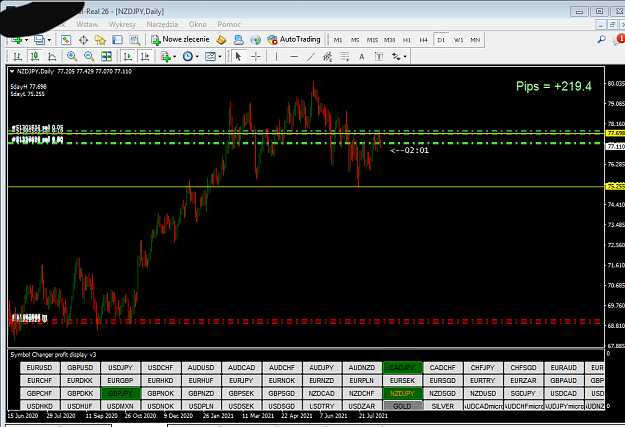
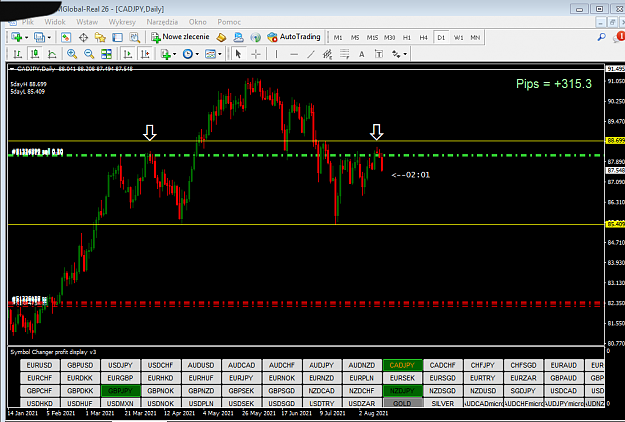
There is also a cad jpg in a downtrend. as shown in 1D interval. the 1h interval also shows a good selling position in the long run image image
Daily Trading Strategy [ADR + RSI = High Probability]
- Jarass1080 replied Oct 2, 2021
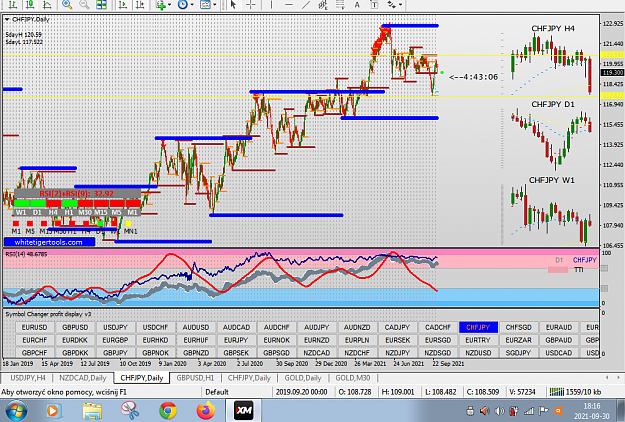
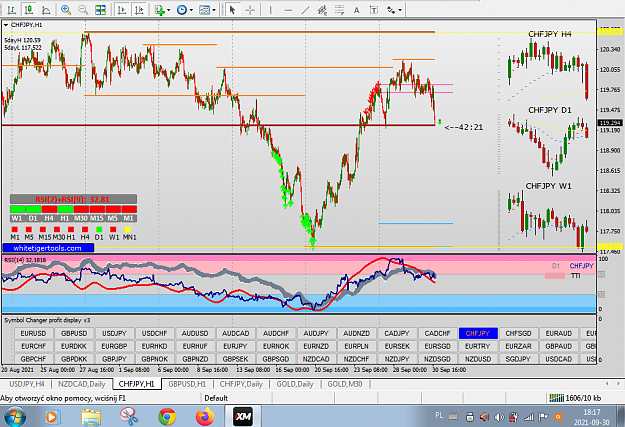
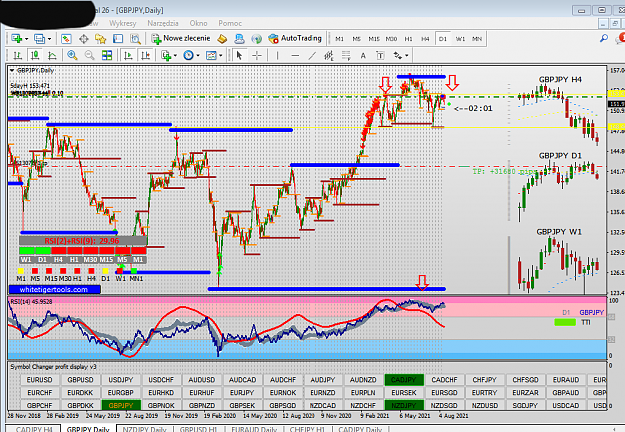
Another very interesting pair is chf Jpy. is already in a downtrend as shown by the 1D interval. When it comes to hooking up to the trend, we need to look at the RSI indicator. with an interval of 1 hour image image
Daily Trading Strategy [ADR + RSI = High Probability]
- Jarass1080 replied Oct 2, 2021
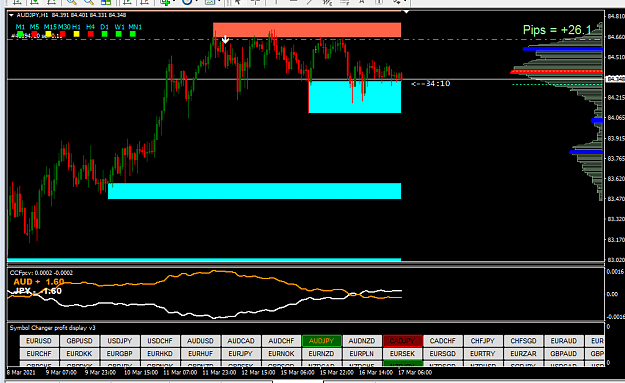
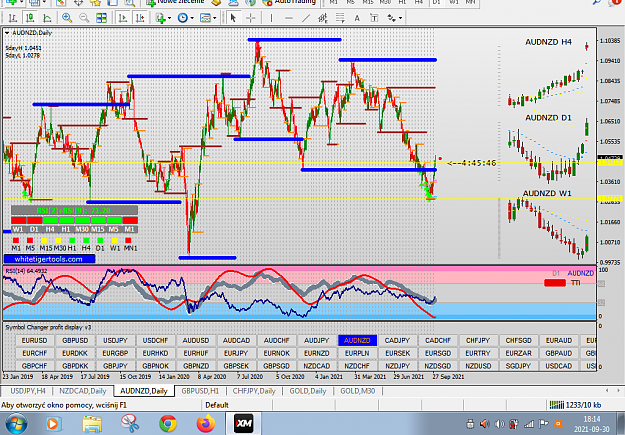
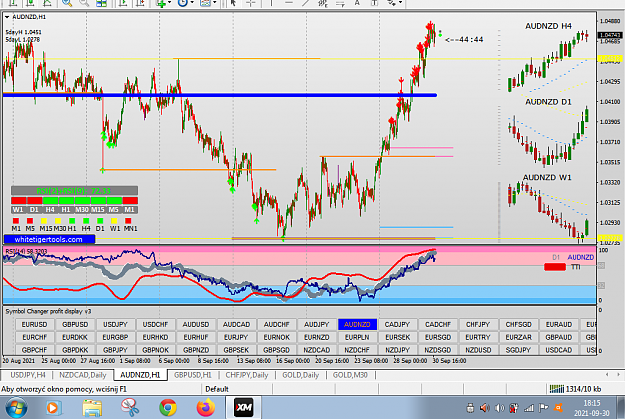
Hi First thing i can show. couple from aud Nzd. is at the end of the downtrend as shown by the 1D interval. this is the last moment of the sale of aud Nzd. What the 1h interval shows. image image
Daily Trading Strategy [ADR + RSI = High Probability]


- Jarass1080 replied Apr 2, 2021
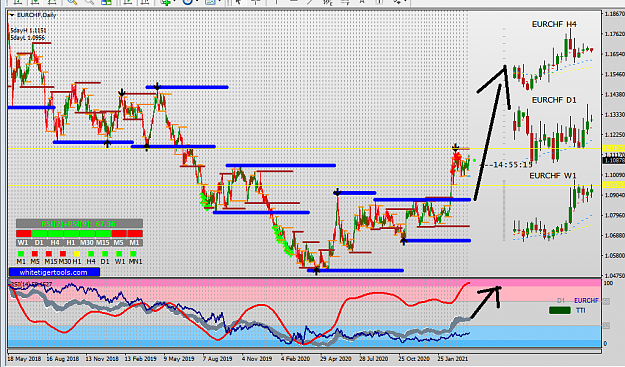
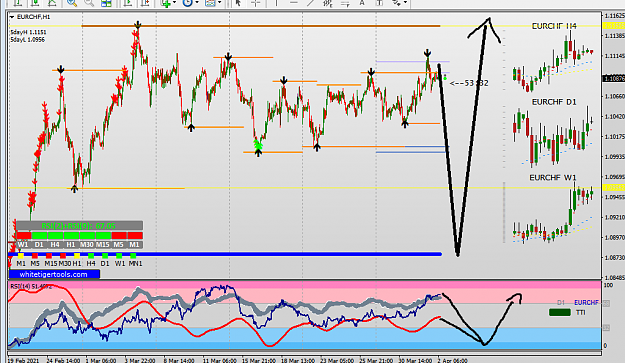
eurchf looks interesting 1D image 1h image
Daily Trading Strategy [ADR + RSI = High Probability]
- Jarass1080 replied Apr 2, 2021
As for changing the trend, it is very important that the 1W candle is not standard. often it is as price comes to a key place, the market reacts. image
Daily Trading Strategy [ADR + RSI = High Probability]
- Jarass1080 replied Apr 2, 2021
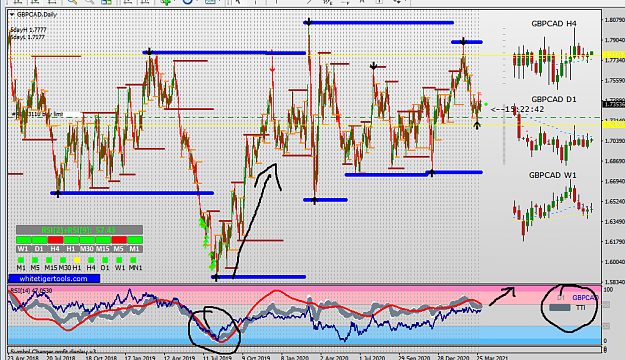
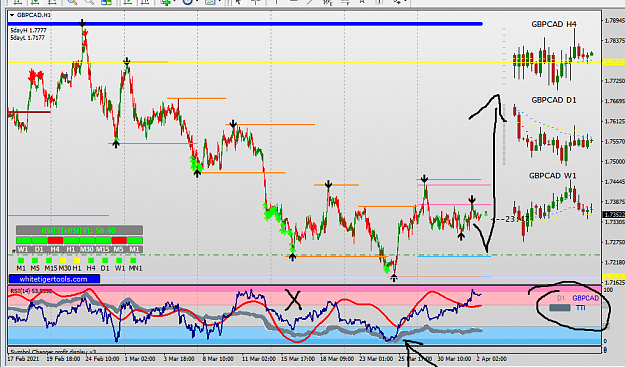
Gbpcad my pending buy limit order (I do not recommend placing pending orders). 1D image 1h image
Daily Trading Strategy [ADR + RSI = High Probability]
- Jarass1080 replied Apr 2, 2021
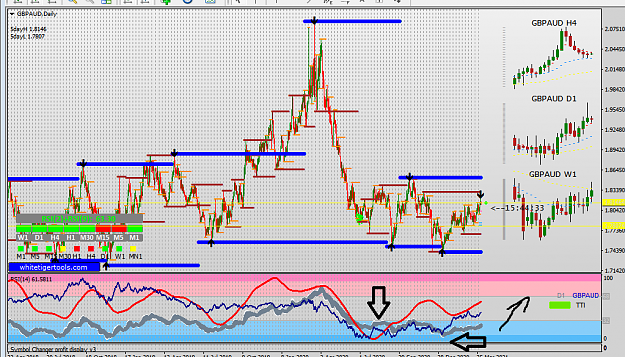
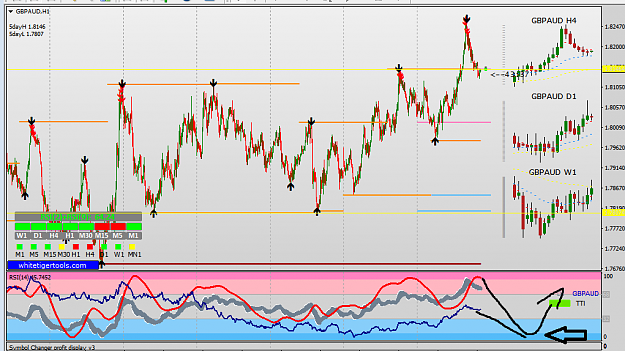
The gbp aud is upward trend, in the initial stage. 1D image so I look at 1h and wait until my RSI is at the bottom of the frame image
Daily Trading Strategy [ADR + RSI = High Probability]
- Jarass1080 replied Apr 2, 2021
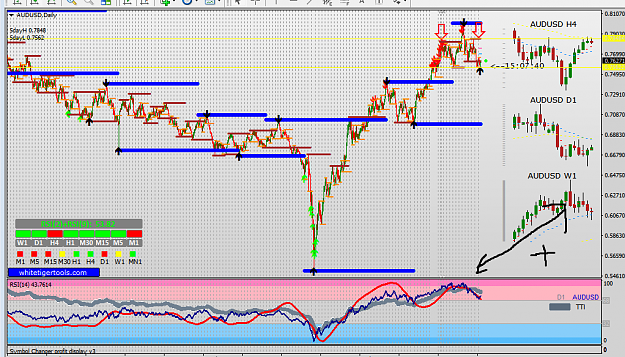
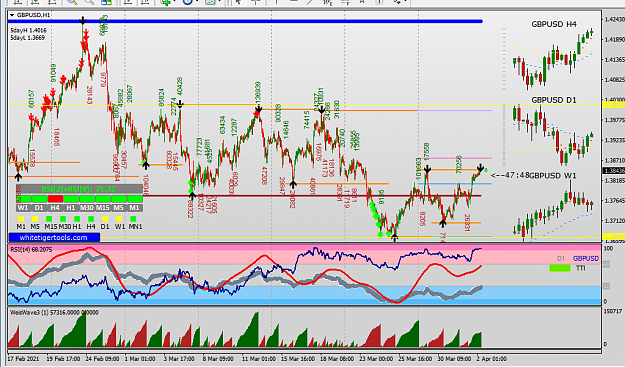
The most important is the RSI indicator at the bottom of the template. when we want to sell, the RSI lines must be at the top of the frame. And when we want to buy, all lines must be at the bottom of the frame. image
Daily Trading Strategy [ADR + RSI = High Probability]
- Jarass1080 replied Apr 2, 2021
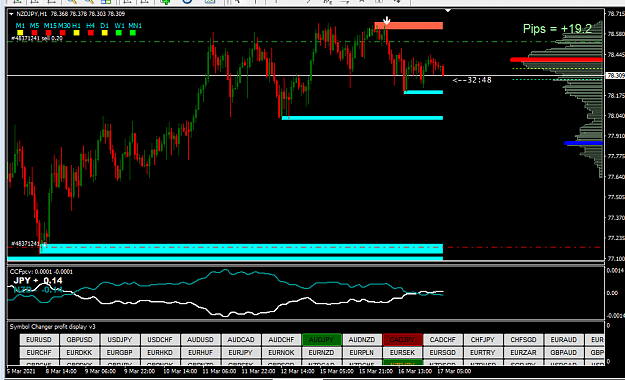
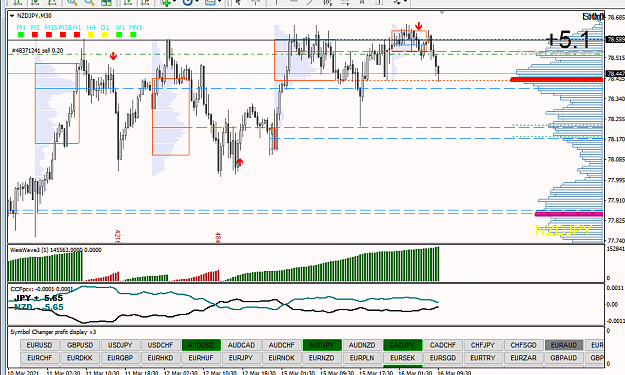
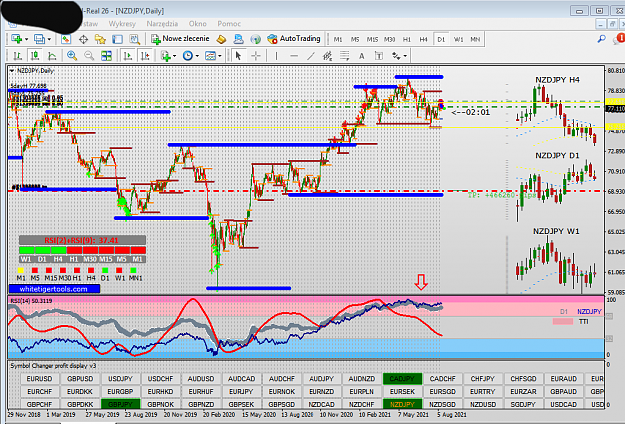
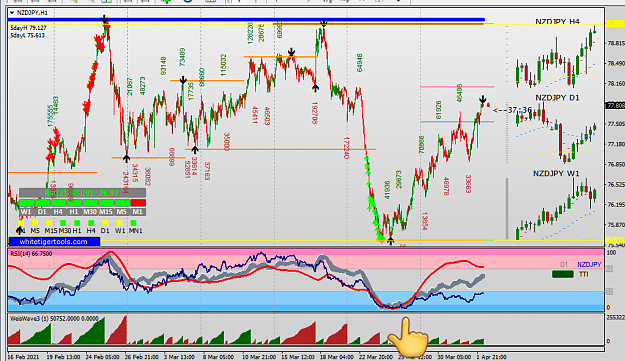
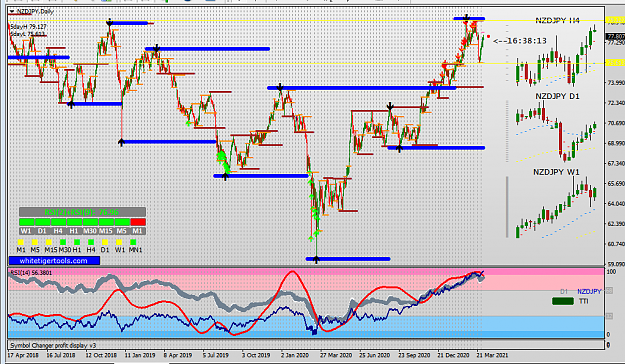
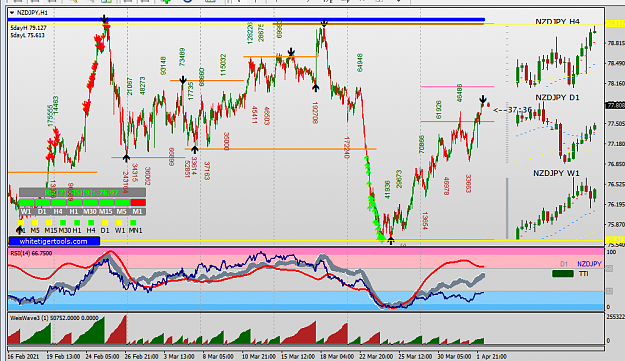
And this is how getting ready to change tred. 1D Nzd Jpy image And 1h to get the best open positions possible. image
Daily Trading Strategy [ADR + RSI = High Probability]
- Jarass1080 replied Apr 2, 2021
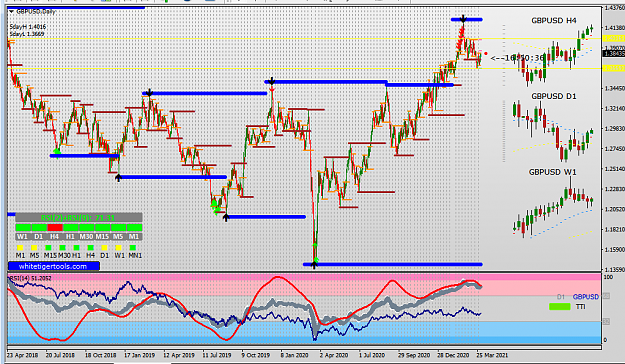
I think I can show it and talk a bit about it. To start with, to start looking for bargains, I look at 1D time pairs. On a special 1D template, I am able to assess the trend direction and whether the trend has just started or is ending and it looks ...
Daily Trading Strategy [ADR + RSI = High Probability]
- Jarass1080 replied Mar 17, 2021
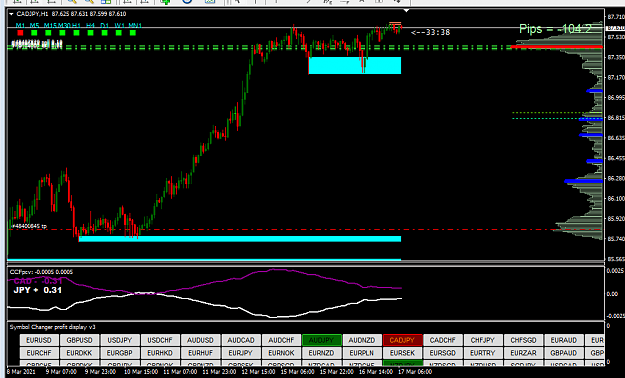
I'd like to thank you for your valuable trading tips. only one item yesterday is wrong. Now I know it's worth waiting for CCF. I did not live to see and now tire with cad jpy. ************** image And the rest is probably ok. How would you see and ...
On Point