- Search Metals Mine
- 135 Results
-
 Inzider replied Oct 20, 2009
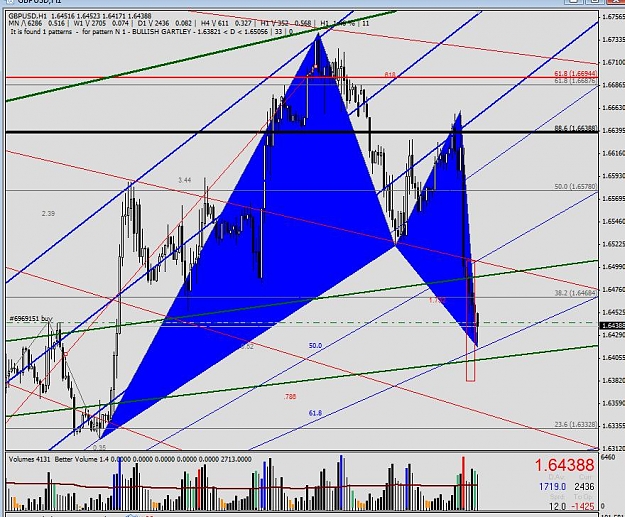
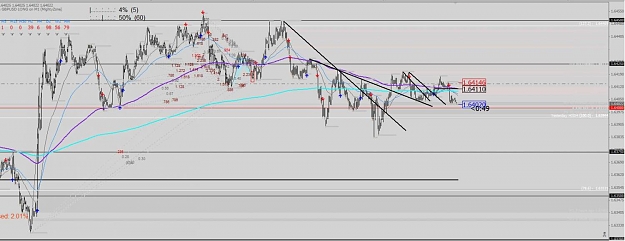
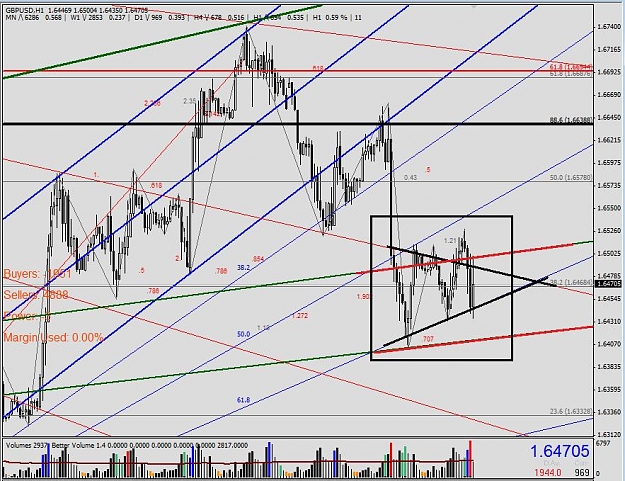
I see cable at 1.6514, even maby 1.6634 Or maby this is the end of the ride.... Waiting PA confirmation to get my ticket! Let's see!
Cable Update (GBPUSD)

- Inzider replied Oct 19, 2009
I see cable at 1.6514, even maby 1.6634 Or maby your right on this is the end of the ride.... Waiting PA confirmation to get my ticket! Let's see!
The WoRmHoLe

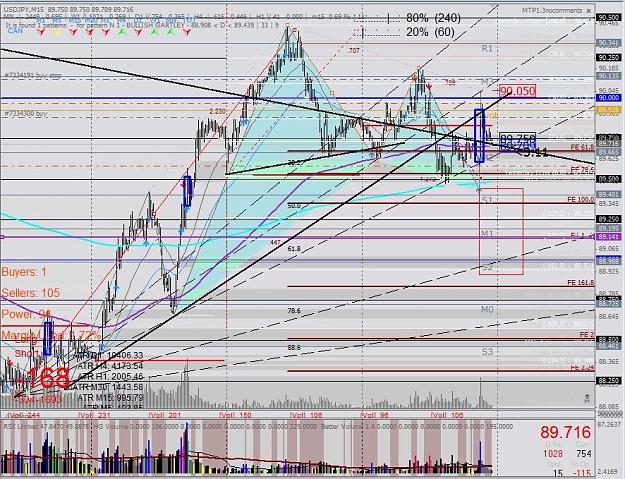
- Inzider replied Oct 13, 2009
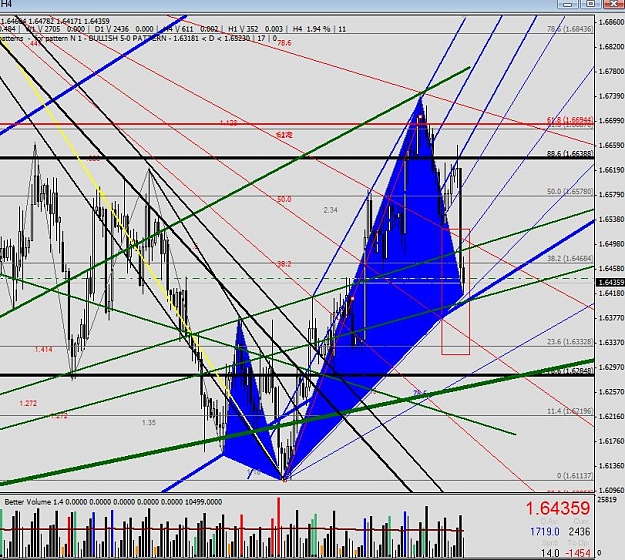
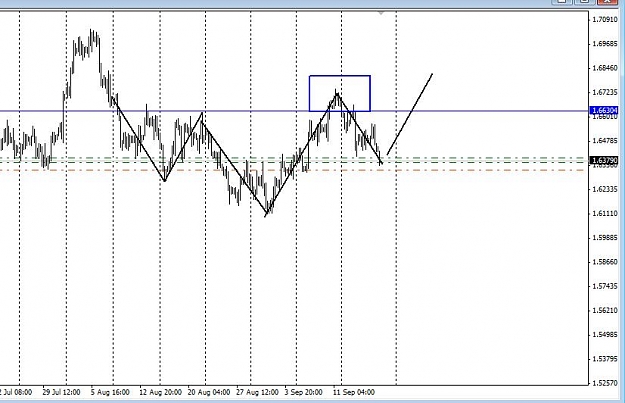
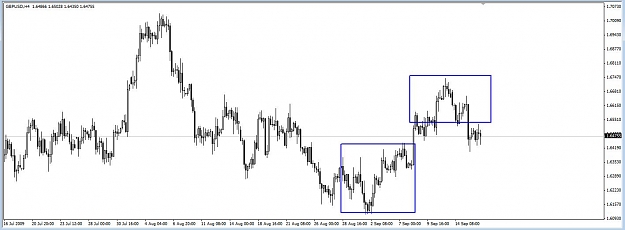
Blue square are Volume extremes bars in last 3 days..... All up bars, at higher levels! Have a look! Again, I can be wrong, but reading this make me think...
USD/JPY Discussion
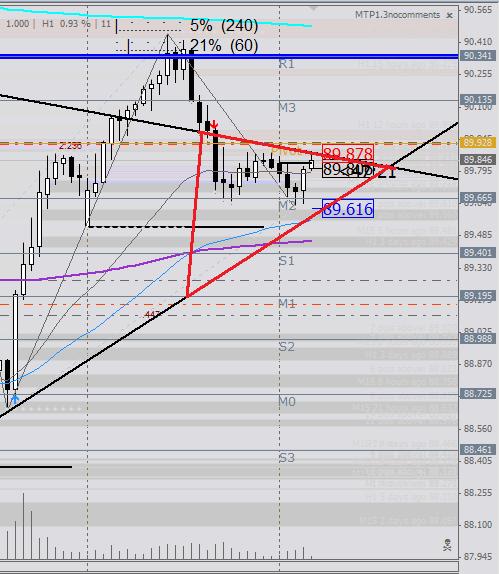
- Inzider replied Oct 12, 2009
1h or 4h close over upper trendline will motivate me. Still flat! ------------ Sometimes you only see what you want to see, and miss the rest!
USD/JPY Discussion Last 15 bar is a pin whit high volume...
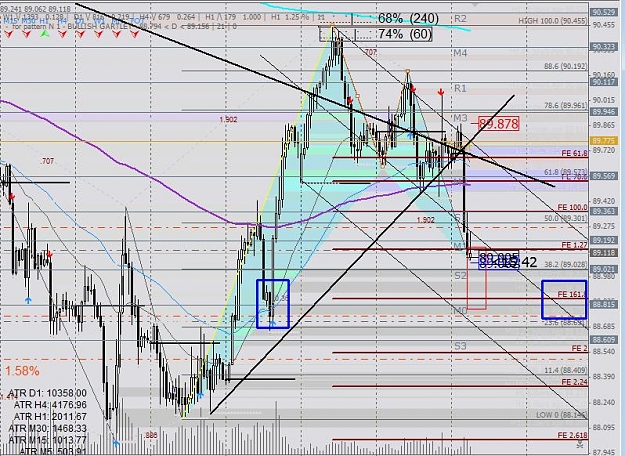
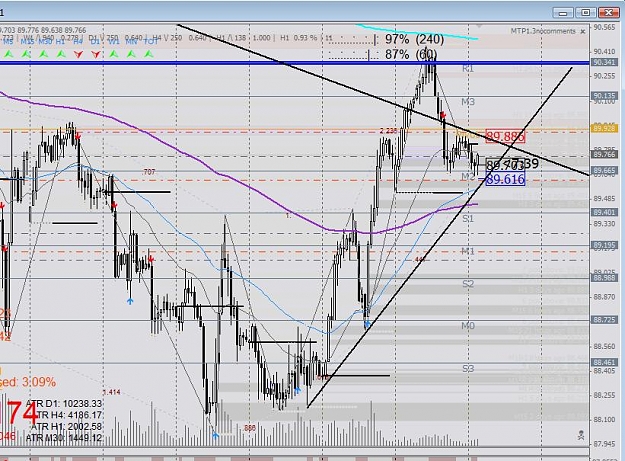
- Inzider replied Oct 12, 2009
Let's see if this 1h can close over 75. Keep in mind we are still into the bearish down channel.... whit the lower trendline lying just under the price. Exiting this triangle should solve the question. Let's wait!
USD/JPY Discussion
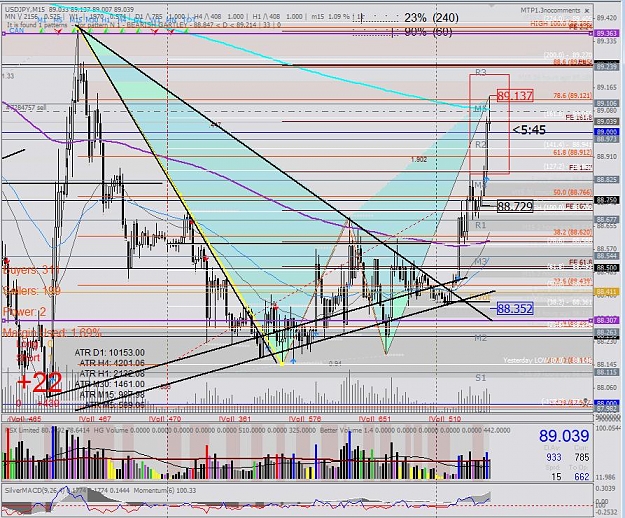
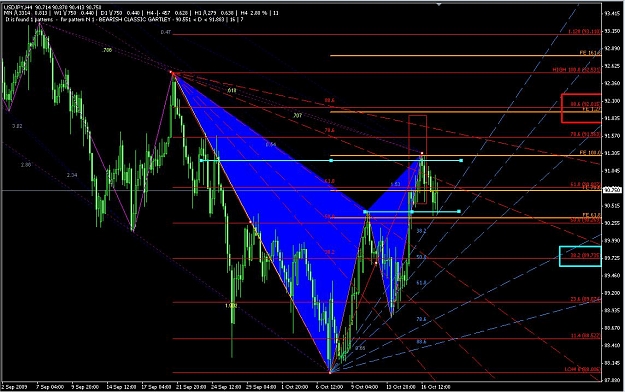
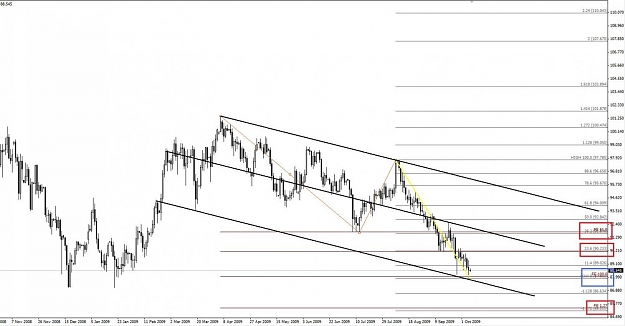
- Inzider replied Oct 7, 2009
AB=CD to the dime at 88.09 complete. Option 1-Correction at FE 718 (90.22) or 618 (91.7) in confluence whit fibs 23.6 / 38.2. 2-Extension at FE 1.27 at 85.45 Good trade all!
USD/JPY Discussion


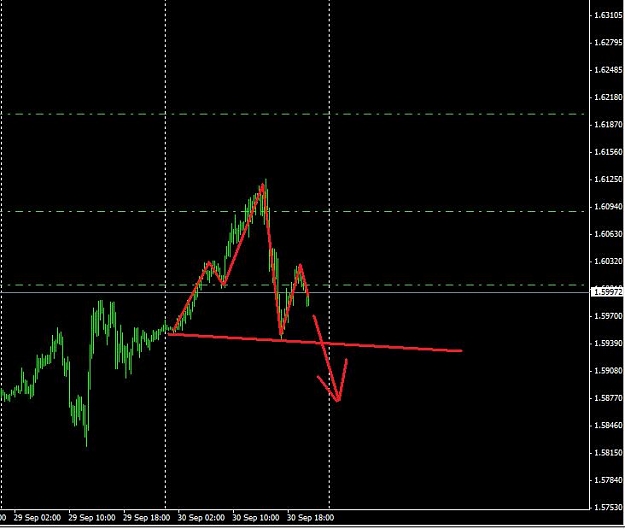
- Inzider replied Sep 30, 2009
Weird H&S on 15.... Broking 50 and we free fall...
Cable Update (GBPUSD)
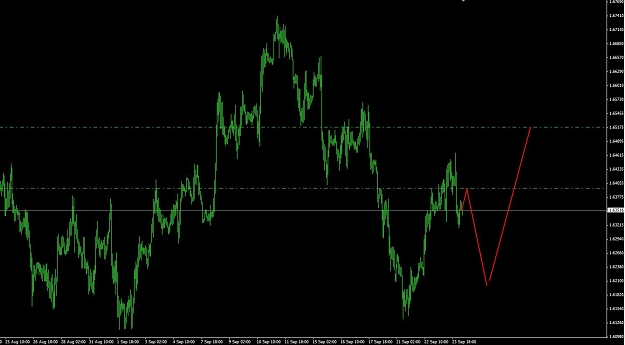
- Inzider replied Sep 23, 2009
see how price travel from bucket to bucket and sometimes block on an old breakout point at return: Take care later!
Cable Update (GBPUSD)
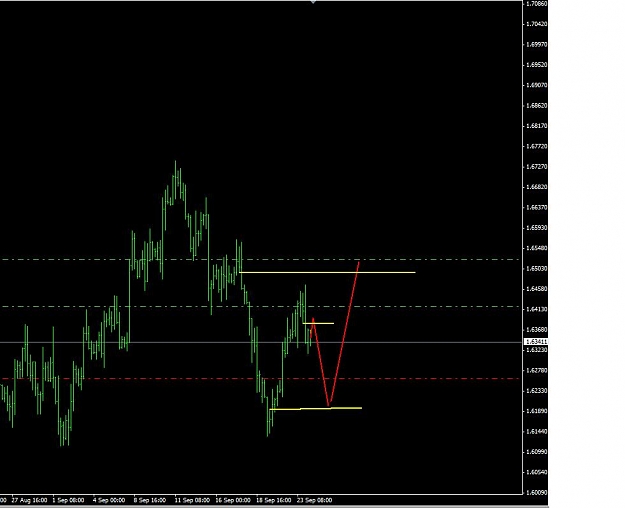
- Inzider replied Sep 23, 2009
It should visit 1.6396 then 1.6262 then we'll see, maby 1.6510 but its too soon. 1.6396 will make us a gartley on the top, then 1.6262 a gartley on the bottom. 4h chart. Have fun! _________ Malcom you can shoot me: its a 2 side call - OH NOOO!! LOL ...
Cable Update (GBPUSD)
- Inzider replied Sep 23, 2009
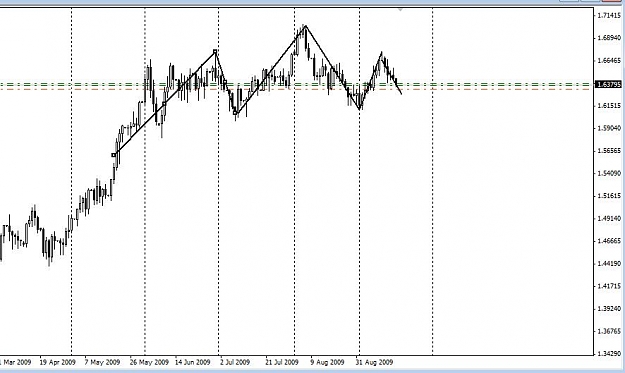
The chart is making a slow down trend until 20 is broken. Could look like a round top... in fact its ranging at top, kind of a flag.
Cable Update (GBPUSD)
- Inzider replied Sep 23, 2009
I do, its fractal things. All chart, same pattern... going for 7 pips or more, most of the time 12 to 22. Making 5 to 10 trade a day you can get a 100 pips... The idea is to take the bounce of the return at breakout point and bucket... url Anyway ...
Cable Update (GBPUSD)
- Inzider replied Sep 17, 2009
Daily then 4h See that 4h head move went over left sholder, witch valide more pressure on up side. Daily haven't push that far... Maby i'm dreaming, i dunno. Tell me what you think plz !
Cable Update (GBPUSD)
- Inzider replied Sep 16, 2009
TRAPPPPPP! And its only 1h, 4h is looking even more trap in between last 2 swing and the whole panorama of trendlines...! ----------- I'm going to walk to dog.... LOL
Cable Update (GBPUSD) Instead of flipping coins...

- Inzider replied Sep 15, 2009
Azim!!!! I usualy scalp the lady since she don't want to give me all her love in once. But yesterday I felt weak and shorted the 1.6650 line before my nap. Love took my mind away!... But I slept well, and I woke up now feeling like to sing under the ...
Cable Update (GBPUSD)