- Search Metals Mine
- 18 Results
- Forex147 replied Mar 14, 2016
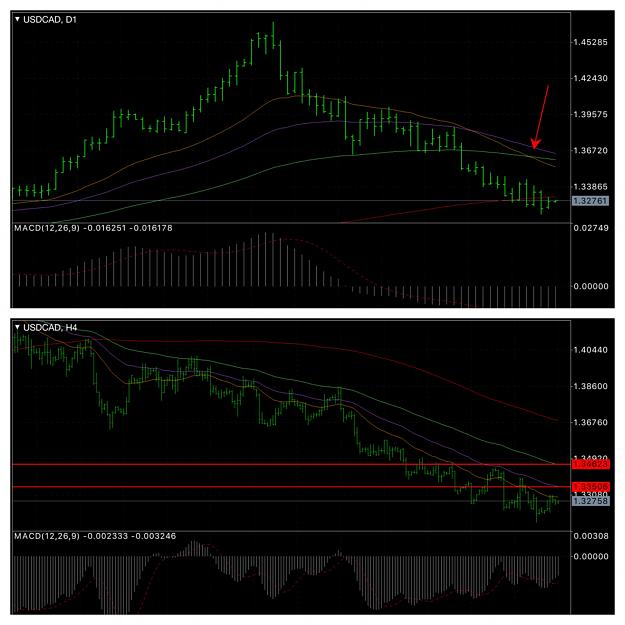
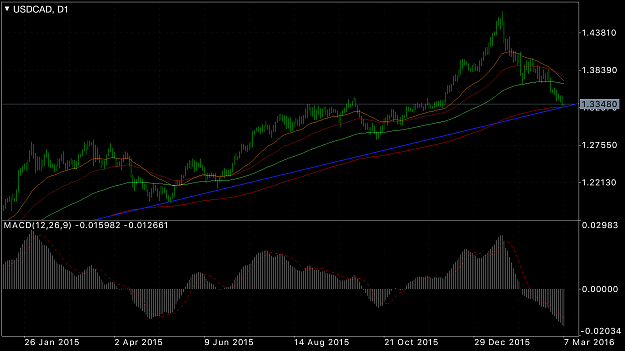
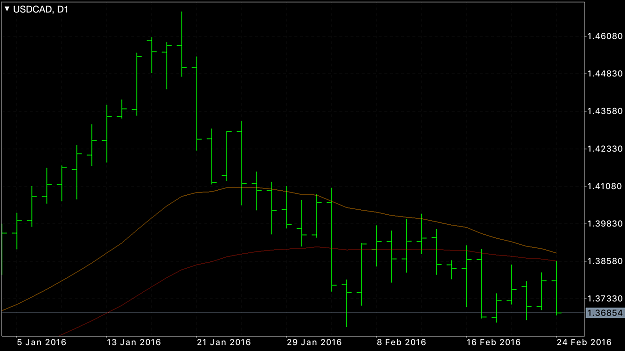
Usd/Cad: Main Trend is down and looking into the daily chart you will notice that 26 day MA (golden) has crossed under the 100 MA ( green) which is bearish sign, but down move looks exhausted for the time. Looking into the H4 look for the sweet zone ...
Forex Made Millionaire Thread for Blog Swing Trades
- Forex147 replied Mar 14, 2016
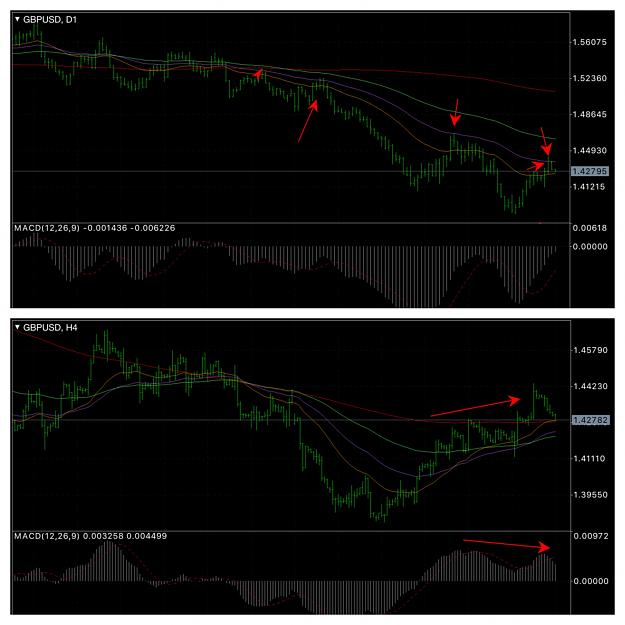
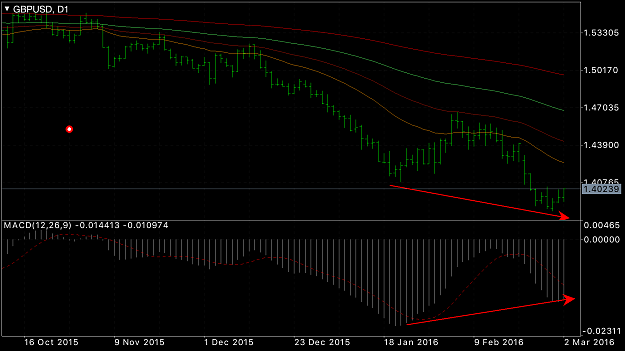
Again Gbp/Usd has a similar outlook to that of GJ. As looking into the weekly and daily charts , the major trend is down and the past previous move is a correction. As shown into the daily charts prices retraced to the 52 day MA and just pushed ...
Forex Made Millionaire Thread for Blog Swing Trades
- Forex147 replied Mar 14, 2016
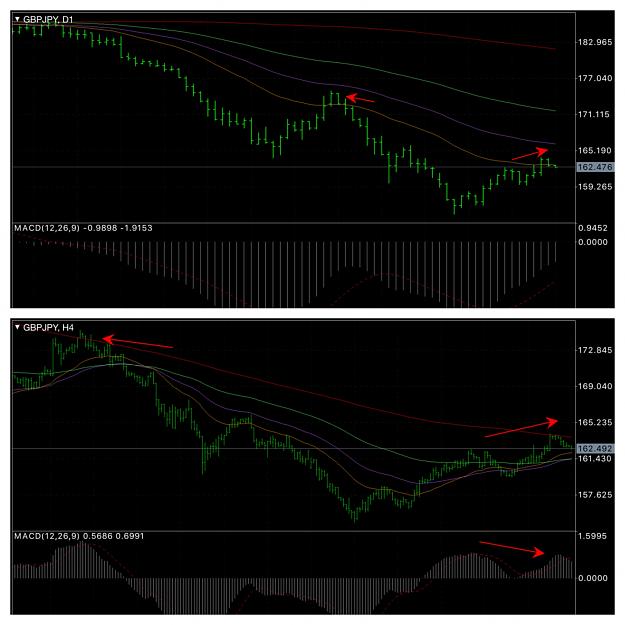
Well SVARG, thank you for being interested in my outlook . I will try to post one by one... As for GJ I think as we agree from the daily charts that the trend is down, and all this past up move was a healthy correction to the downtrend. H4 shows ...
Forex Made Millionaire Thread for Blog Swing Trades
- Forex147 replied Mar 9, 2016
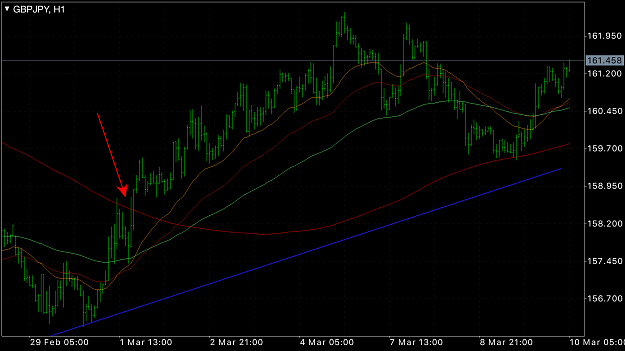
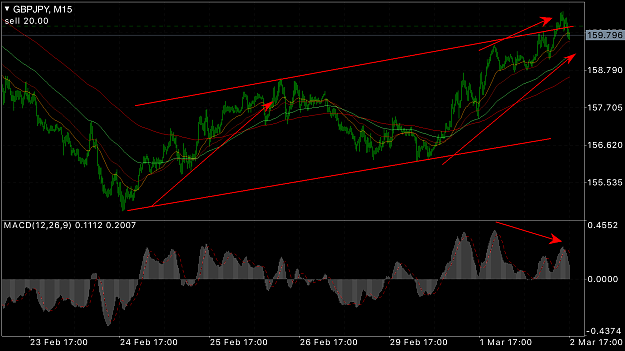
Is the Dragon poised to continue the upmove??? image At the start of the week, and as mentioned on Geppy's report, most of us were either long or waiting to get long on the 160.xx area which happened and Prices went up but couldn't go break 38 fibo ...
Forex Made Millionaire Thread for Blog Swing Trades
- Forex147 replied Mar 7, 2016
Here is UC daily, I use eMA and it is giving me same result as Geppy's. And there is also the blue trend line. Double Resistance.
Forex Made Millionaire Thread for Blog Swing Trades
- Forex147 replied Mar 7, 2016
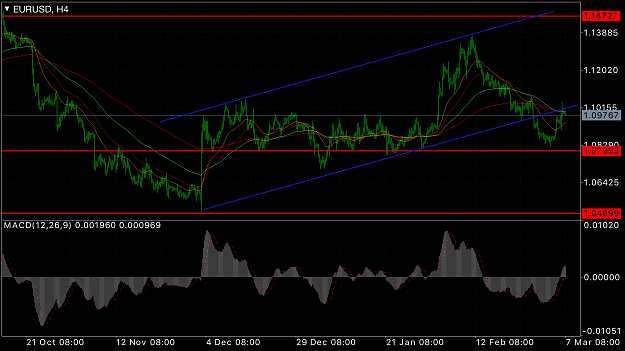
I'm looking for a long position hopefully when prices retrace to the 1.0960-1.0940 area, or prices goes back into the channel as per chart attached. initial target 1.12 area., with SL under hourly MA. I just noticed that your risk / reward ratio is ...
Forex Made Millionaire Thread for Blog Swing Trades
- Forex147 replied Mar 6, 2016
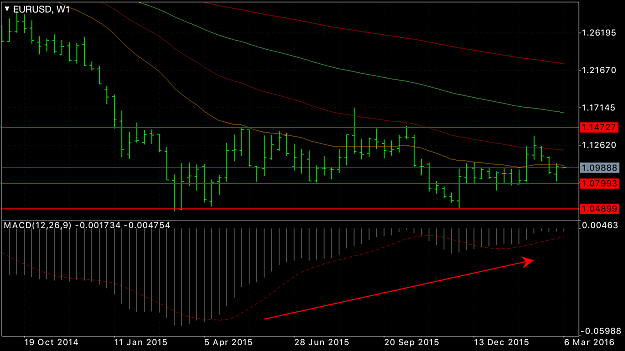
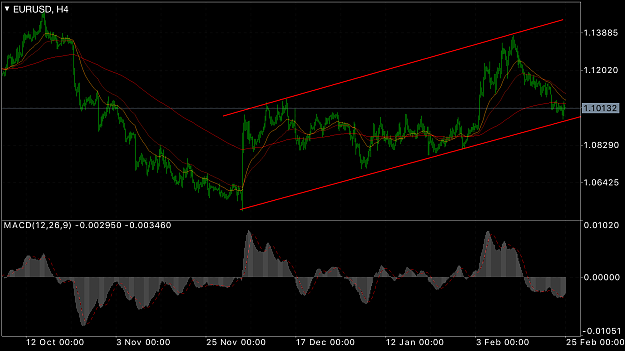
As I liked Geppy's weekly analysis here is some points I want to mention regarding the Euro/Usd: First point is that EU have been in a trading range since the low of 1.046 made on March 13 2015 and since that the big range was the 1.05 area and 1.14 ...
Forex Made Millionaire Thread for Blog Swing Trades
- Forex147 replied Mar 2, 2016
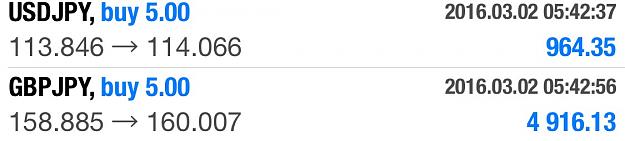
I didn't use the triangle ,but I did make the trade . Check photo.😜
Forex Made Millionaire Thread for Blog Swing Trades
- Forex147 replied Mar 2, 2016
It is alright as long as you have locked some profit into the trade.. Which channel you are talking about?
Forex Made Millionaire Thread for Blog Swing Trades
- Forex147 replied Mar 2, 2016
looking on this daily GU actually you will notice a bullish MACD divergence , and also GU haven't moved that much up since the last low. So it is only your mind bias that prices should go down that makes you so frustrated SulikFXer.
Forex Made Millionaire Thread for Blog Swing Trades
- Forex147 replied Mar 1, 2016
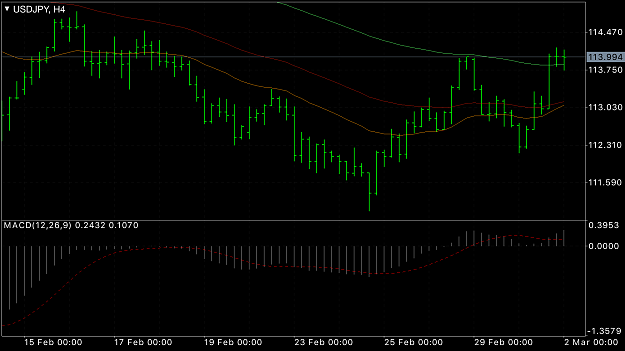
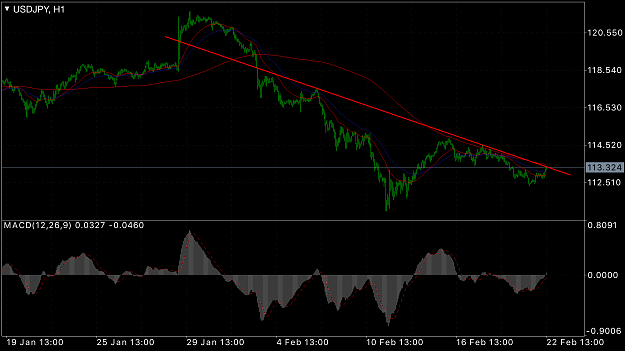
You will notice in this 4H UJ that prices tried to penetrate the green line( 100 day MA) at the point 113.95 and failed, and tried again and penetrated the line and now it acts as support. My second point is UJ was trending upwards for the 3 days ...
Forex Made Millionaire Thread for Blog Swing Trades
- Forex147 replied Feb 24, 2016
Eur/ Usd long I think a trade worth taking... What you think guys???
Forex Made Millionaire Thread for Blog Swing Trades
- Forex147 replied Feb 24, 2016
On the daily you will find prices retrace to the moving averages which is the perfect spots to add new shorts or intiate a new one.
Forex Made Millionaire Thread for Blog Swing Trades
- Forex147 replied Feb 24, 2016
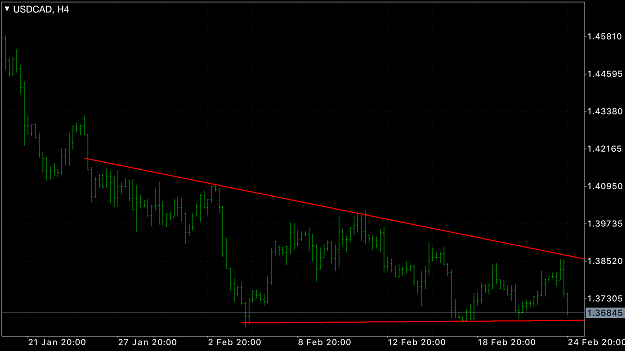
Here is my 4H CAD graph, prices have been within the downward channel.
Forex Made Millionaire Thread for Blog Swing Trades
- Forex147 replied Feb 22, 2016
I don't agree that U/J broke just yet. It is testing the upper wedge line and it coincides with 200 ma.
Forex Made Millionaire Thread for Blog Swing Trades
- Forex147 replied Feb 15, 2016
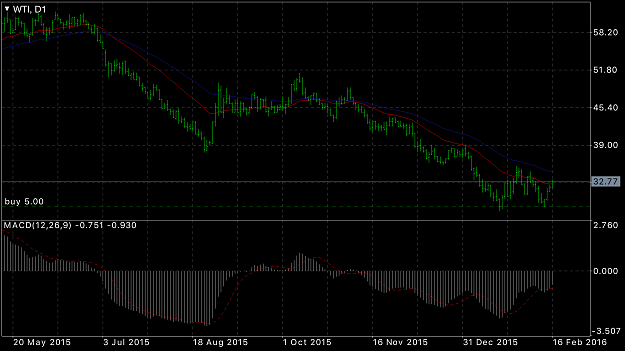
on the 11th I was fortunate enough to buy 5 contracts of Wti Oil almost at the bottom. The trade is making my week so far. Still holding.
Forex Made Millionaire Thread for Blog Swing Trades
- Forex147 replied Feb 11, 2016
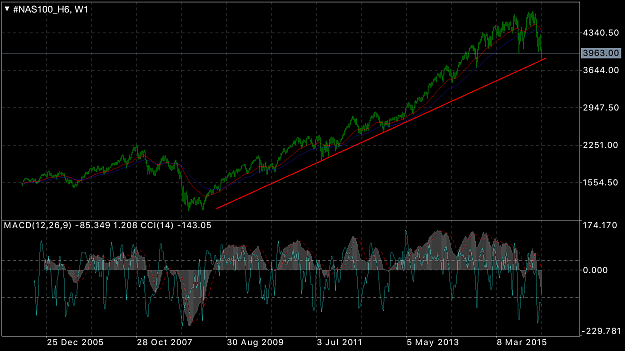
Yup . You are right. Folks just check the graph for Nasdaq futures. TL since the 2008 crisis been touched. Nice tail like reversal on the daily . Look for an up move.
Forex Made Millionaire Thread for Blog Swing Trades
- Forex147 replied Feb 11, 2016
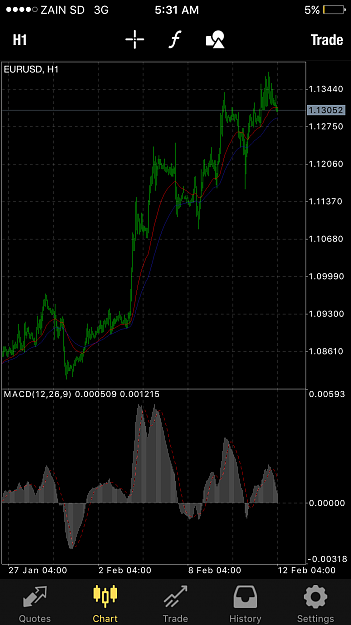
image I also think Eur/Usd has downward potential , if u look at H charts a clear macd divergence.
Forex Made Millionaire Thread for Blog Swing Trades
- Posts by Member Search: 'Forex147'