- Search Metals Mine
- 77 Results
-
 FT.Trader replied 6 hr ago
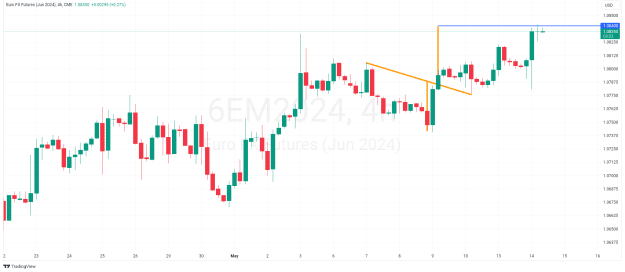
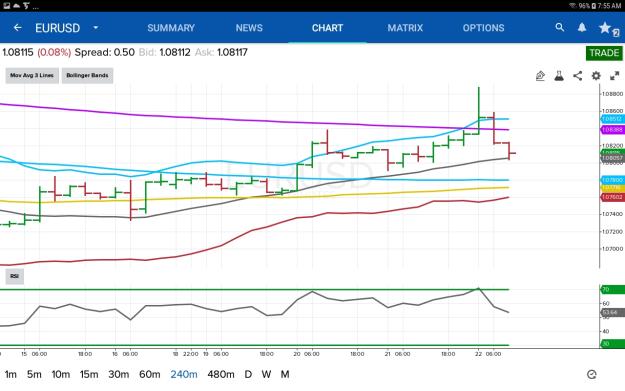
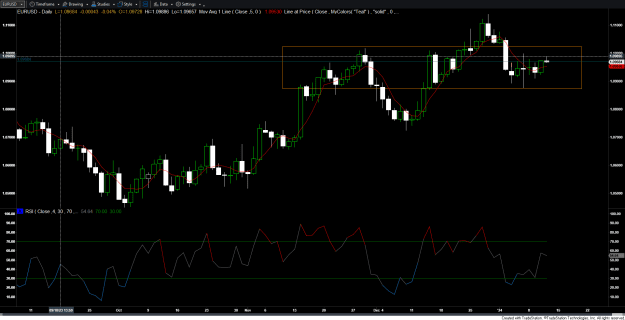
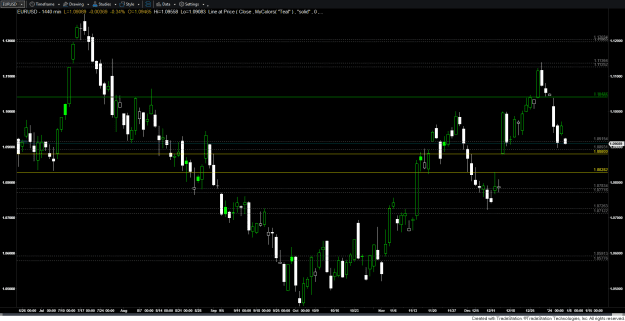
Euro FX Futures shown here. Wave up complete IMO. USD should strengthen. This should be bullish for WTI
Crude Oil
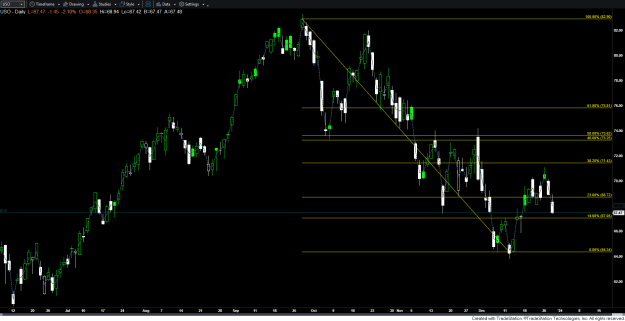
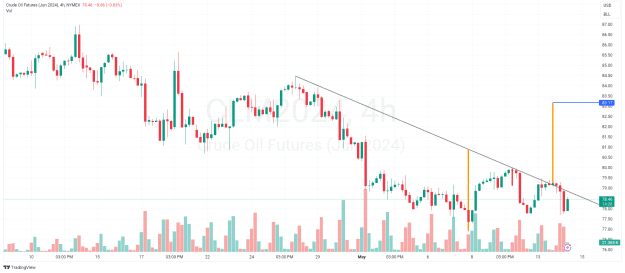
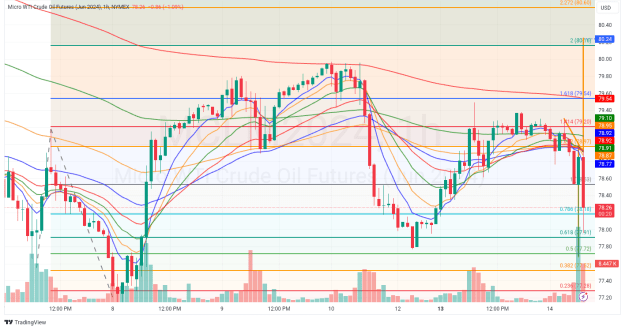
- FT.Trader replied 6 hr ago
As long as last weeks low holds, my swing target is around 83.17. I have a s/t target of 79.37 to reduce. There is a short term bullish bias in crude oil coming into the Memorial Day holiday. This should happen between this Friday to next Teusday ...
Crude Oil
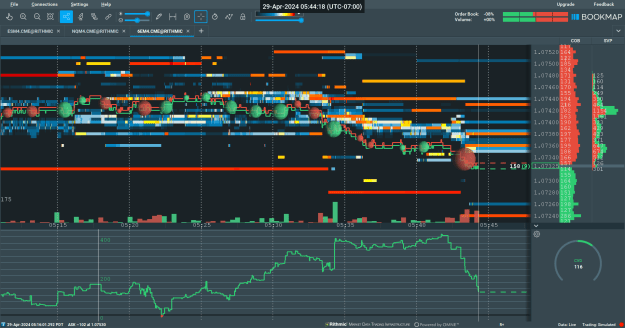
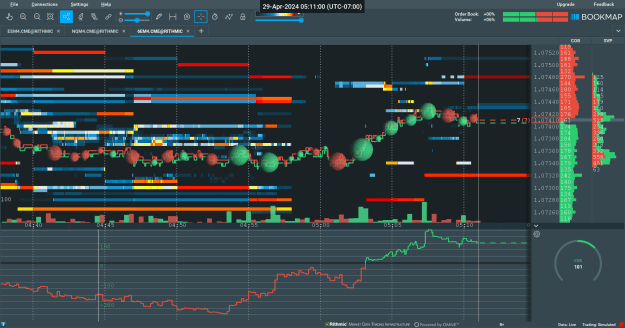
- FT.Trader replied Apr 29, 2024
This is a new subscription I'm trying out. You are looking at Level 2 options data for Euro futures. The heatmap shows liquidity for options, I'm trying to figure out if I can make money with this tool. It's called Bookmap
The Swamp
- FT.Trader replied Mar 1, 2024
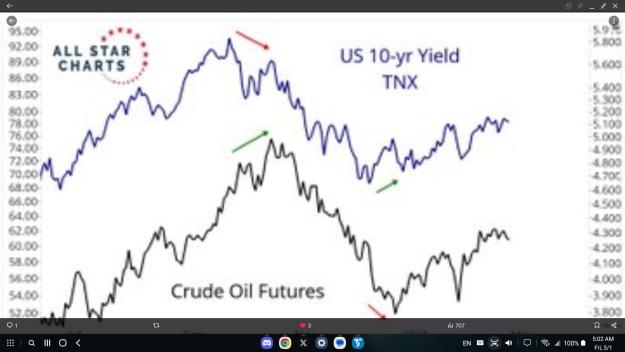
Thought this was interesting. I saw it on x Best money to be made is after a divergence
Crude Oil
- FT.Trader replied Feb 22, 2024
Target is the bottom of the Bollinger Band on the 4 hr chart
The Swamp
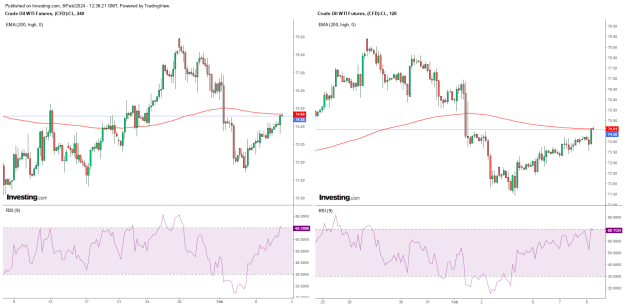
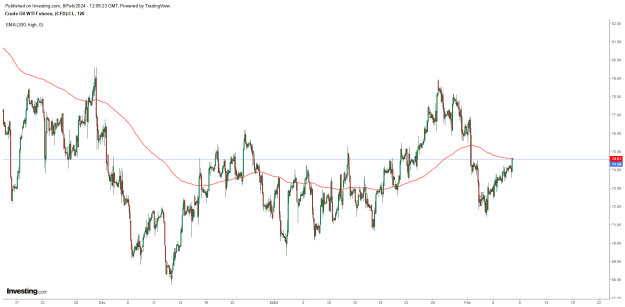
- FT.Trader replied Feb 8, 2024
Both the 240 min and the 120 min 200ema are in about the same place still hanging on to my shorts i'm not sure about the last time i saw wti act this orderly
WTI Crude Oil Trading
- FT.Trader replied Feb 8, 2024
the battle over 74.06 continues 72.46 seems like a better take profit
WTI Crude Oil Trading
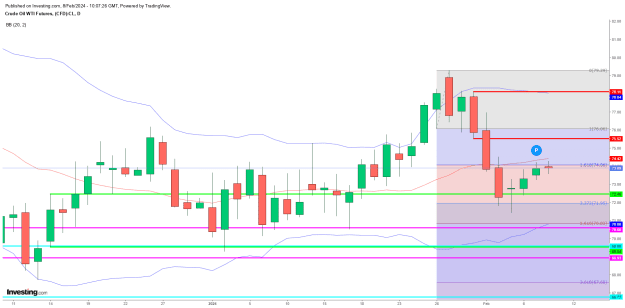
- FT.Trader replied Feb 8, 2024
i'm still short...looking to exit on a push down to the 214.6% retracement....72.36 ish There was one retest of this level but it was 2 hours before the ny session opened i think the large traders in ny will push it back down so they can buy at ...
WTI Crude Oil Trading
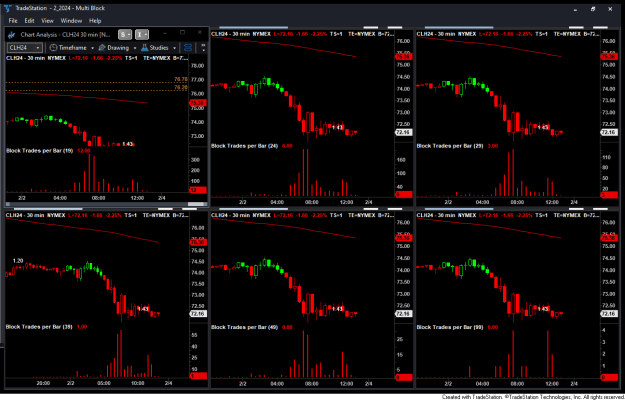
- FT.Trader replied Feb 2, 2024
This is a cool indicator that i just got i think it is is just as good or better than market profile 30 min chart with a blocks per trade indicator i have 6 identical charts with block trade settings at 19 24 29 39 49 and 99 blocks per bar the first ...
WTI Crude Oil Trading
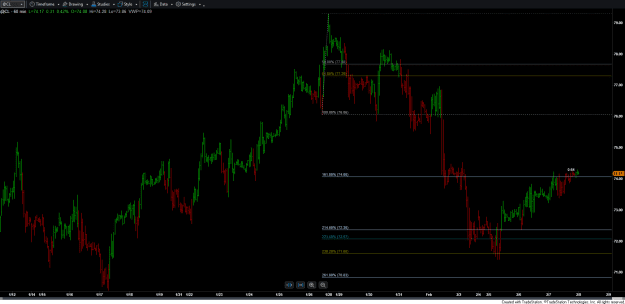
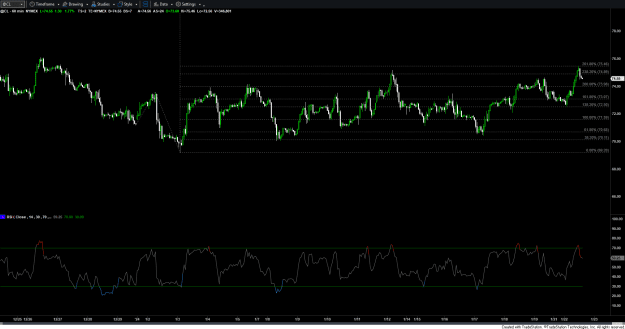
- FT.Trader replied Jan 22, 2024
the fib extension got it right today i got out at the 161.8% at 73 and change day high was 75.46 on the money 261.8%
WTI Crude Oil Trading
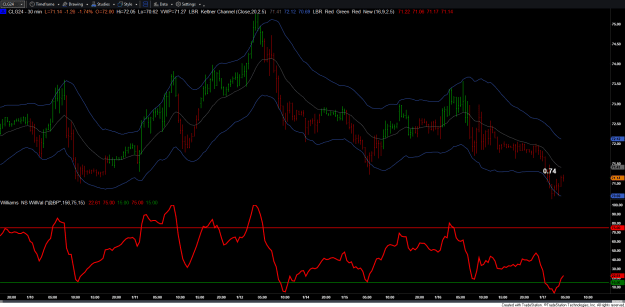
- FT.Trader replied Jan 17, 2024
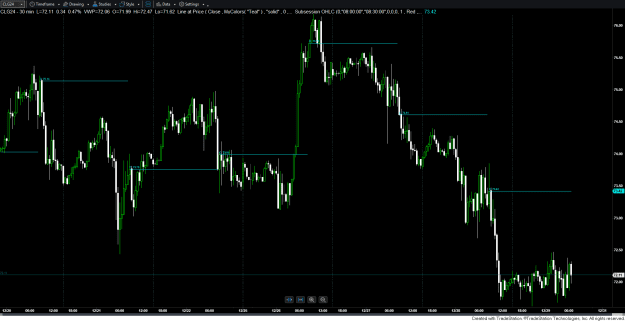
30 min CL chart with Larry William's wilval indicator set to cable gives good overbougt / oversold readings 20 period keltner set at 2.5 also does a pretty good job also
WTI Crude Oil Trading
- FT.Trader replied Jan 11, 2024
i lost money in this rectangle area during both nov and dec i'll be looking to trade the eurusd again after we leave my bermuda rectangle i had 1 winning trade in the euro this year it was a short on the first trading day this month
The Swamp
- FT.Trader replied Jan 5, 2024
i ws searching for an easier way to access london close eurusd data i noticed i can construct a daily chart that displays the london session only then i noticed the gaps looks like the europeans like to play "Phil D Gapp" also 0828 looks like a ...
The Swamp
- FT.Trader replied Jan 3, 2024
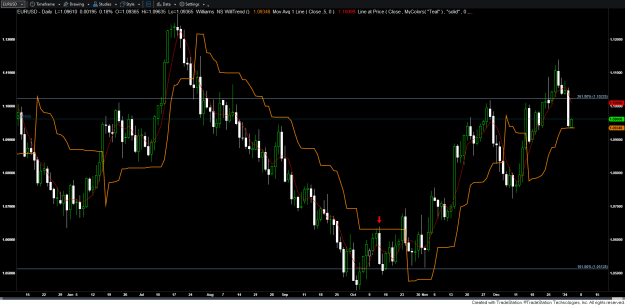
eurusd with larry williams willtrend looks like the euro is finding some support no position in euro...watching short silver long wti
The Swamp
- FT.Trader replied Dec 29, 2023
the cyan line is the London Close (LC) there are 3 days this week that there has been no retest either the market is extremely weak or we are headed straight back up looks like the europeans are getting left in the dust
WTI Crude Oil Trading
- FT.Trader replied Dec 28, 2023
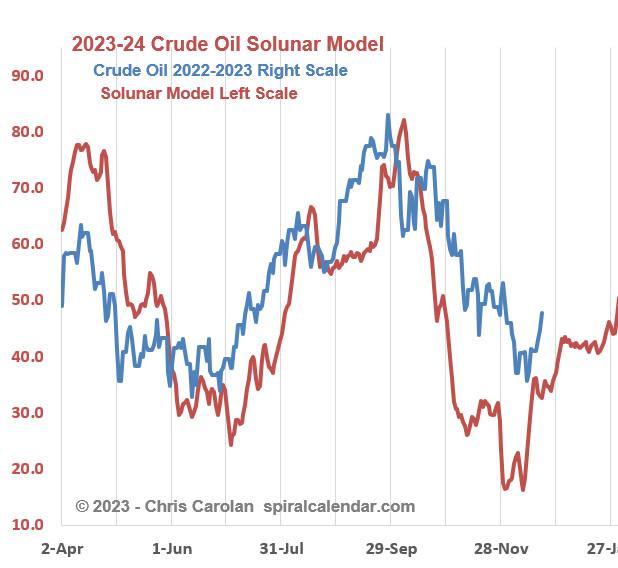
chris carolan posted his seasonal projection on x this is one of the models i look at it has done well the last year
WTI Crude Oil Trading
- FT.Trader replied Dec 28, 2023
i will be willing to give it until the 14.6% on this retracement
WTI Crude Oil Trading