- Search Metals Mine
- 21 Results
-
 Delite replied Oct 17, 2011
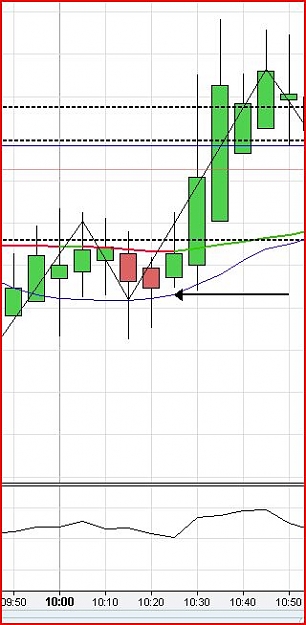
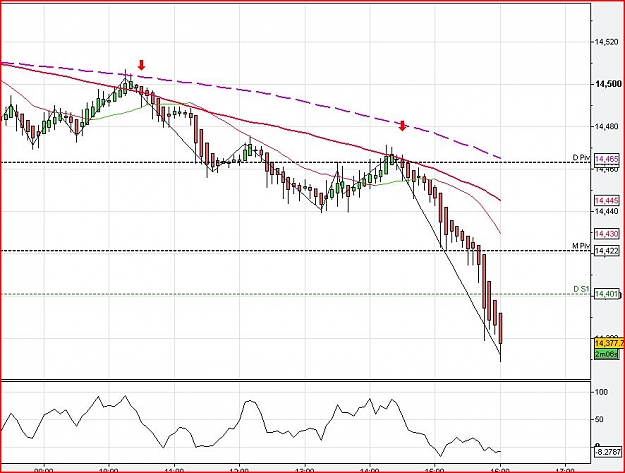
Okay. The red horizontal line represents the close of the 1hr shooting star. as you can see, the 10.20 M5 candle closes below it and so entry would be one pip beneath that candle.
Higher low, lower high system
- Delite replied Sep 22, 2011
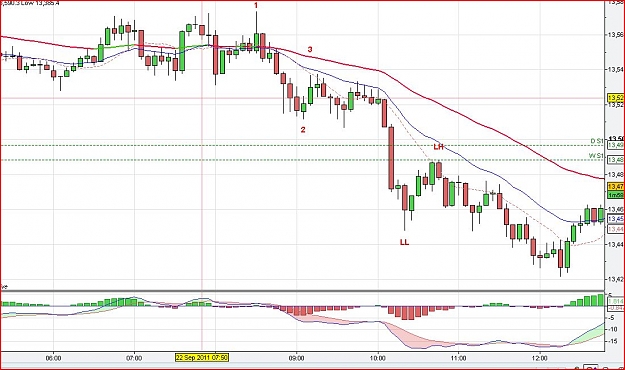
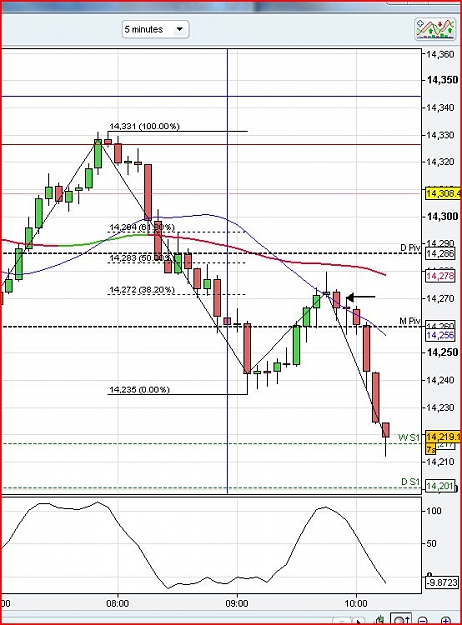
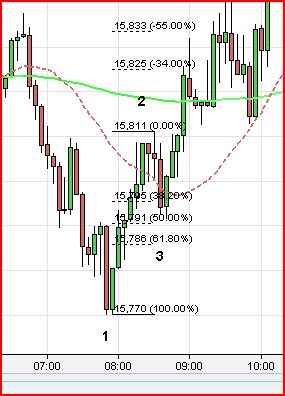
Hi Darryl May I offer an opinion? Looking for 1-2-3 pattern, I think you need to see a HL, H, LL, LH for a short or the opposite for a long. In defining those swings, then a definition from Strat's thread is quite helpful - "For confirmation of a ...
Flag trading the trend
- Delite replied Aug 10, 2011
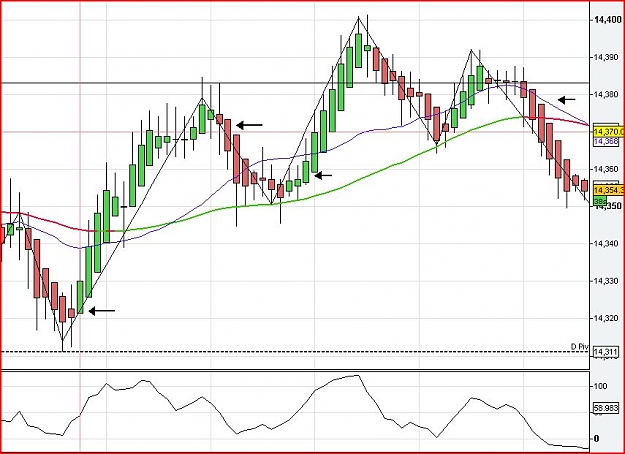
To illustrate my question above I attach two charts. The first one shows, via the black arrows, the type of candle I mean. It has no upper wick in a down trend and shows momentum to carry on down. The second, is one illustration from yesterday's ...
Price Action Trading with Indicators! The Freebie System
- Delite replied Aug 8, 2011
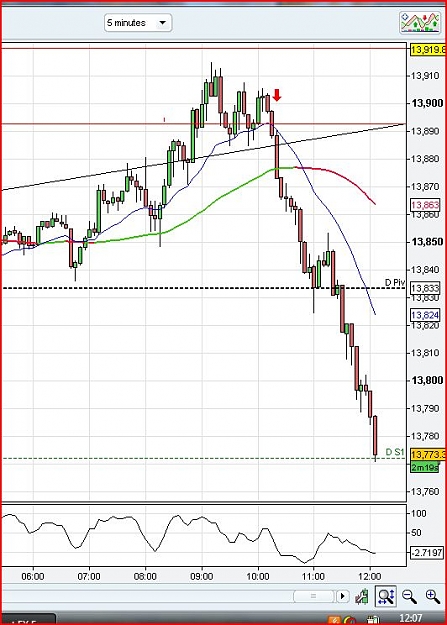
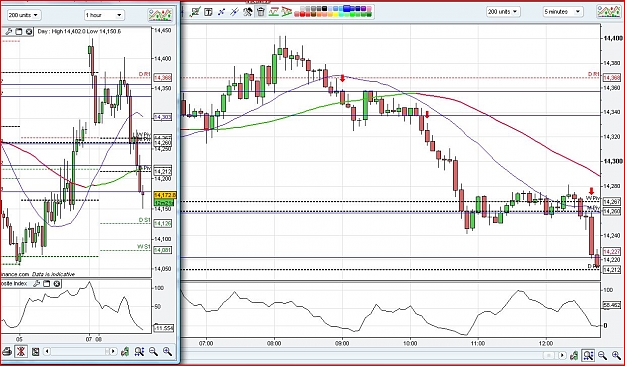
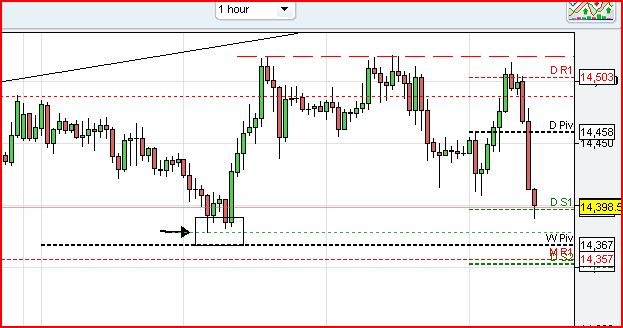
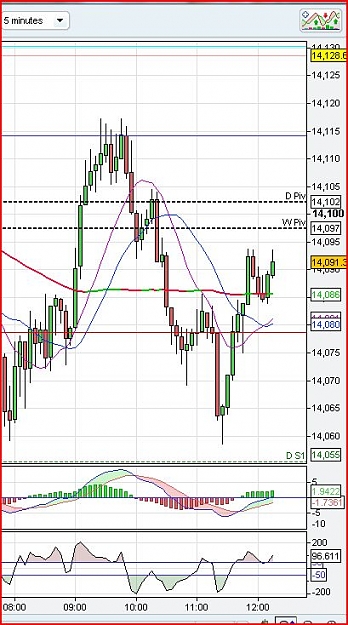
So, I hope this makes sense... I am posting an hour chart and a M5 chart. The blue line represents the close if the H1 Candle. So when the M5 chart shows a pullback then closes above/below the the cloes of the H1 candle, then you join at the break ...
Higher low, lower high system
- Delite replied Aug 4, 2011
Okay. Really kicking myself for having not taken this, but would appreciate some feedback on the interpretation of the H1 and M15 candles on the EU chart. Firstly there was a strongly negative 8am candle. So, from 9am we are looking for a pullback ...
Psych Levels, Pivots, and Trendlines - Resurrected
- Delite replied Aug 1, 2011
Cool! It was also a trendline break on the M5 chart.
Psych Levels, Pivots, and Trendlines - Resurrected
- Delite replied Jul 27, 2011
Two trades on EU M5 today. First one taken as rejection of 14500 level - exited at Daily Pivot. Second entered at rejection of Daily Pivot and exited at Monthly Pivot. Both trades had confluence with the m15chart printing a zigzag at the same point. ...
Price Action Trading with Indicators! The Freebie System
- Delite replied May 16, 2011
This is a great system, and while I do not want to move away from its simplicity I would like to add one thought. The use of pivots is great - but the same method (ie the HL, HH etc followed by HA candle colour) can be used at points of S/R. I am ...
Price Action Trading with Indicators! The Freebie System
- Delite replied Apr 14, 2011
Red As price has whizzed through that zone on the M15 will you be looking at the zone marked on the hour chart or is momentum too great? (Just learning) ETA - Kenny beat me to it!
Price is everything
- Delite replied Mar 30, 2011
Hello all I saw this trade - a pullback to the DP followed by a bearish engulfing candle - but didn't take it. It worked out, obviously, but would the position of the MAs have kept others out? EV - thanks for the doggie goodwishes - he had an op on ...
Psych Levels, Pivots, and Trendlines - Resurrected
- Delite replied Mar 24, 2011
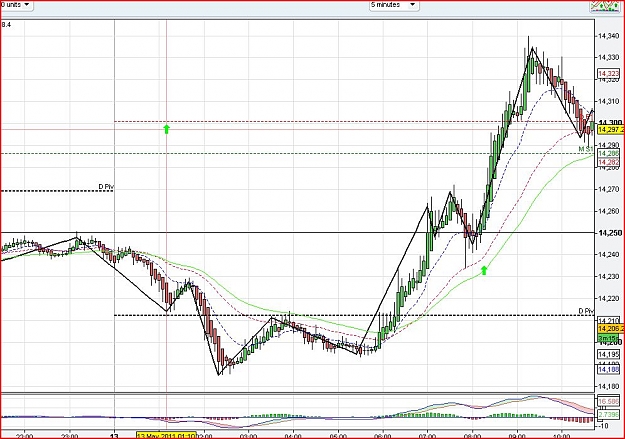
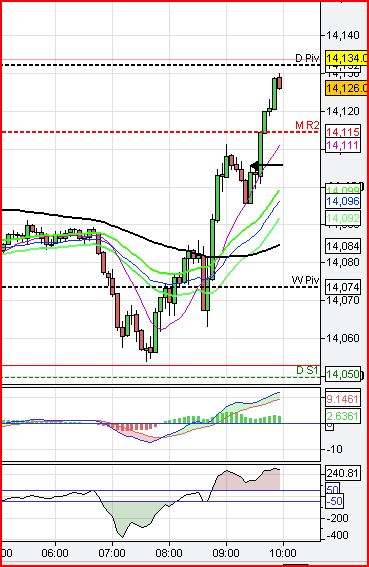
EU M5 chart Took entry at the black arrow. Bullish engulfing with a close above the 14100 level and a bounce off the 10MA. Aware this is counter trend so will take what I can - hoping for the DP.
Psych Levels, Pivots, and Trendlines - Resurrected
- Delite replied Mar 17, 2011
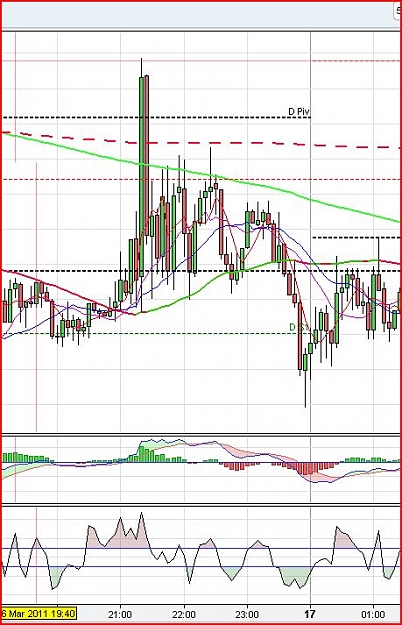
Hi guys Attached is an EU chart from yesterday. Would you take the most recent swing high to be the area around the dotted red line, or would you use that really high spike candle? Many thanks in advance.
Flag trading the trend
- Delite replied Feb 9, 2011
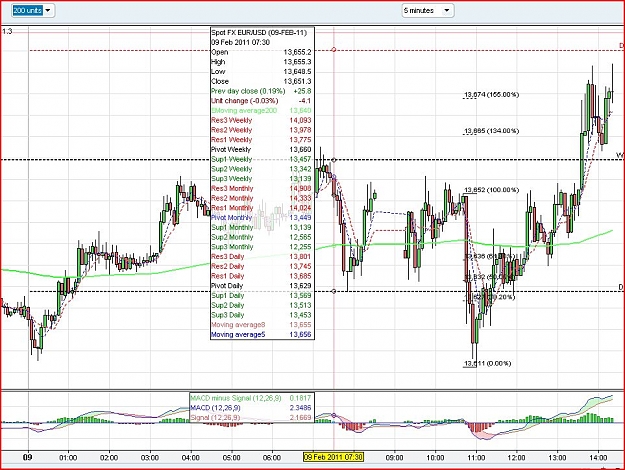
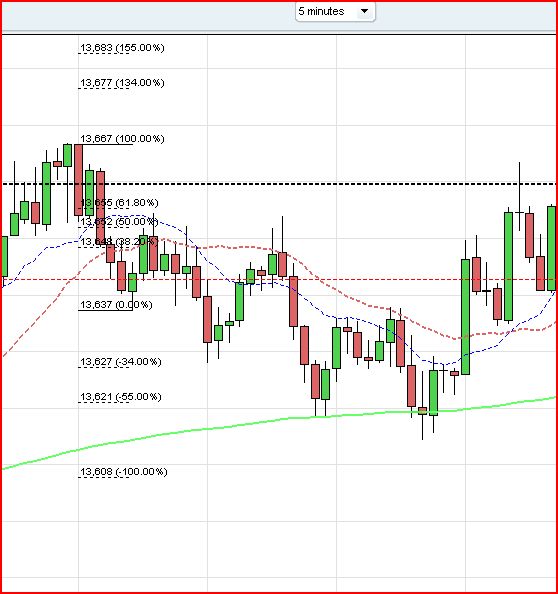
Still disagree!! EU Chart from yesterday morning. Anyway its what works for each of us thats important! All the best.
Profit All Day System
- Delite replied Feb 9, 2011
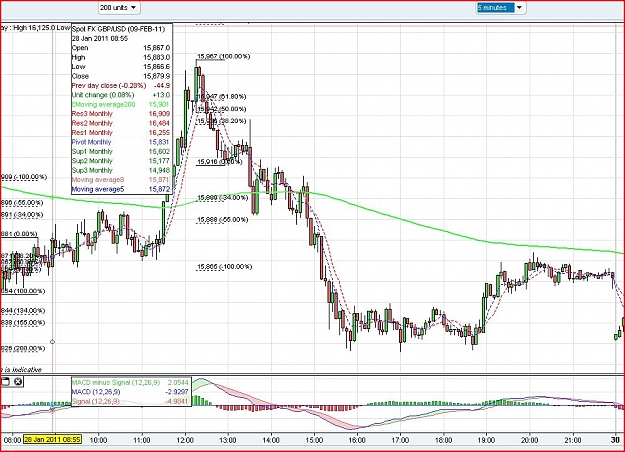
Oh I see. Sorry! In a final, clumsy attempt to help I post the following chart, which is my copy of Paulus' last chart ie 28th Jan. It would appear that his times are one hour ahead of mine. It may help for a comparison, until he posts himself. Best ...
How to use the 123 strategy effectively
- Delite replied Feb 9, 2011
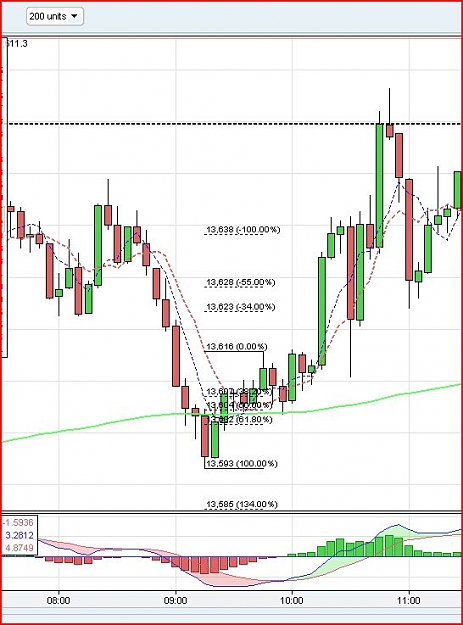
Does this help? It is now 14.25 GMT.
How to use the 123 strategy effectively
- Delite replied Feb 8, 2011
Pres - thank you for your reply. Nice set up on GU this morning.
How to use the 123 strategy effectively

- Delite replied Jan 26, 2011
Hello Thomas I attach my M5 chart for GU - there is definitely more than one candle between 2 and 3. Do you have a different setup? Hope this choppiness subsides soon.
How to use the 123 strategy effectively
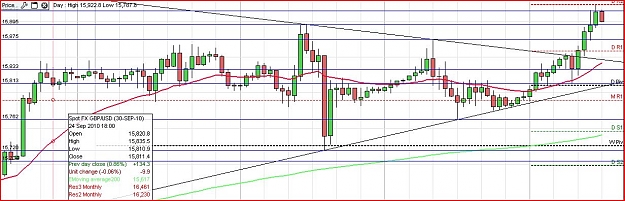
- Delite replied Sep 30, 2010
I wondered if someone could spare 5 minutes to have a quick look at my hour chart and confirm that I have got my SR levels in the right places. I know it sounds really basic, but I just need to check that they go at the swing highs and lows while ...
Cable Update (GBPUSD)