- Search Metals Mine
- 4 Results
-
 DHelix replied Mar 21, 2017
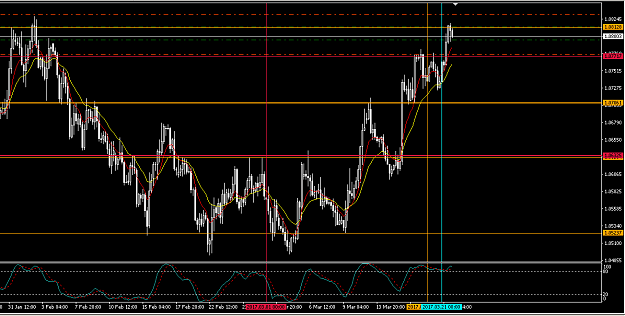
4 hour chart. Hope to close just above monthly resistance 1(red line). I believe resistance @ 1.079# will be broken. It also has to pierce through 38 fibo on it's way down @ 1.0779, about which I'm not so sure. But that's for the future. Maybe. ...
EURUSD
Attached Image (click to enlarge)
- DHelix replied Feb 29, 2016
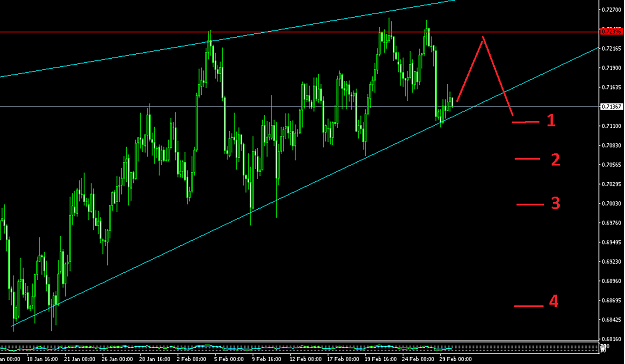
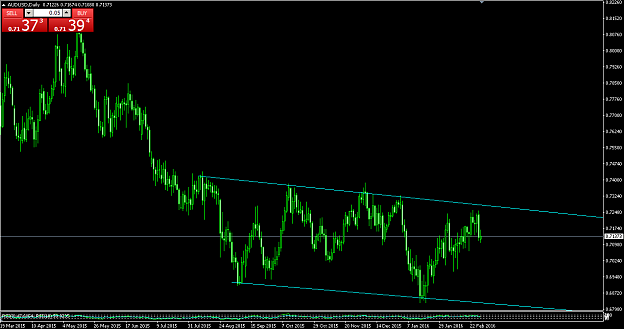
As I see it at the moment from technical point of view. First graph is 4 hours, numbers are targets, after breaking the support. Also H4 and D1 graphs correlates neatly with each other. D1 kinda confirms upcoming support breaking. image image
AUD/USD
Attached Image(s) (click to enlarge)
- DHelix replied Feb 26, 2016
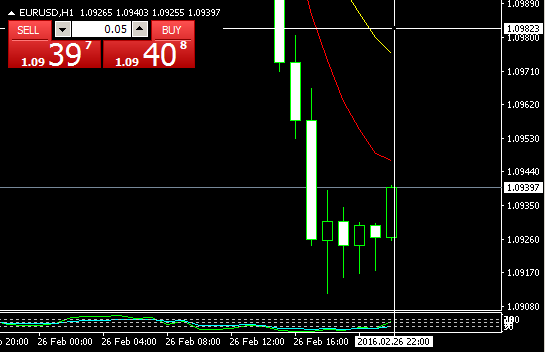
gatorinla. in your latest tweet your graph got one candle more than i do. why? image
EURUSD
Attached Image
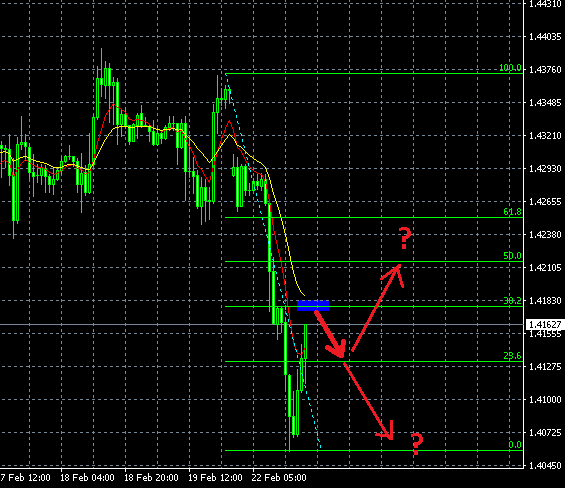
- DHelix replied Feb 22, 2016
This is what i could make out of the chart for now. Any opinions? image
Cable Update (GBPUSD)
Attached Image
- Posts by Member Search: 'DHelix'