- Search Metals Mine
- 18 Results (1 Thread , 17 Replies )
- Christianfx replied Oct 14, 2014
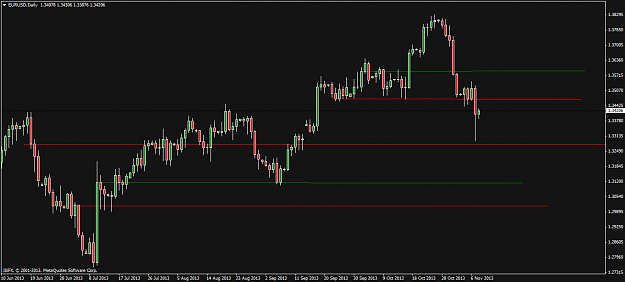
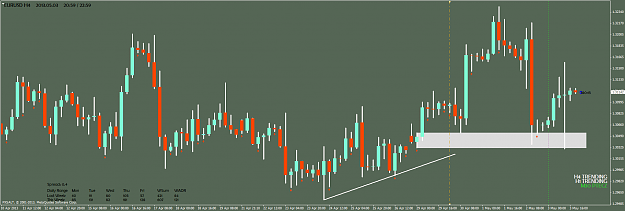
@Madmoney: I suppose we need to find the "right" levels Example here. YES. SORT OF. Or BULLSHIT? image
Counter-trend trading
- How do you deal with reversal days?Started Oct 10, 2014|Trading Discussion|16 replies
Hi all, here´s a case that´s been bothering me for a while. See the attached chart. Take a look at ...
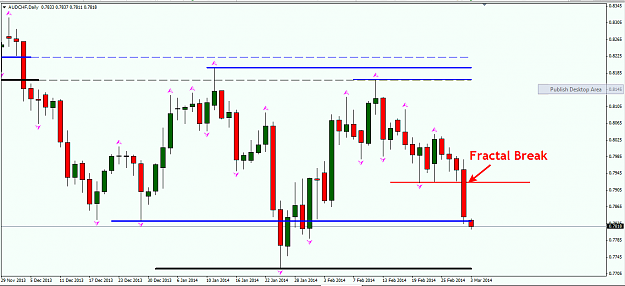
- Christianfx replied Oct 10, 2014
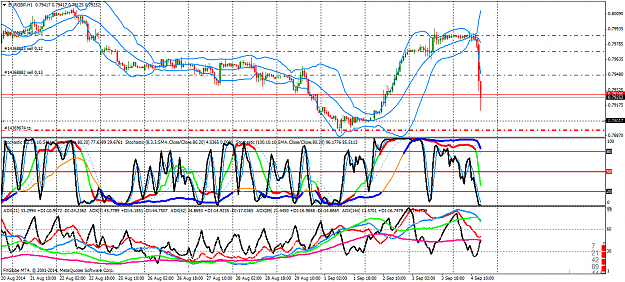
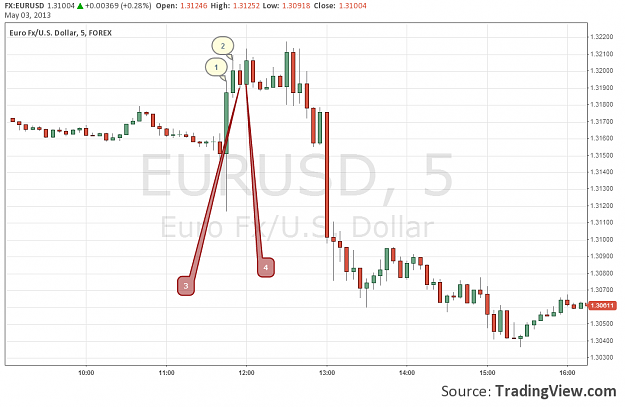
ochuko, nice way to determine the flow. I´m interested in how you would deal with the period between Jan22 and about Feb7? The trend is down but clearly (let´s call it sentiment for those sessions) are up. image
Simple Market Flow Trading System
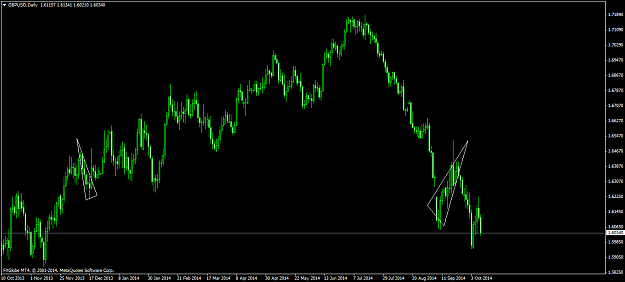
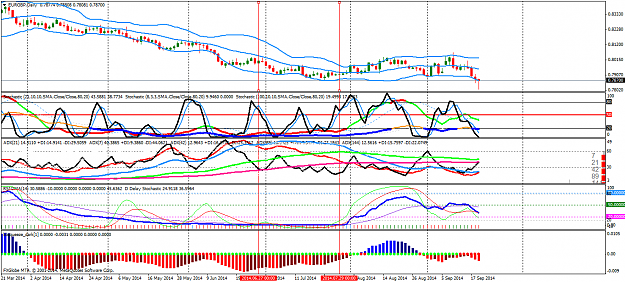
- Christianfx replied Sep 19, 2014
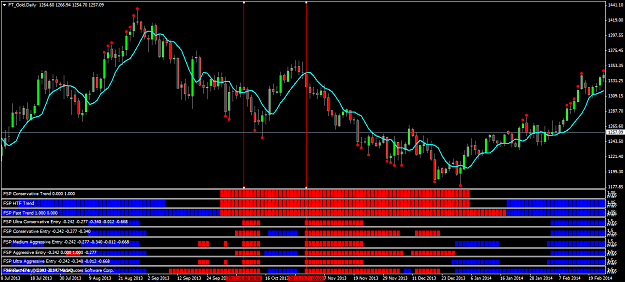
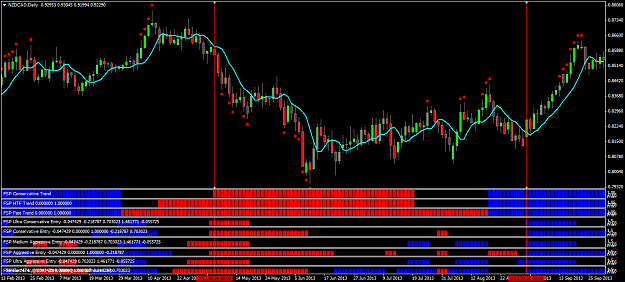
This Daily chart is sort of leaning on your Daily chart JP. How would you interpret the two signals (red lines)? Why did the first trade play out as expected but not the second? What do you look at? Higher time frame? Weekly was good? 4h could have ...
Alien's Extraterrestrial Visual Systems
- Christianfx replied Sep 4, 2014
image Hi there, I´ve been thinking a little bit more about this approach. The idea of catching the wave before they happen are clear in theroy, but not so easy to do in reality. Is this what you are thinking in you head Alien?
Alien's Extraterrestrial Visual Systems
- Christianfx replied May 28, 2014
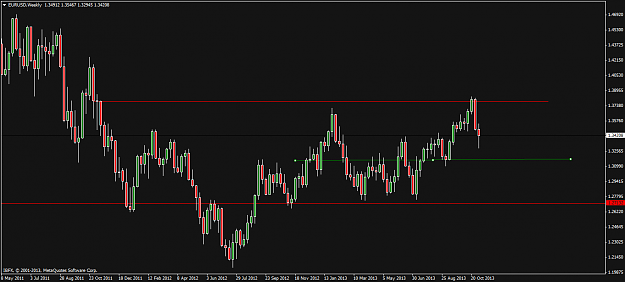
Don´t want to bang on this too much but I think one the strenghts of Eitans´ systems is the fact that they´re used maily on heigher time frames. Imagine catching one of those every now and then. image image As for me, I shall not be tempted this ...
Eitan's Project
- Christianfx replied May 27, 2014
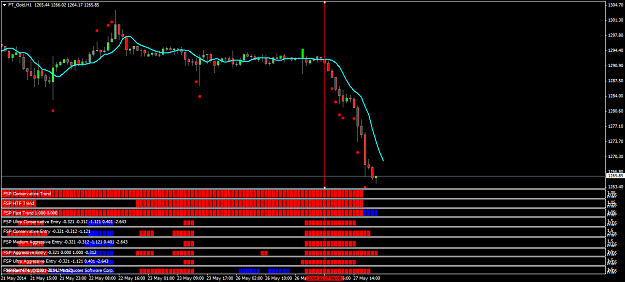
I don´t know. NO repaint issues here, again. Ignore trada again image
Eitan's Project
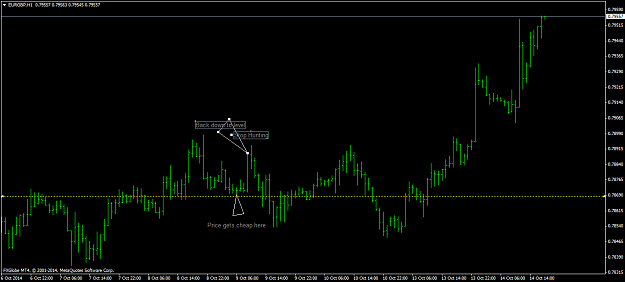
- Christianfx replied May 27, 2014
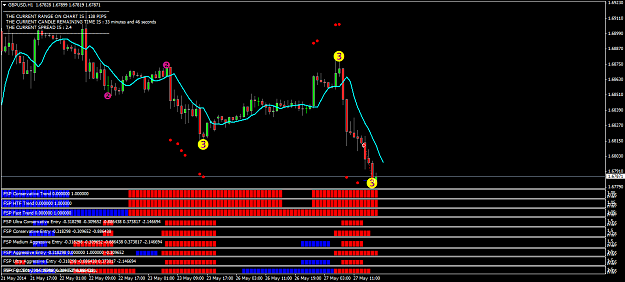
Pound dollar. Took my mouth little bit too full here. I was in that trade, I entered with MRI system. But look when the signal came here. image
Eitan's Project
- Christianfx replied May 27, 2014
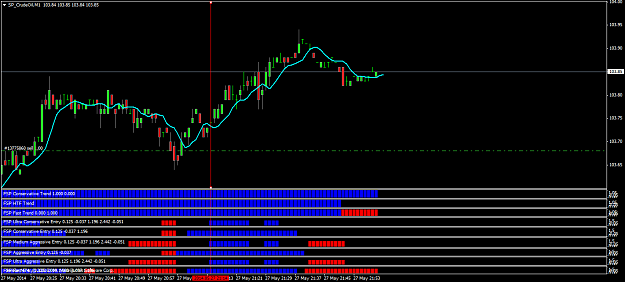
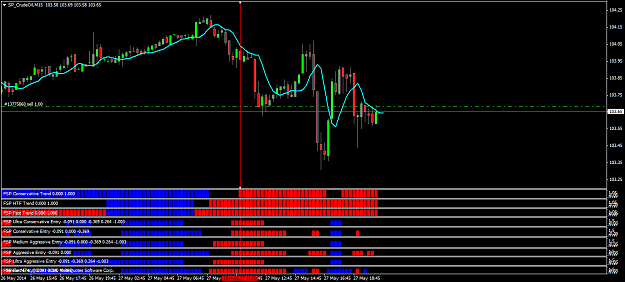
Crude. Ignore the trade was a different issue. image
Eitan's Project
- Christianfx replied Nov 8, 2013
Hi there, is this also a valid analysis of BO levels? image image Using BO levels as important zones on the chart. Here I marked BO levels of candles that broke out of consolidations. Does it matter if the BO level is bullish or bearish or do ...
Price Action in Day Trading by Dadas
- Christianfx replied Nov 7, 2013
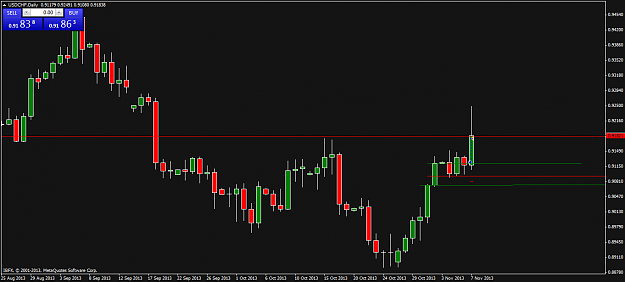
What about this trade? That´s the way it´s supposed to work? I don´t know why the trade is so hard to see (draged in onto the screen) I hopyou can see the arrows closeto the latest candle? It took some time but suddenly I can see the power of BO ...
Price Action in Day Trading by Dadas
- Christianfx replied Aug 29, 2013
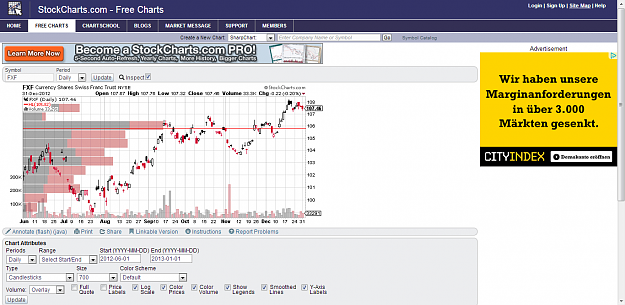
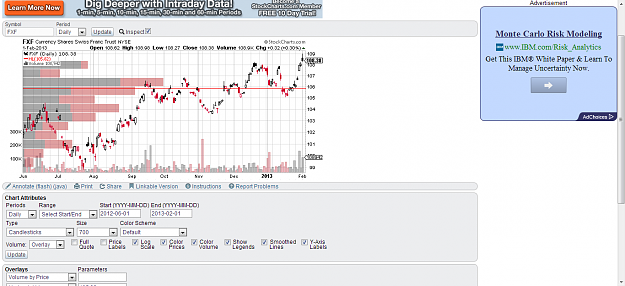
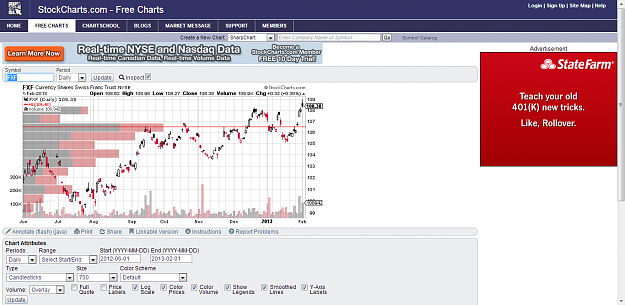
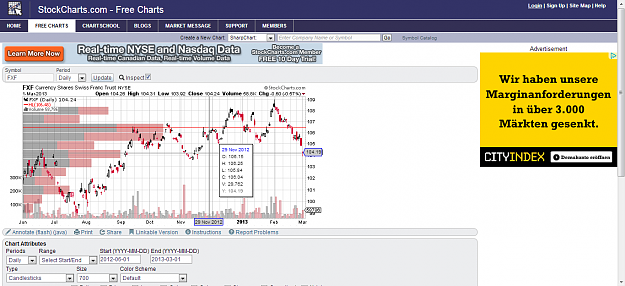
An example how volume can be used to determine important zones. This one is done with volume by price. image The first chart shows FXF and volume by price. The red line indicates where I´d be looking for my target that ends the downtrend. Look at ...
Price Action in Day Trading by Dadas
- Christianfx replied May 21, 2013
I tried to install the indicator via the Metaeditor first but that didn´t work. I had the same problem the indicator showed up in the list on the platform but it didn´t work. The I downloaded the file again from my email account and chose the option ...
Price Action in Day Trading by Dadas
- Christianfx replied May 11, 2013
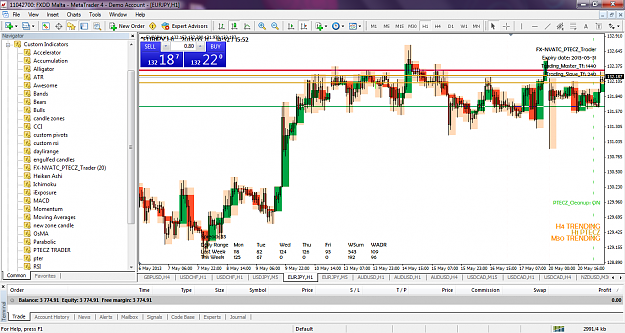
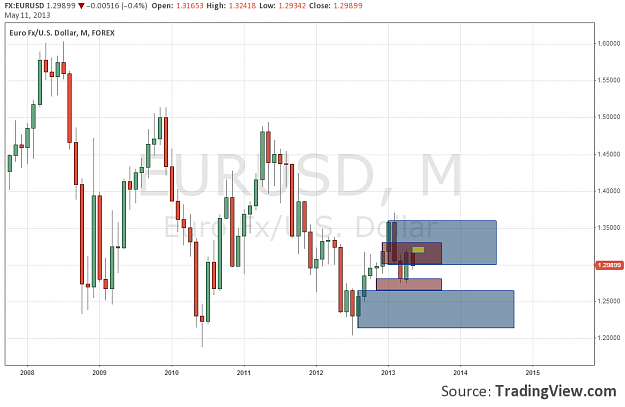
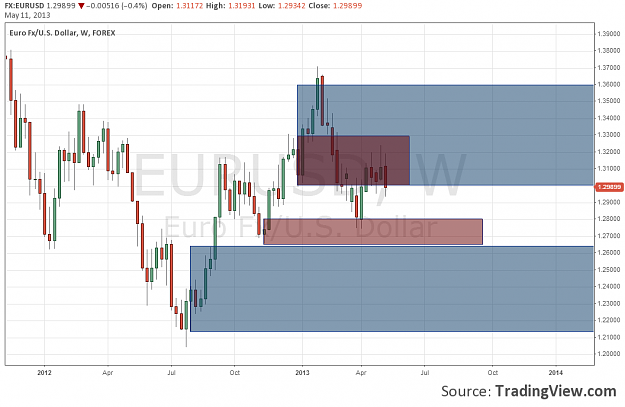
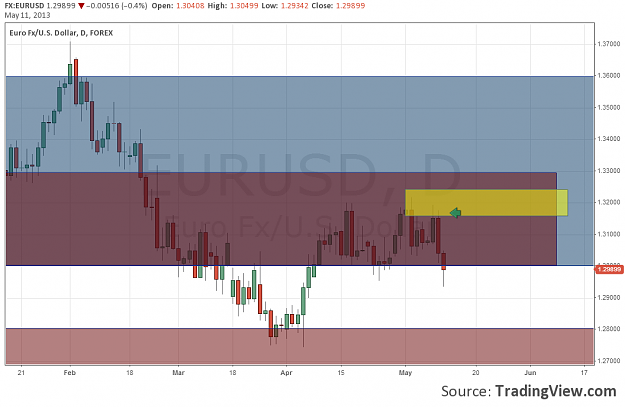
Here´s something I was really excited about. Break up candle on the monthly. However, it reached the previous TBCZ Zone and so far it´s looking like a continuation of the downtrend. image Confirmed by the weekly price reached a TBCZ Zone, maybe ...
Price Action in Day Trading by Dadas
- Christianfx replied May 8, 2013
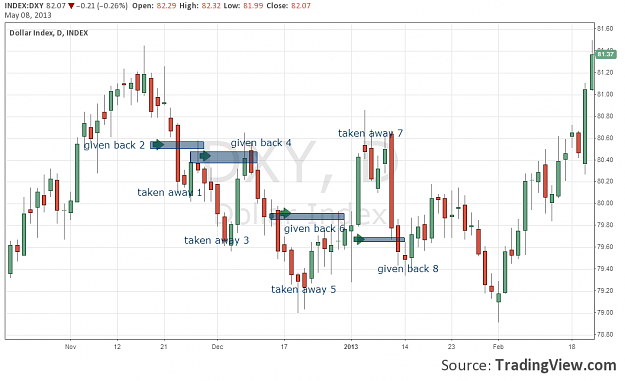
Dadas yesterday you told me to study the symetry. What has been taken must be given back! Now that kept me thinking. I don´t now how to illustrate that on a chart but I hope it makes sense. I´m wondering whether I´m on the right track here or ...
Price Action in Day Trading by Dadas
- Christianfx replied May 7, 2013
image sorry here the chart I´m talking about
Price Action in Day Trading by Dadas
- Christianfx replied May 3, 2013
There you go. I hope it´s clear now. Otherwise the chart becomes too cluttered. image
Price Action in Day Trading by Dadas
- Posts by Member Search: 'Christianfx'