- Search Metals Mine
- 34 Results (1 Thread , 33 Replies )
-
 Chica replied Jan 13, 2018
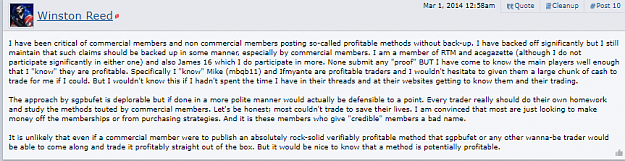
Ahh yes. Winston was correct when he said this: image so the statement of facts show: 1. Winston Knows IF is not a scammer and is profitable (deduced from his own post) 2. IF spent time in RTM trying to explain to Winston about his ...
Scammers - Hall of Shame
- Chica replied Dec 13, 2017
image WHY THEY WANT YOU TO TRADE Wind back the clock a few decades and trading from home was rarely within the grasp of common folk. In those days, when I heard of someone being a ‘trader’ or ‘broker’, the image of Gordon Gekko would appear at the ...
RTM Academy

- Chica replied Nov 28, 2017
The Herd Gets Slaughtered in Trading 5 Signs that you are following the herd: 1) You Jump From System to System 2) You Trade Based on What the Gurus Tell You To Trade 3) Add Indicators On Your Charts For Confluence 4) Believe There is True Supply & ...
RTM Academy

- RTM AcademyStarted Nov 26, 2017|Commercial Content|106 replies

Want to know the truth behind the greatest scam on earth! Trading in a free market is a fallacy. We ...

- Chica replied Jun 17, 2017
RTM shows us that the market is not random time and time again image image
ReadtheMarket - Supply and Demand with Price Action
- Chica replied Jun 13, 2017
For those who think RTM is S/D Trading, think again! SUPPLY & DEMAND TRADING – SMOKE & MIRRORS image
ReadtheMarket - Supply and Demand with Price Action

- Chica replied Jun 5, 2017
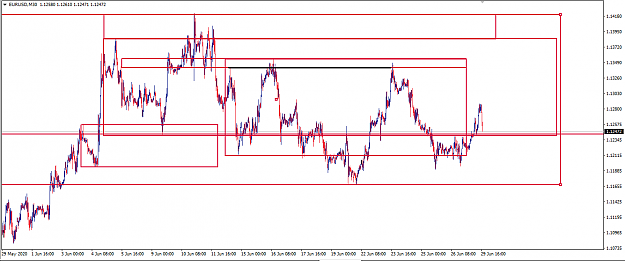
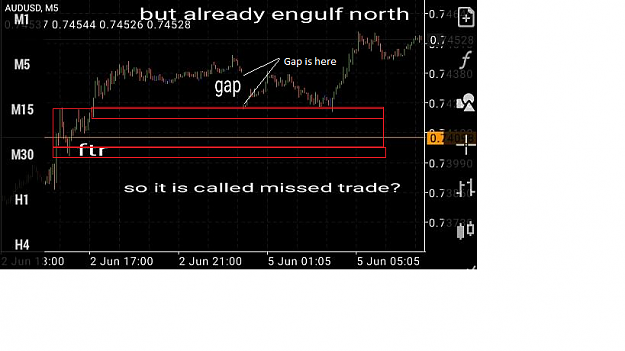
Hi Mate, I don't know about the validity of your area marked as FTR, But look where the gap went to. So you tell me, did your FTR get hit based on below diagram (I added red box and lines near your gap. I cant see history, so its difficult to ...
ReadtheMarket - Supply and Demand with Price Action
- Chica replied Jun 4, 2017
Hendzwoter, It all started with PIE. But here we are years later. Methods have adapted based on subtle changes in the market over time. Many other online educators teach a system or strategy that is limited to specific market dynamics and behaviour. ...
ReadtheMarket - Supply and Demand with Price Action


- Chica replied Feb 4, 2017
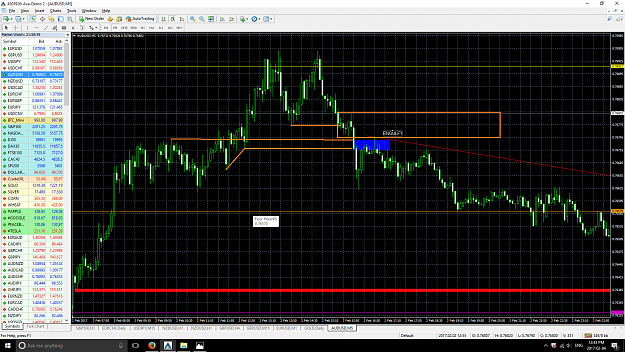
It EG the FTR/FL of the CP PAZ, see orange markings. But look where it EG to. EG is important but you also need to know if it is usable or if it has hit an opposing TG. For me it cant be used on that scale UNLESS we get appropriate PA. We can drill ...
ReadtheMarket - Supply and Demand with Price Action
- Chica replied Jan 25, 2017
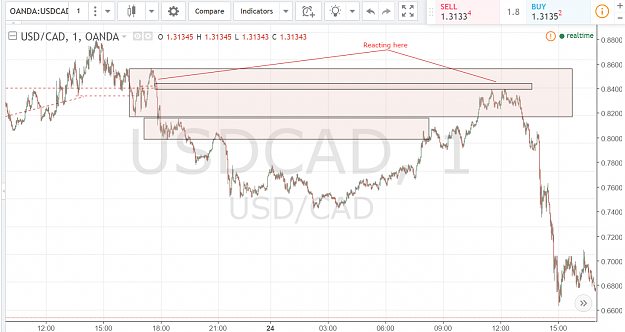
Im no IF however if you look at your circled area there is a reaction on lower scale, within larger scale areas image
ReadtheMarket - Supply and Demand with Price Action
- Chica replied Jan 21, 2017
Everyone is entitled to an opinion however I see no more value in this thread. But that's only a personal view. I know by making this is a contradiction by posting myself however I hope nobody else posts any type of RTM material here. In my opinion ...
ReadtheMarket - Supply and Demand with Price Action

- Chica replied Jul 16, 2016
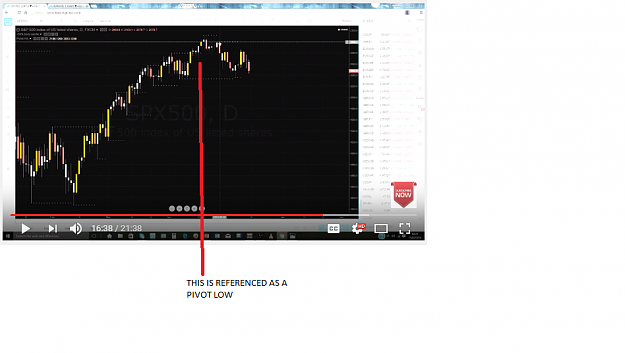
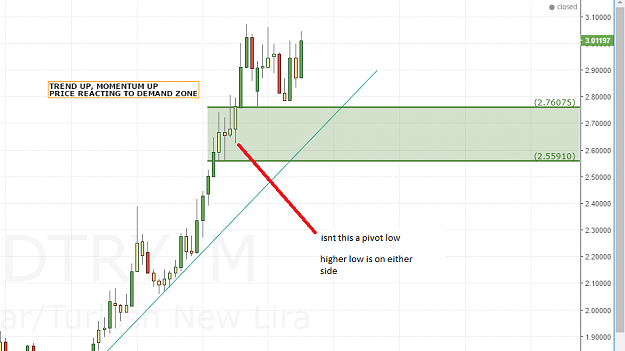
Hi AKT, With the pivots, do you consider only obvious ones which have pulled back or spiked, or as many do with a (3) candle structure such as a high or low with a lower high or low each side. See below images. In vid seems you make ref to pivot ...
Trading Institutional Order Flow
- Chica replied Jul 6, 2016
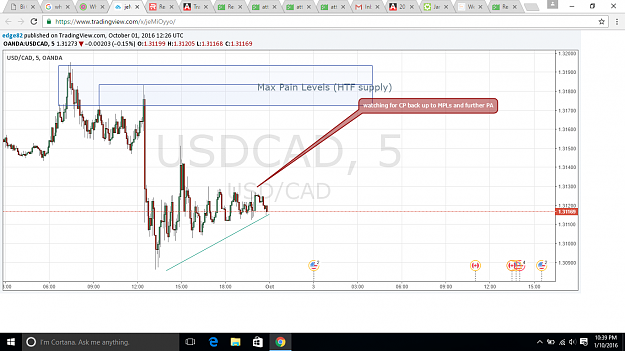
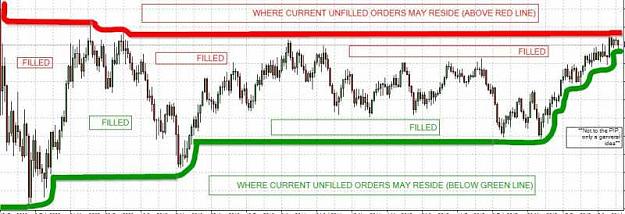
Im no AKT however I have been down this path in the past. The space in the zone where price has touched than left, represents possible unfilled orders. The width of zone 2 has much more potential for these orders as price has not penetrated However ...
Trading Institutional Order Flow
- Chica replied Dec 20, 2015
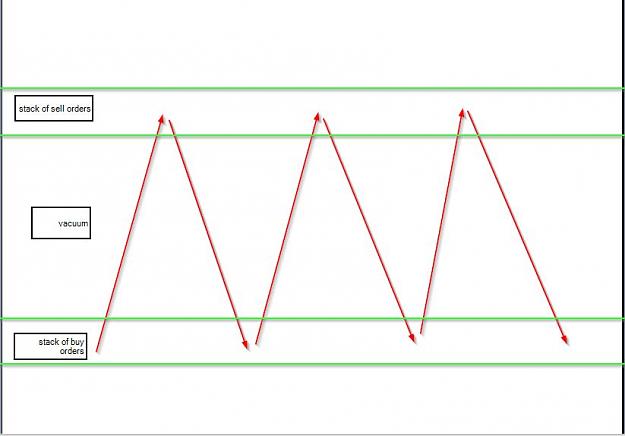
How Limit orders (liquidity) draw price (via market orders) to the stacks of orders. The diagram of course is only a simple way to see how price moves and how liquidity is sought in a dual market where opposing market orders are seeking the ...
Chica's Supply Demand and PA Journal
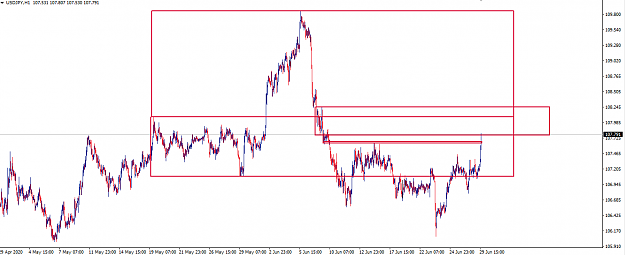
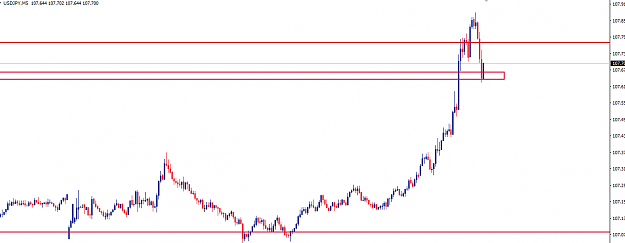
- Chica replied Dec 16, 2015
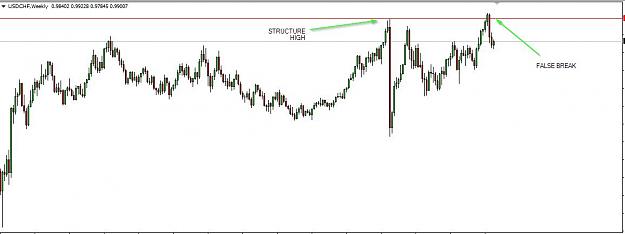
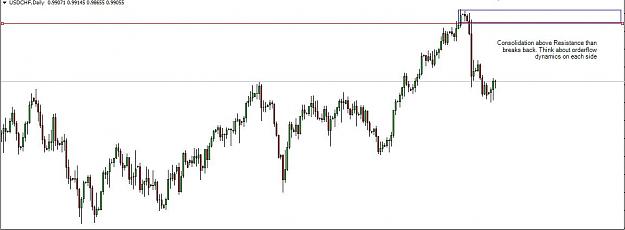
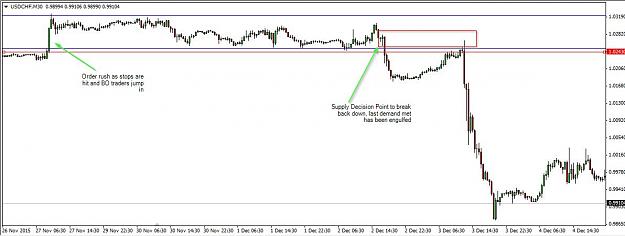
Orderflow surrounding False Breakouts can provide opportunities. Looking at the structure and Lower TF zones can offer setups. (Need to start catching these live) image image image
Chica's Supply Demand and PA Journal
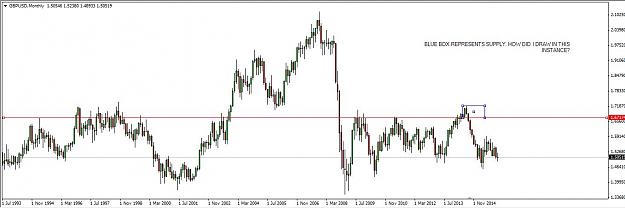
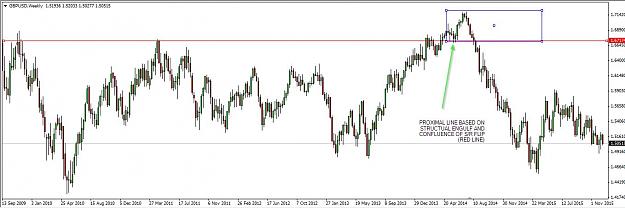
- Chica replied Dec 15, 2015
When unsure about how to mark the zones. We can always look for structure and breakpoints on the closest lower time frame it appears. Look at the images. We are looking at supply on monthly but use weekly to see where the first decision was made to ...
Chica's Supply Demand and PA Journal