- Search Metals Mine
- 130 Results (1 Thread , 129 Replies )
-
 Chantalb replied Nov 20, 2015
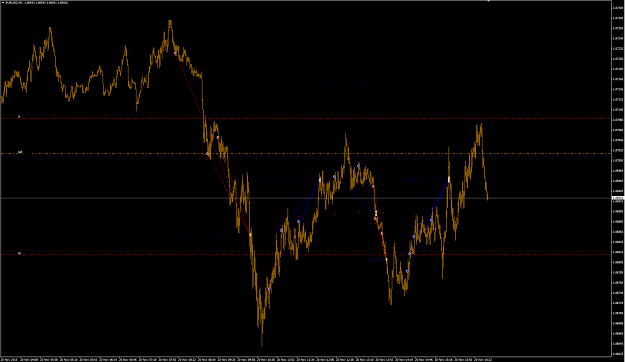
I have a different perception... TP just hit... Good weekend all
EURUSD
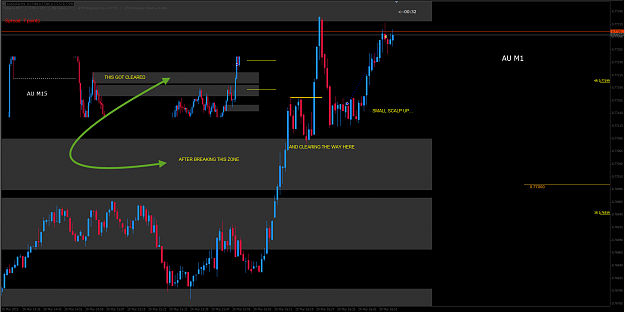
- Chantalb replied Mar 20, 2015
One last trade b4 closing for the weekend... image Initial trade from yesterday, closed some at app 5R and the rests is kept going with sl @ 1R. Cheers, CB
Price Will Tell - Supply/Demand Price Action Trading
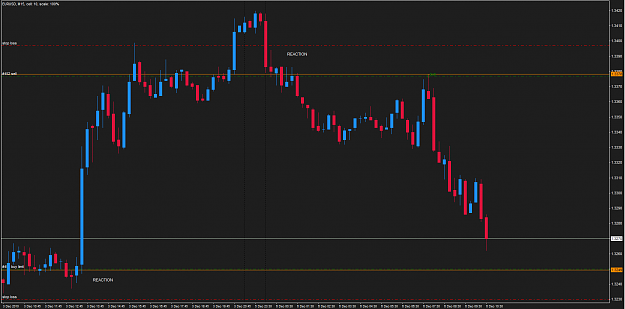
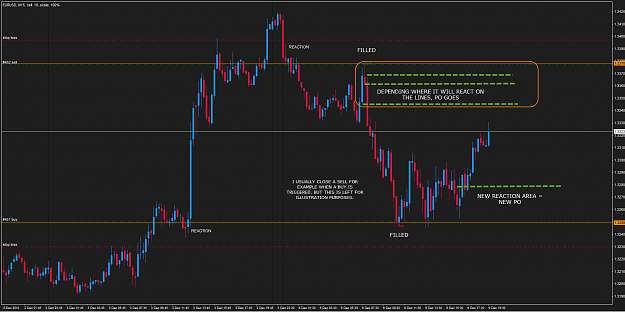
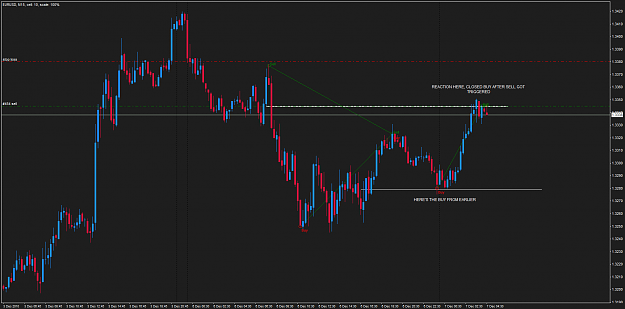
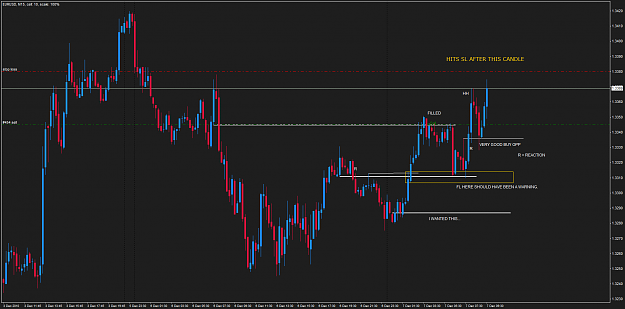
- Chantalb replied Mar 20, 2015
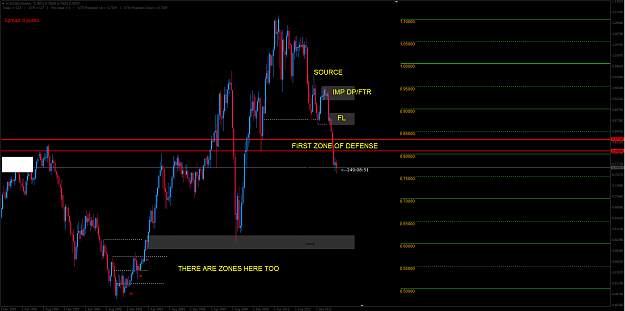
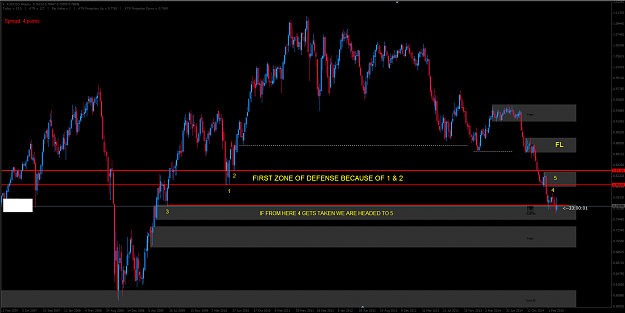
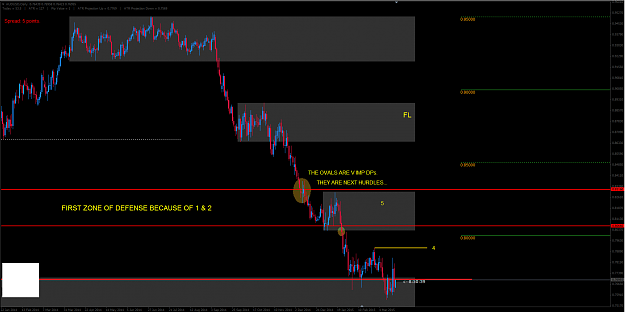
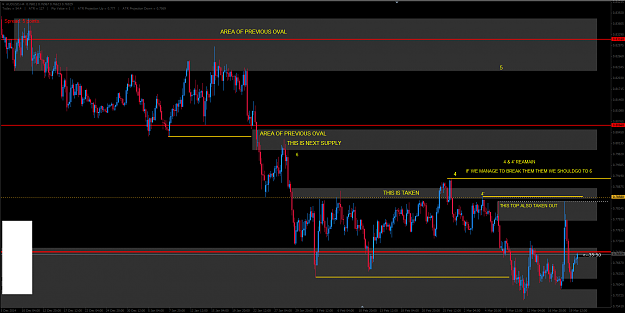
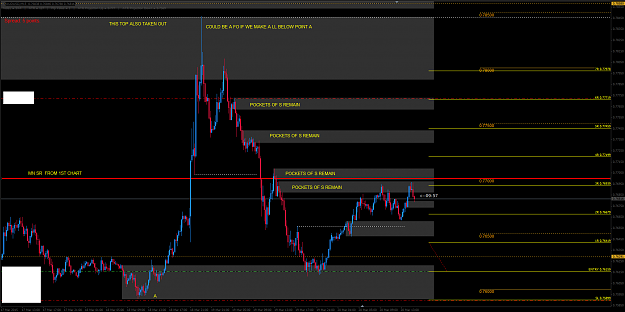
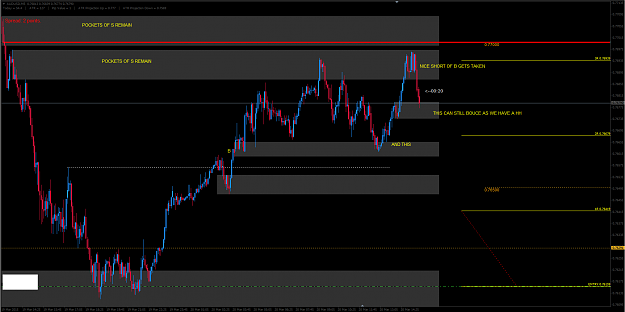
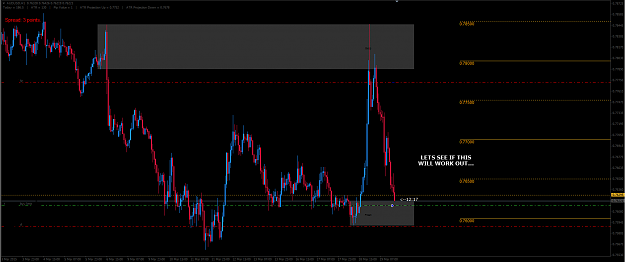
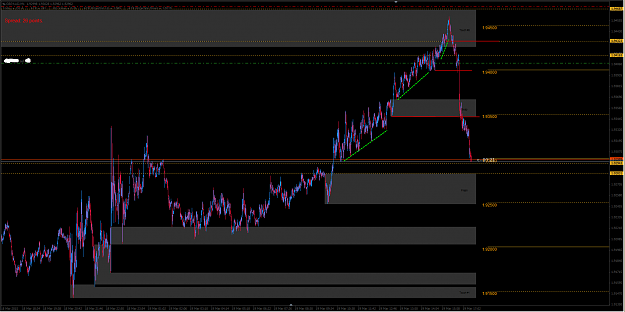
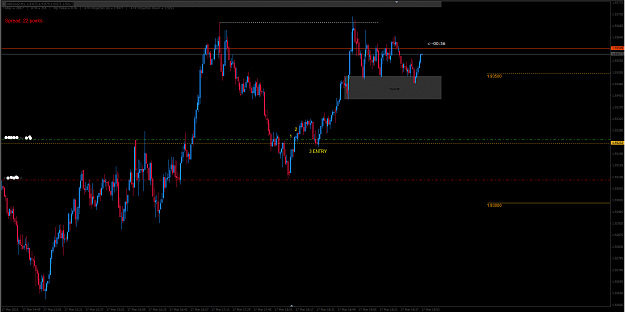
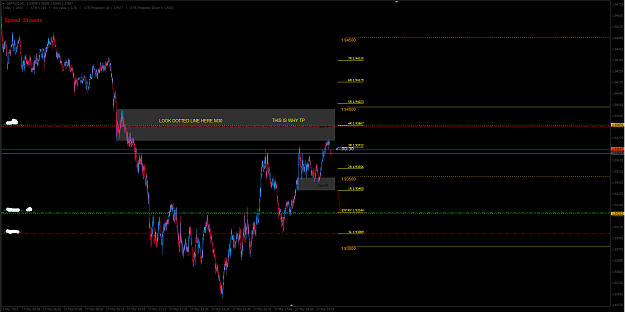
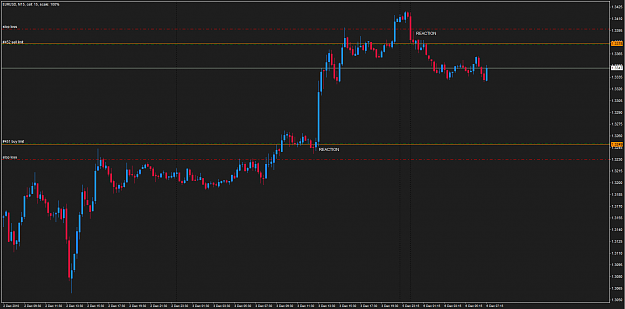
Hello, Here's a rundown, let me know what you think... image image image image image image Didn't do m1 as I think it is straight forward. Also didn't see the need to look at h1 or m30... So I might have missed something. Have a great ...
Price Will Tell - Supply/Demand Price Action Trading
- Chantalb replied Mar 17, 2015
Hi Simon, This is how I see it... image Below is a similar bullish setup... image Have to leave can't watch it... booked 2/3 at 3R and the rest will be either at 1R or 4R. Will move SL now to 1R. image
Price Will Tell - Supply/Demand Price Action Trading
- Chantalb replied Mar 13, 2015
Hey Simon, It's great to be able to discuss our ideas as such. I agree, we all have to find our own way. No matter how much someone can try and show you how they trade, it might never work for you. I have been there so many times... Before I shut ...
Price Will Tell - Supply/Demand Price Action Trading
- Chantalb replied Mar 13, 2015
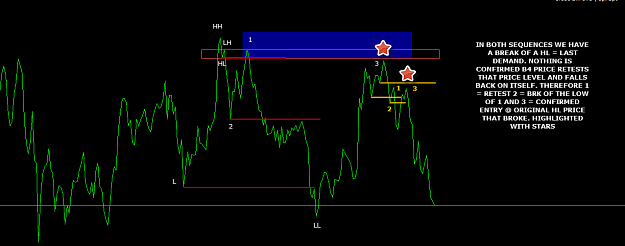
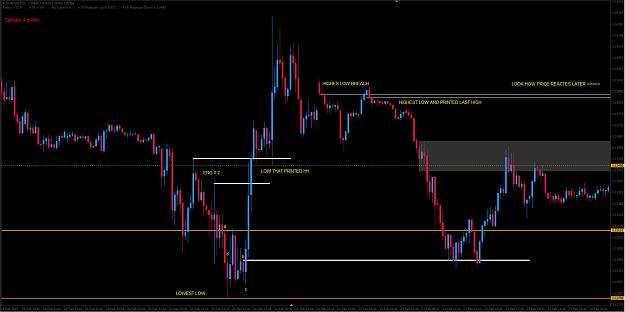
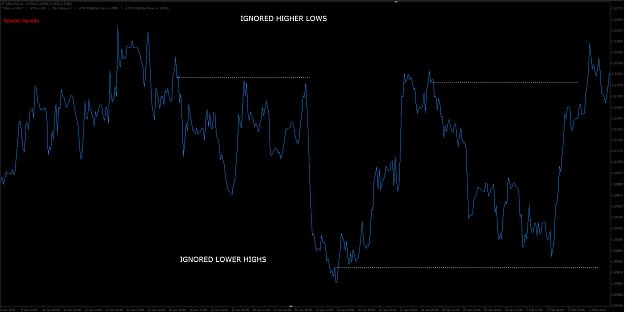
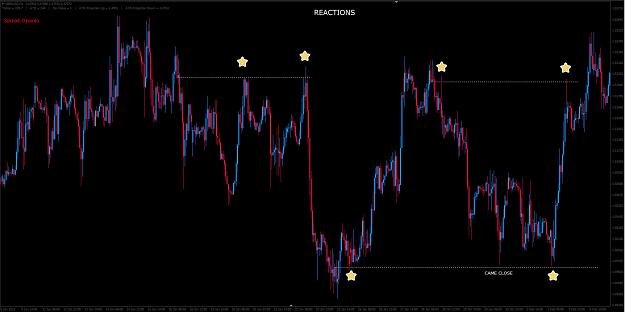
Hello everyone, In light of what Red is famous for saying traders helping traders, I am going to post a few ideas open for discussion. I hope I am not intruding here, but I have found your thread to be quite friendly as opposed to all the other ones ...
Price Will Tell - Supply/Demand Price Action Trading
- Chantalb replied Sep 30, 2011
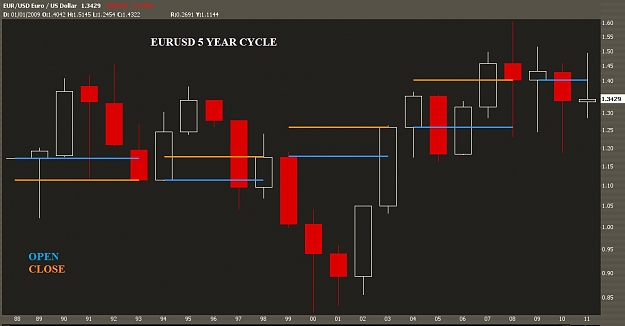
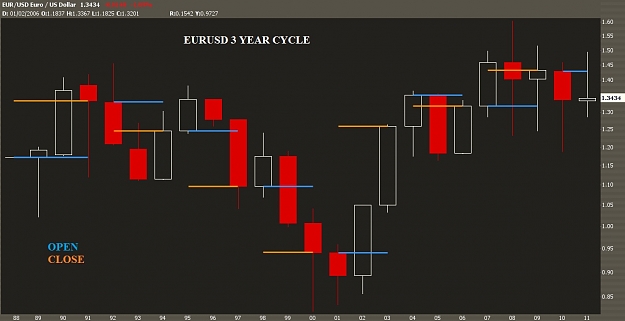
Here is also something I like to do. Those give me a rough image of a 5 year and 3 year candle chart. I don't know why, but odd numbers have always worked better for me, and these two are those I use in most of my TA. Good weekend to you all, Chantal
Trading Price Pivots
- Chantalb replied Sep 30, 2011
Hi AF, The reason why I posted all the above charts was to give everyone an overall picture. As I mentioned before in one of my posts, what is really important is to look at the bigger picture. If I wanted to give a short bias I would have shown a ...
Trading Price Pivots
- Chantalb replied Sep 29, 2011
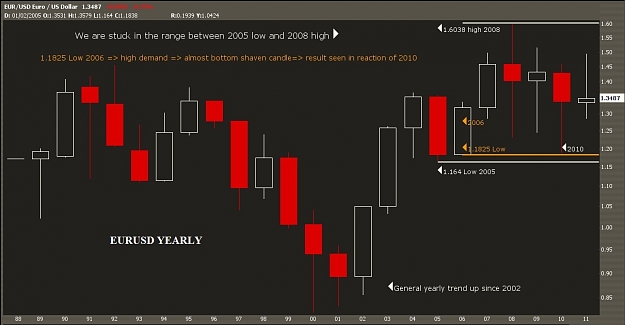
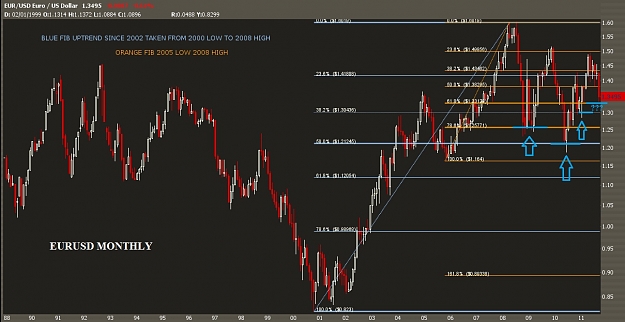
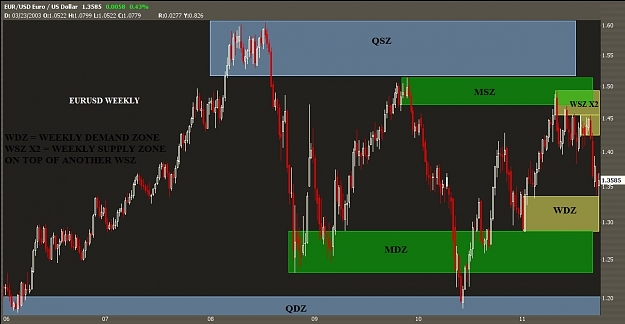
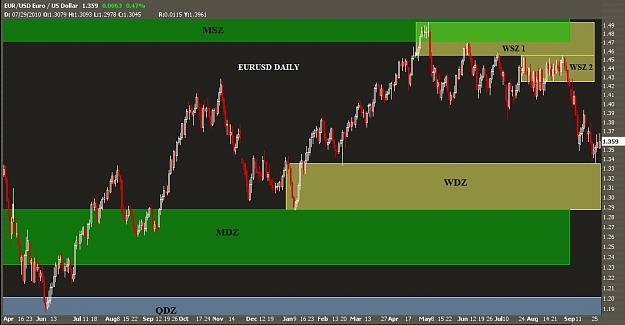
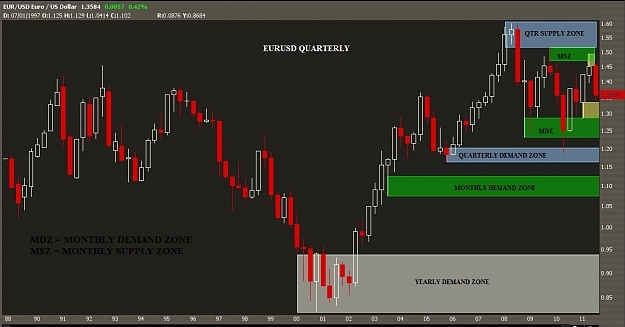
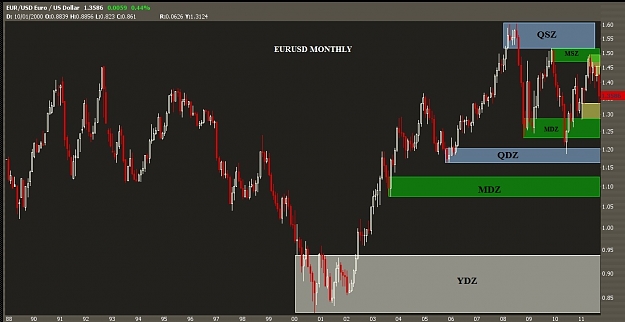
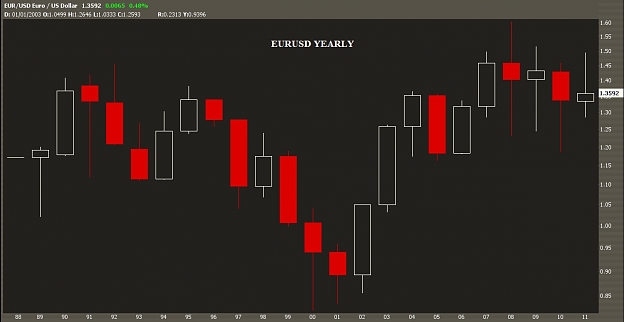
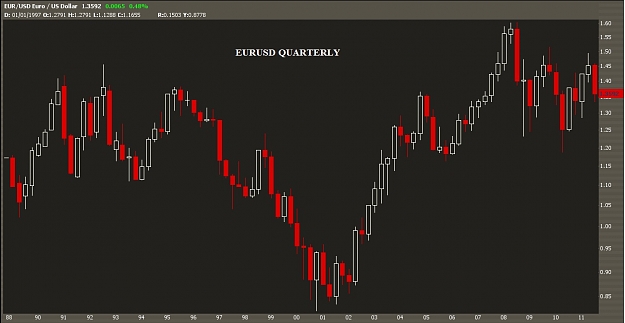
EURUSD Higher Time Frames — Here are six charts from yearly down to daily First two yearly & quarterly
Trading Price Pivots
- Chantalb replied Sep 27, 2011
Example of a no trade — Here’s an example of a setup I would not take regardless if tomorrow’s candle is worth 1000 pips. Now the day is not over yet, but assuming this is how today’s candle ends and a pivot high forms. Where we stand ...
Trading Price Pivots
- Chantalb replied Sep 16, 2011
GBPCAD Hidden Bullish Divergence — Expecting to see bullish strength soon... 3x hidden bullish divergence
Trading Price Pivots
- Chantalb replied Sep 15, 2011
Hi AlienFrog — Sorry for the confusion here is the 4h chart (EURAUD) I was referring to in terms of TLs. The dashed red one is Daily highs etc and the bold red one is based off daily line chart. Now about the other part of your question on ...
Trading Price Pivots
- Chantalb replied Sep 14, 2011
A trade and some notes — Took a short on USDCAD, the structure came at the third touch of TL and at 50%. Now this is counter the monthly and any announcement could make it sky rocket. The only direct concern I have is the zone below in pink ...
Trading Price Pivots
- Chantalb replied Sep 13, 2011
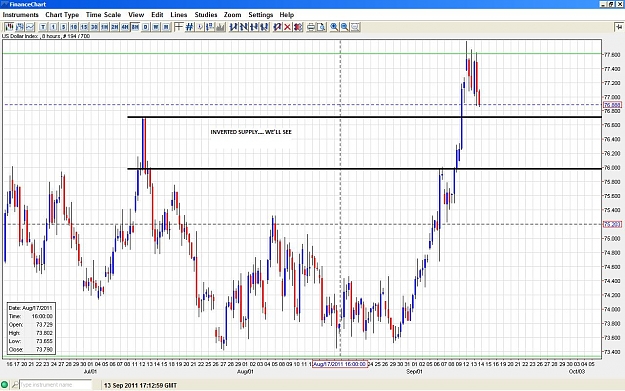
USD Index — It looks like the USDX has some unfinished business before going back up. It had no reaction whatsoever to the big highlighted supply zone which means now it will act as demand... So with this I'm expecting some much lower EU after ...
Trading Price Pivots
- Chantalb replied Sep 13, 2011
Update on AUDCAD — Price has just hit H1 demand. In the charts (D1/4H) blue rectangles are daily levels (above price supply and below it demand), pink 4h and white 1h (Demand in this case for both). Ideally I would like to see price come down ...
Trading Price Pivots