- Search Metals Mine
- 24 Results
-
 BridgeWater replied Sep 30, 2016
Long time no see guyss.. EC+121 pips (+1210 pipets) image
Trading Made Simple
- BridgeWater replied Aug 23, 2016
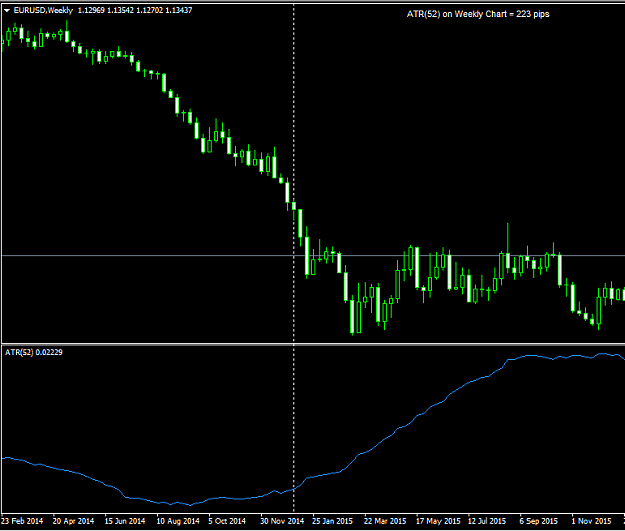
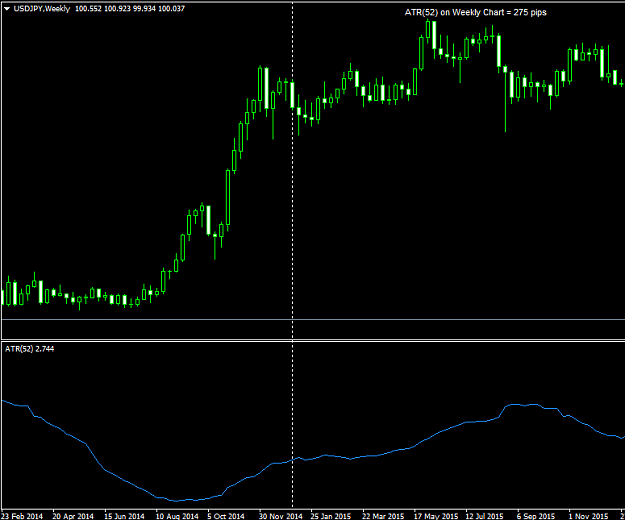
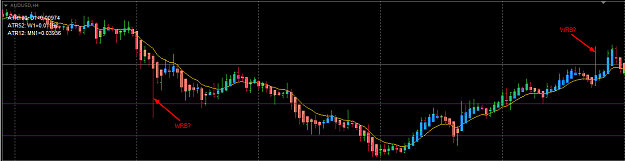
Just another ATR indicator
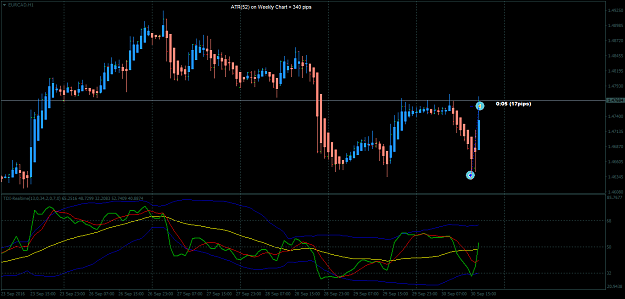
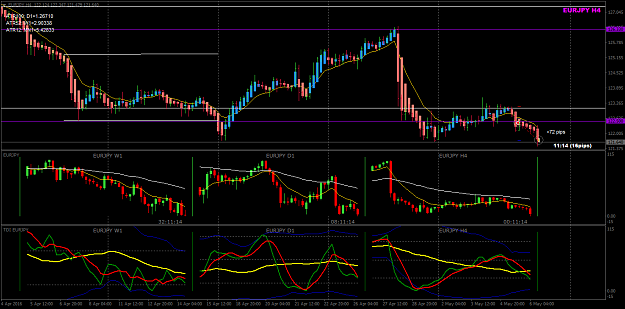
Trading Made Simple now, you dont need to change to weekly chart while on h4 chart. image image file
- BridgeWater replied Jun 10, 2016
But you have that arrow on your chart picture. So the arrow that you have on your picture, you dont know how is there? this is your picture on post #69,475 image
Trading Made Simple
- BridgeWater replied Jun 9, 2016
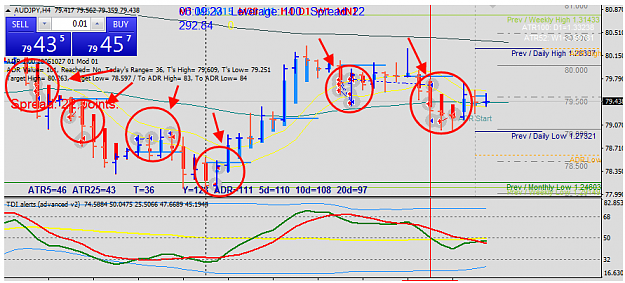
Example of greedy behavior
Trading Made Simple I lose my +58 pips opportunity and only get +1 pips
  Here the story, as seen on my chart, i should close my trade on low yellow line, and also which is on narrow range safe for 40% of 52 average weekly ...
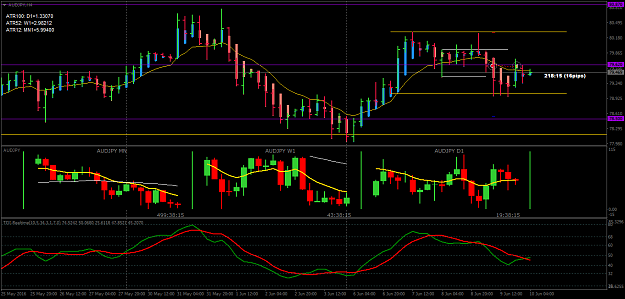
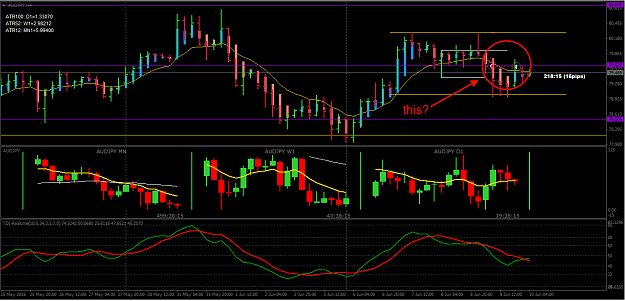
- BridgeWater replied May 27, 2016
if you targeting 60% AWR (52), be careful of MN resistance ahead. image
Trading Made Simple
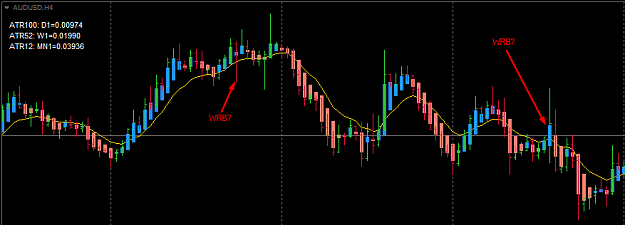
- BridgeWater replied May 19, 2016
Hi Emm, you are right, this is very good example for post #647. Thank you for remind me about previous week close and low, previous days day open, 200EMA and also BRN 1.1300. I have question about WRB, if there is big candle but its pullback candle, ...
Trading Made Simple
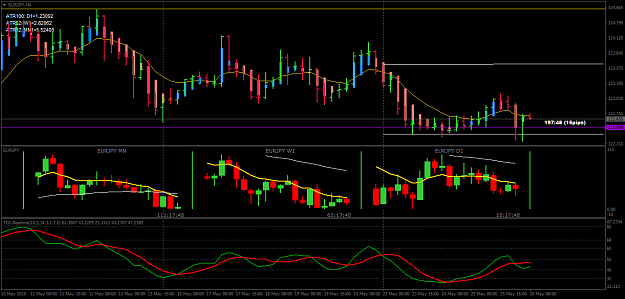
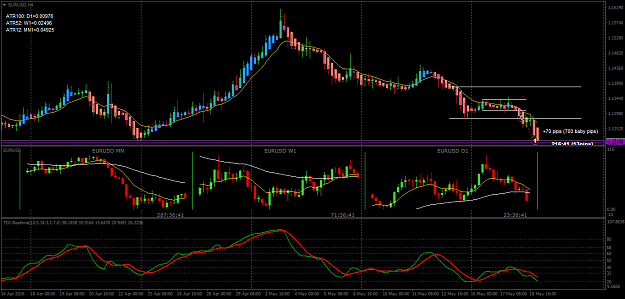
- BridgeWater replied May 18, 2016
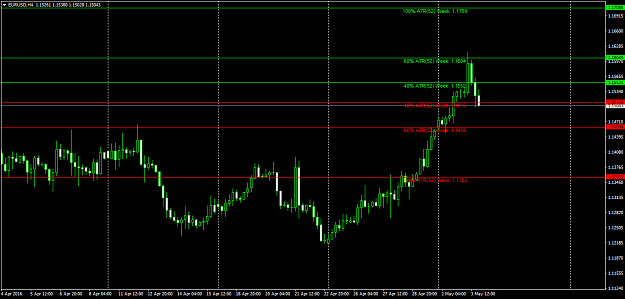
EURUSD +70 pips (700 baby pips) Recipe: *) Follow last week candlle *) Look for consolidation *) Trade breakout of consolidation *) Targeting 60% AWR (52) *) Safe point on MN support 1.1210 image
Trading Made Simple
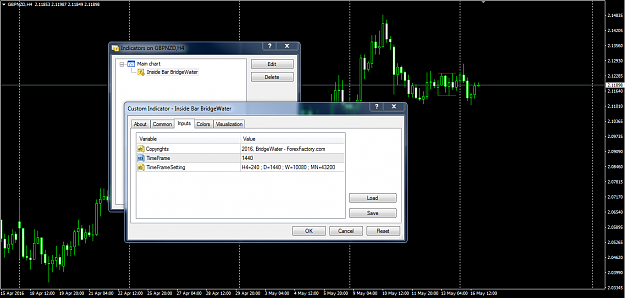
- BridgeWater replied May 16, 2016
Im make custom indicator, for anyone who need inside bar indicator that can show inside bar at higher timeframe on current chart. Enjoy!! It look like this, that red line show inside bar at daily timeframe on H4 chart, you can change value of ...
Trading Made Simple
- BridgeWater replied May 8, 2016
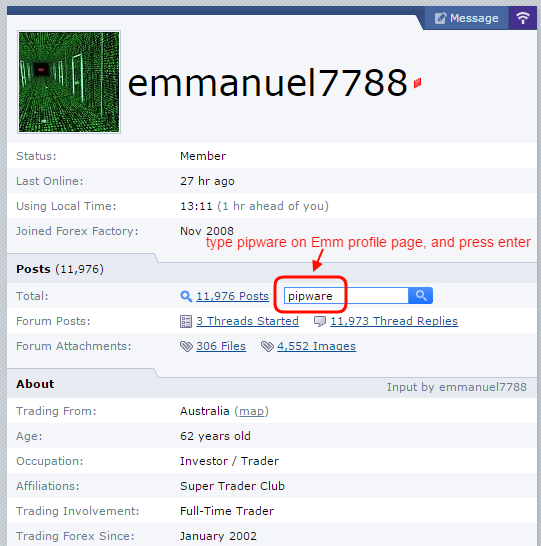
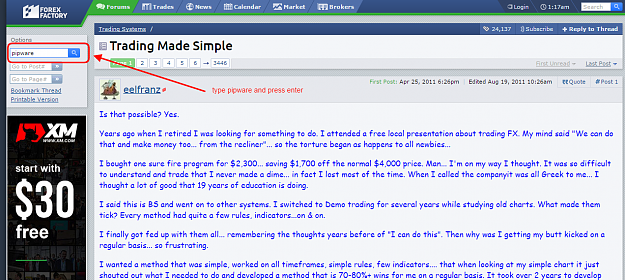
That is using pipware indicator. Read this: Post #68,839 (click this link) Post #68,853 (click this link) Post #68,843 (click this link) Or, do this way: image Or, like this: image
Trading Made Simple
- BridgeWater replied May 3, 2016
You must know about indicator on post #68,646 that i create base on Emm Post #68,585 and #68,609. So, its nothing wrong with that indicator. But, if you want it calculated base on High/Low of current week, try this one. I made custom indicator for ...
Trading Made Simple
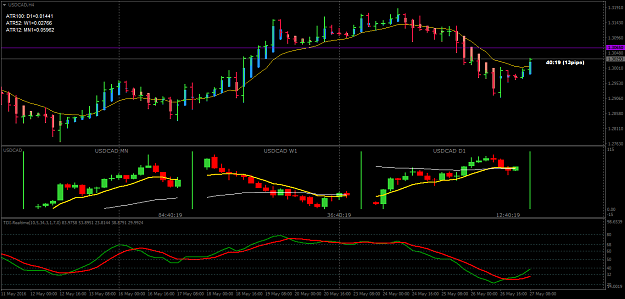
- BridgeWater replied Apr 29, 2016
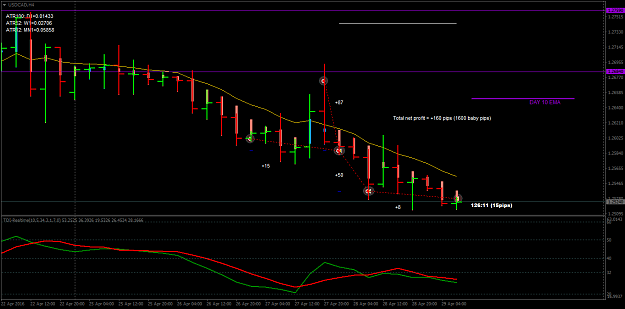
3 Days of USDCAD, its end of month, AMR get 120%, time to get out. 4 winning trade, net profit +160 pips (1600 baby pips) trade tooks on daily chart, follow Smart Money. image
Trading Made Simple
- BridgeWater replied Apr 26, 2016
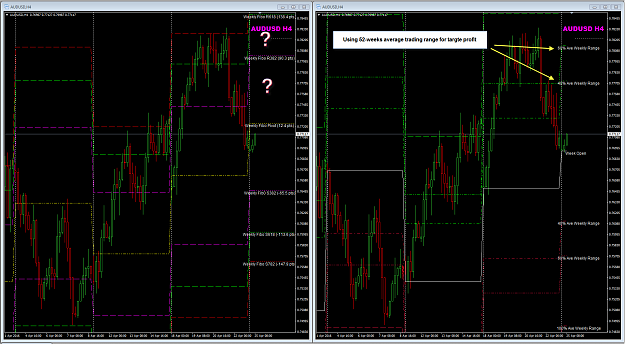
Im create custom indicator, for anyone who need 52 Average Weekly Range represented on chart, this indicator give you looks like this: image image here the indicator: file
Trading Made Simple

- BridgeWater replied Apr 18, 2016
try this, when zoom out chart, change APB setting: default line tickness 3, change to 2 image what is your LCD monitor display size? its below 16" maybe?
Trading Made Simple

- BridgeWater replied Apr 17, 2016
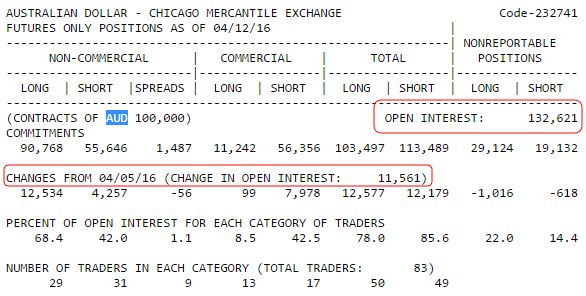
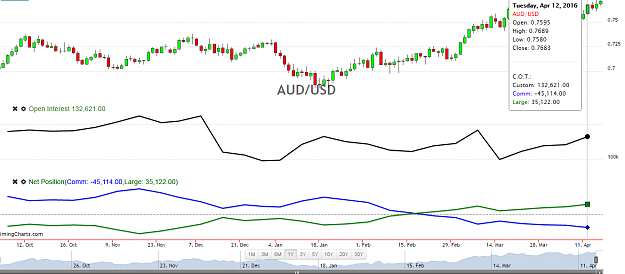
my fundamental thought about AUDUSD, market is getting stronger, because according last report release, Open Interest is rising, and price is rising too, this two things indicate market getting stronger to move UP. image image
Trading Made Simple
- BridgeWater replied Apr 16, 2016
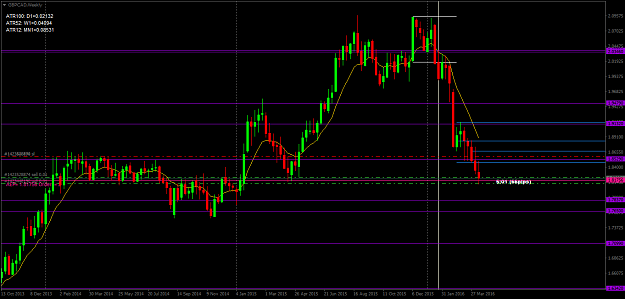
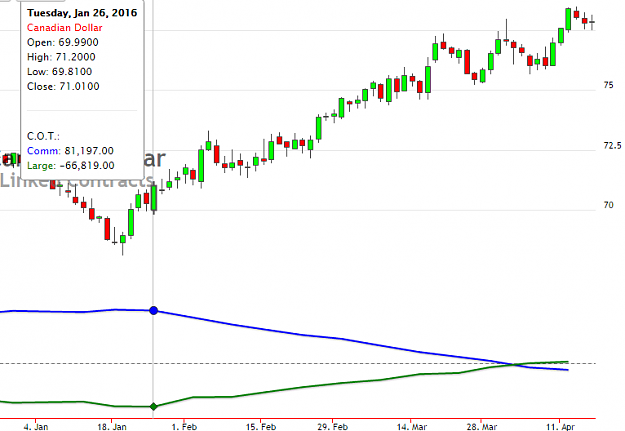
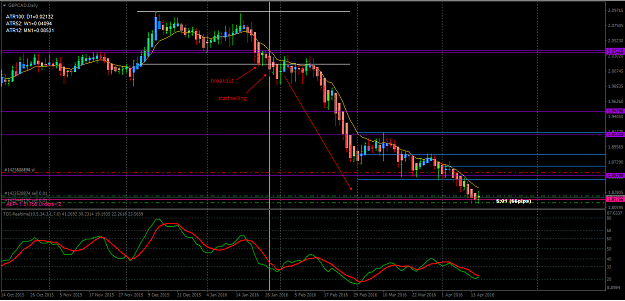
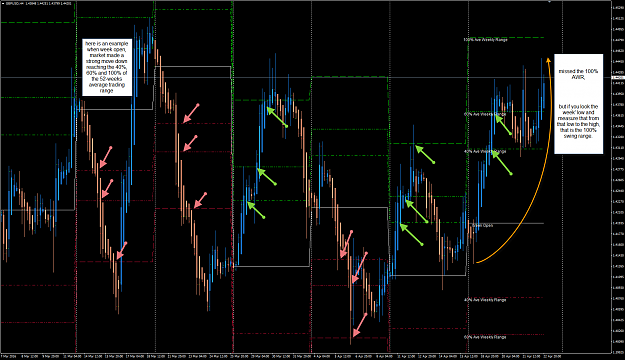
I want to share my simple COT Analysis for down movement GBPCAD happened at 26 january 2016 On weekly chart Wide Range Bar breakout: image After COT Report release on 26 january 2016, to know CAD went up: image So, 27 january 2016, start selling ...
Trading Made Simple