- Search Metals Mine
- 118 Results (14 Threads , 104 Replies )
- Blud4oilPrgm replied Dec 22, 2011
EUR/AUD — image Precise levels are mainly on the major pairs, but on the crosses you do still get the yellow inverted line signals, compass and a high low level line. As for my background, I trade several different types of forex systems. ...
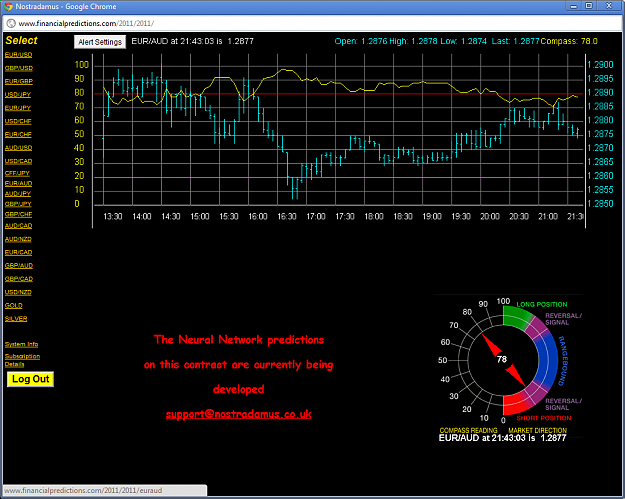
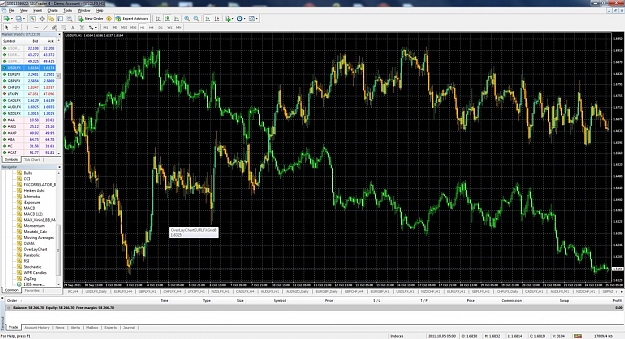
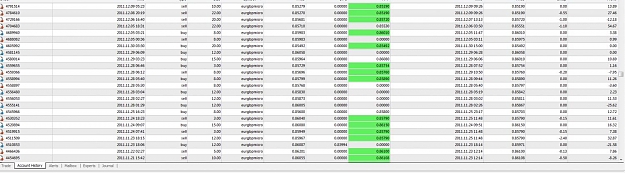
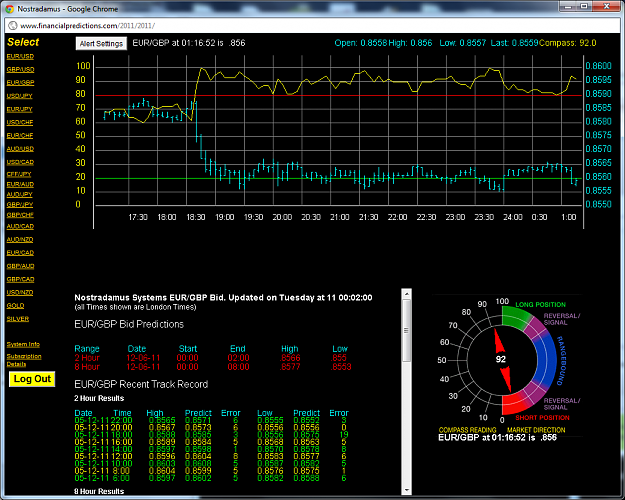
- Scalping eur/gbp with a proprietary neural net
Over the last month or so I've had very consistent results scalping eur/gbp. What is it? But its ...
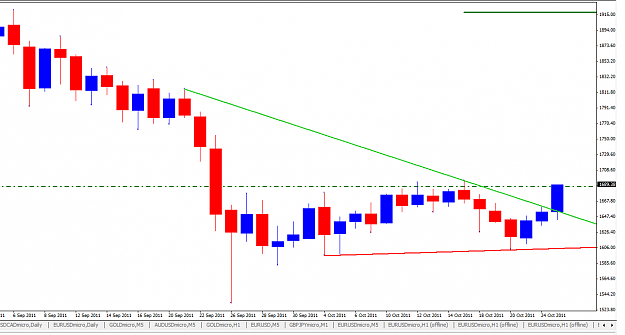
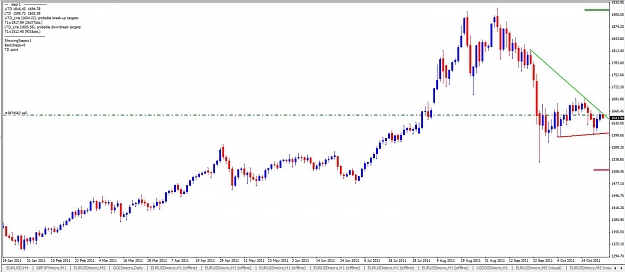
- Blud4oilPrgm replied Dec 11, 2011
Using this EA, much more.. — image See my thread about the original Pippo EA that uses murrey math. OVER 6 PROFIT FACTOR -- Trades Silver -> Results: url
- de mark trendline indi
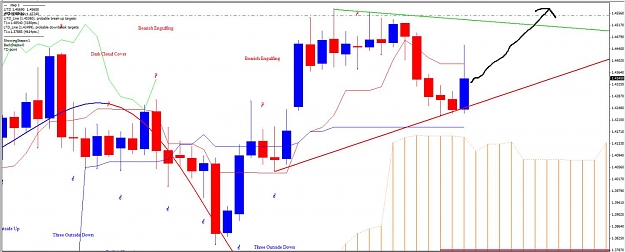
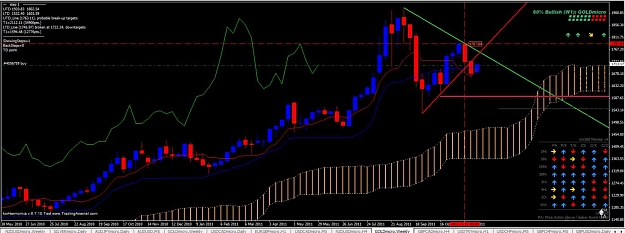
this indicator rules. the end. {image}
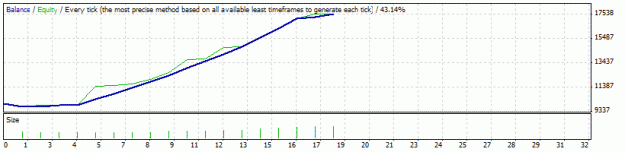
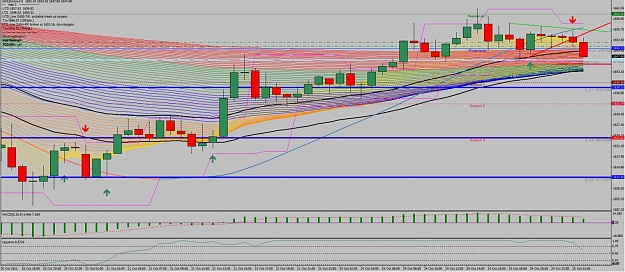
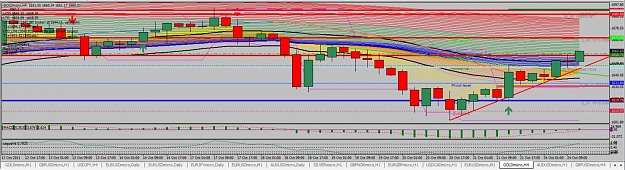
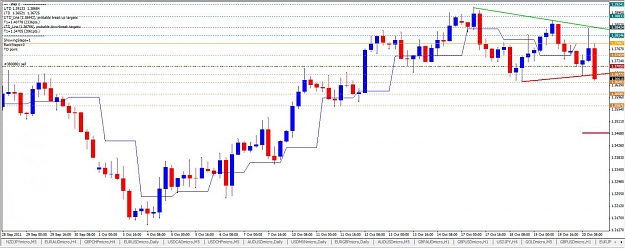
- Blud4oilPrgm replied Dec 8, 2011
Pippo EA on 15 min silver, demo forward test — Pair: 15 min Silver EA: Pippo Timespan: 11/9 - 12/08 Profit: $1,652 Profit Factor: 6.3 lot sizes: .02, .06 .12 image This is an EA I have been testing for several months. As you can see, the ...
- Blud4oilPrgm replied Dec 3, 2011
my take — always useful to be mindful of the larger commodity market. Until the CRB can break above the cloud at 318 I see no reason to be long gold. Looks like we have some overhead resistance. I am flat here until the trend can re-assert ...
- Blud4oilPrgm replied Nov 28, 2011
Ichimoku analysis — I'm Long at 1708 area. GOLD 1D image Price has bounced off trendline support extending from 1600. Well within a thick Kumo cloud so I expect this area to hold solid. Right now cloud floor is around 1660.50. Cloud ceiling ...
- Blud4oilPrgm replied Nov 10, 2011
. — image 4 HR hammer candle atm the moment.
- Blud4oilPrgm replied Nov 7, 2011
Ok cool, good to know I'm not the only one. And I think more generally, it looks like commodities have carved out a bottom in the kumo area on CRB 1D. image This will be very helpful.
- Blud4oilPrgm replied Nov 7, 2011
. — image Anyone here follow Ichimoku? According to that gold is looking excellent here. Above on the daily you can see price clearly above the kumo cloud and both the Tenkan sen and Kijun sen at a rather steep angle. May pullback a bit but ...
- Ichimoku EA testing on 1 HR GOLD
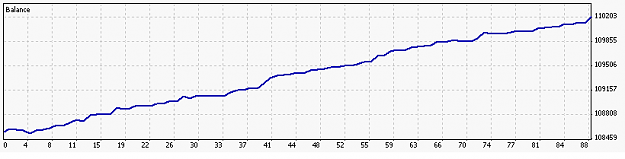
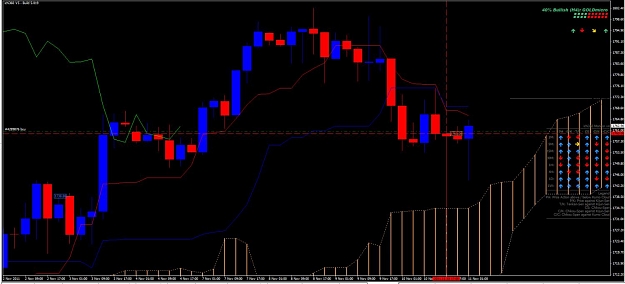
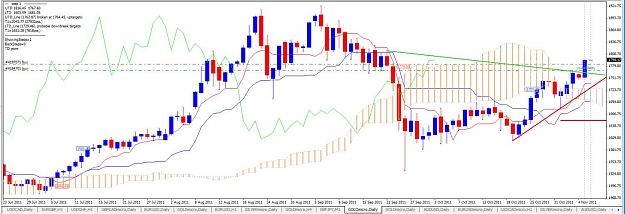
Backtested gold from 2008.01.01 - 2011.10.12 {image} {url} Not all trades show on the statement, ...
- Blud4oilPrgm replied Oct 25, 2011
Well that didn't take long to start dropping. Thanks for the skepticism I sold my position for a profit. now short image
- Blud4oilPrgm replied Oct 25, 2011
takeaways — Let's look at gold more holistically here. 1) Backwardation of WTI crude, meaning front month contract higher than later months suggesting a real supply squeeze not paper generated moves. url 2) See the CRB index of which gold is ...
- Blud4oilPrgm replied Oct 25, 2011
breakout holding — Nice move image Backwardation on WTI futures adding fuel to CRB.
- Blud4oilPrgm replied Oct 25, 2011
not that long — about 2.5 weeks now using sigtrader with overlays. have to keep in mind the overlay indicator isn't the best. it can shift history some so looking at the past won't necessarily look the same as it did when the price action was ...
- Blud4oilPrgm replied Oct 24, 2011
Determining risk — image I use an overlap of gbp/jpy on USDX to help determine risk trends. Here the dollar looks to be getting stronger as the carry consolidate and get weaker.
- Blud4oilPrgm replied Oct 24, 2011
daily — image Overhead demark trendline resistence on daily gold
- Blud4oilPrgm replied Oct 24, 2011
gold getting weaker on 1 hr — EMA cross, laguerre breaking image
- Blud4oilPrgm replied Oct 24, 2011
. — image The 4 hr chart is being confirmed here. Laguerre is just breaking .75 so plenty of room to move higher this session it seems. Arrows on the chart are EMA crossovers.
- Blud4oilPrgm replied Oct 20, 2011
demark — Yes eur/usd broke through Demark trendline on 4 hr chart looking for more dropping.