- Search Metals Mine
- 104 Results
-
 Blaiserboy replied Nov 27, 2019
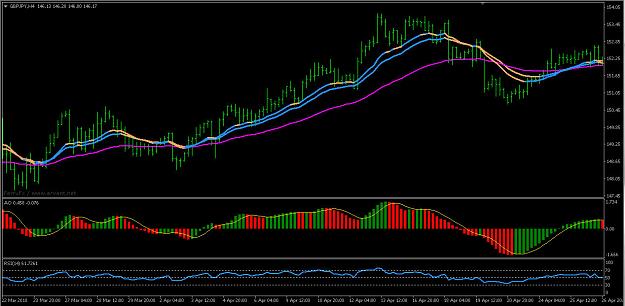
I entered a 'Buy' on RB7 a couple hours ago and it just broke even. I am a bit concerned that it will retrace as my indicators are showing overbought. I sure hope the Tidane is telling me good things. lol
Basket Knights - A Basket Trading Round Table
- Blaiserboy replied Nov 27, 2019
This illustrates RSI 4 for the RB7 Index Looks like it is getting ready to retrace image
Basket Knights - A Basket Trading Round Table
- Blaiserboy replied Nov 17, 2019
this one can be configured in several ways image
Basket Knights - A Basket Trading Round Table

- Blaiserboy replied Nov 17, 2019
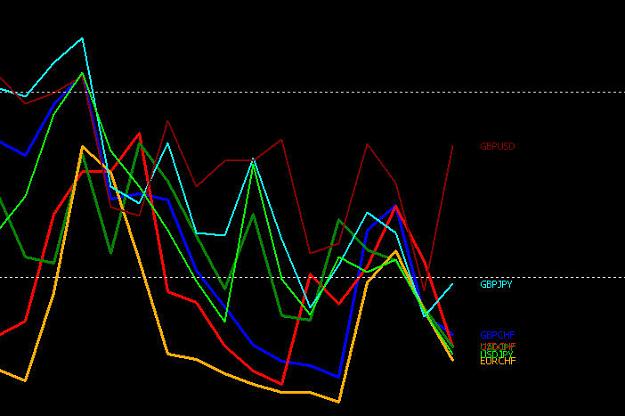
I use this to keep an eye on the different groupings image
Basket Knights - A Basket Trading Round Table
- Blaiserboy replied Nov 14, 2019
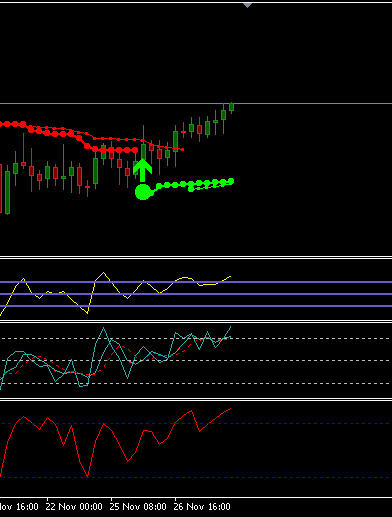
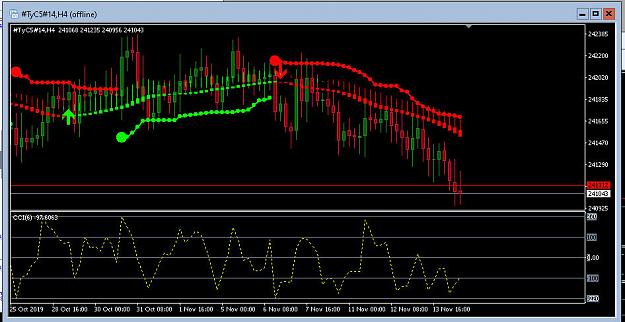
These two pics are using CCI 6 for the oscillator when CCI 6 gets to oversold and then reverses this is a sign of trend reversal So these may be helpful. especially the 4 hour chart. Comments, please While I think these charts are wonderful, I do ...
Basket Knights - A Basket Trading Round Table
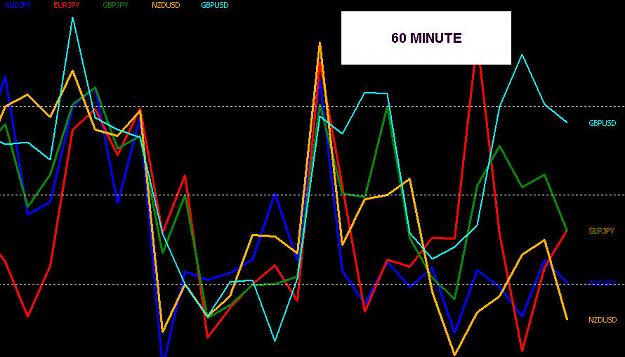
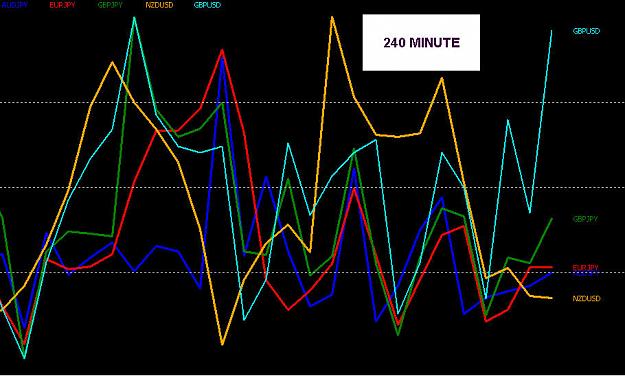
- Blaiserboy replied Nov 14, 2019
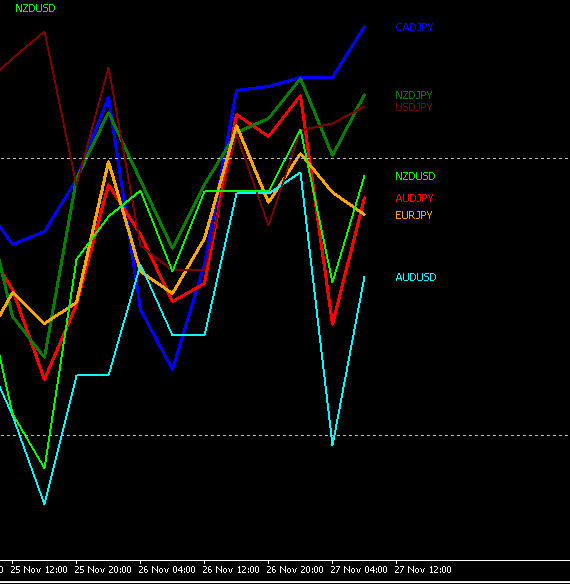
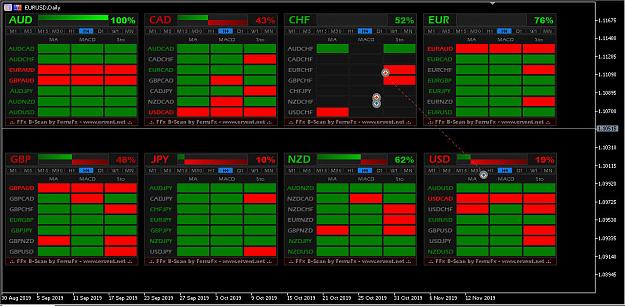
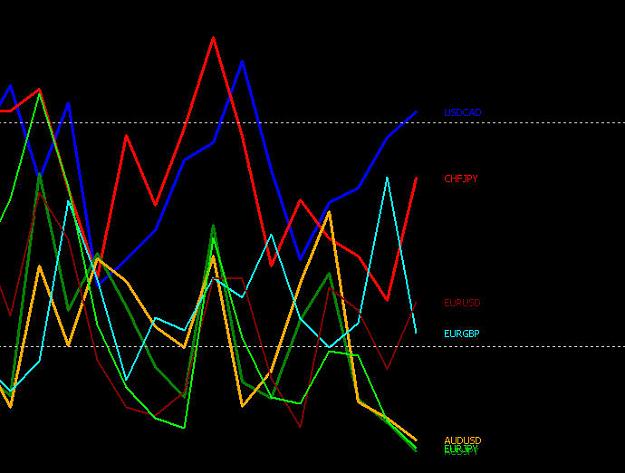
I should have mentioned, the two charts in my last post are 4 hour charts, perhaps the chart should be daily.........? This chart is ADX10 on a daily chart, I made the post larger so people can see the names as some of them are messed up in the ...
Basket Knights - A Basket Trading Round Table
- Blaiserboy replied Nov 14, 2019
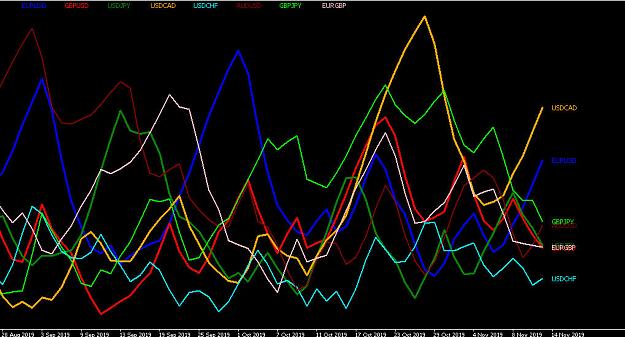
My first idea is to plot RSI 4 for each of the pairs (I am using 14 at the moment) I have to make 2 charts of that or I will be unable to read the names of the pairs I can see that several of them are about to go up so I will see what positions I ...
Basket Knights - A Basket Trading Round Table
- Blaiserboy replied Nov 14, 2019
First Post.. Thanks for all the tools and tips! image
Basket Knights - A Basket Trading Round Table
- Blaiserboy replied Jun 2, 2018
This indicator could be the basis of a trading system On the chart I used varying settings to get the two lines along with a 50 ma for trend..... Pretty simple. image
MA RSI with alert
- Blaiserboy replied Apr 28, 2017
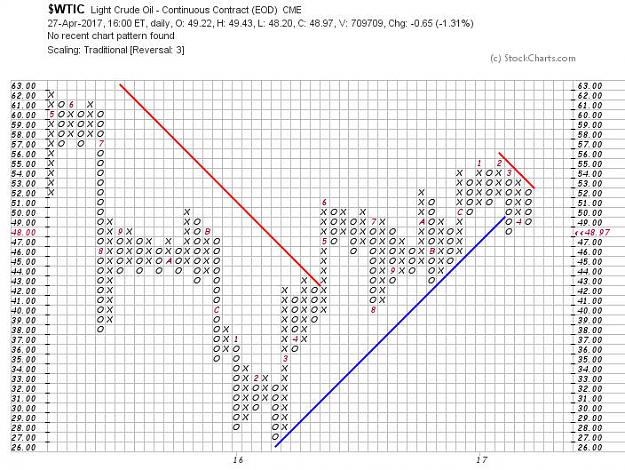
Here is a Point & Figure Chart which is showing that Crude is building a base. It may be a while before a breakout but it should be a large move.
Trading Crude Oil with price action + indicator
- Blaiserboy replied Nov 25, 2016
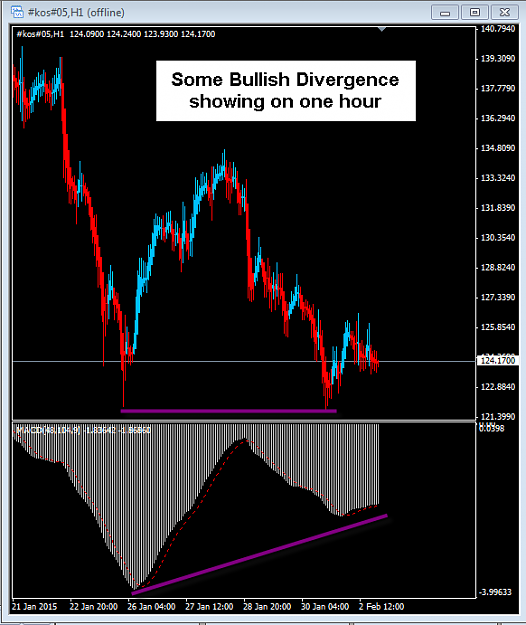
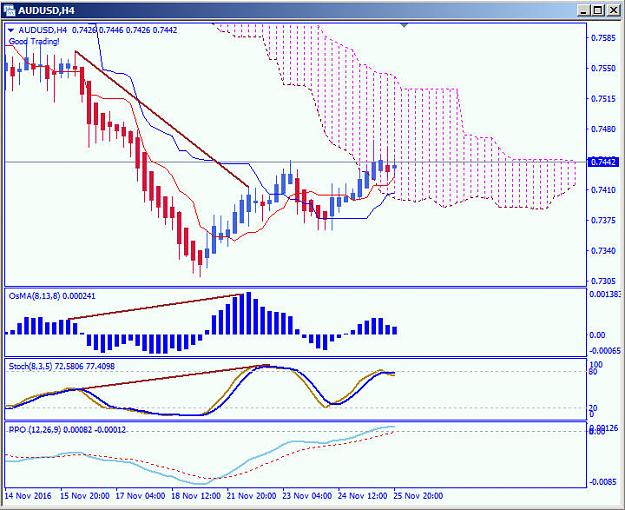
A couple days ago it looked like AUDUSD was ready for a short entry and that may have been a mistake. In any event, I added the PPO indicator to my chart to work as a confirmation for entry..... and sure enough there was no cross and price is now ...
Hidden divergence
- Blaiserboy replied Dec 24, 2015
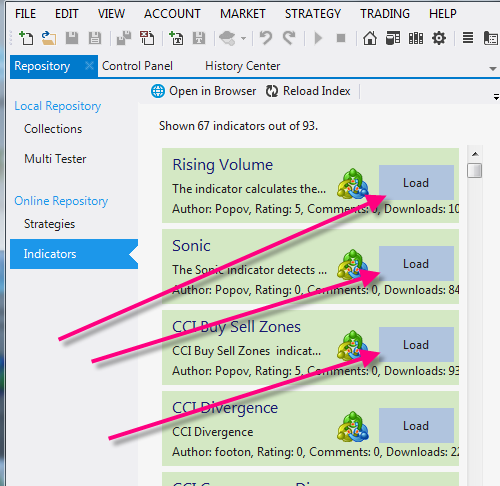
It is really easy and fast..... have a look at the pics I am posting. You can click on those icons and the indicators really quickly and they are automatically loaded into your FSBPro Do the same for the Strategies if you like. image image image
Forex Strategy Builder Professional


- Blaiserboy replied Nov 15, 2015
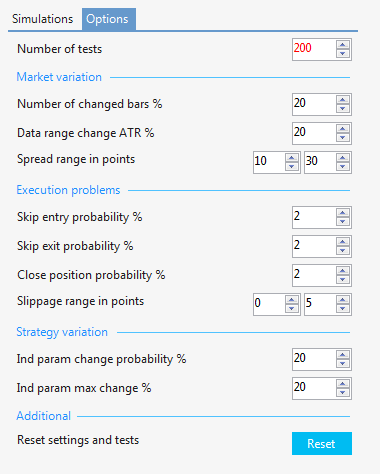
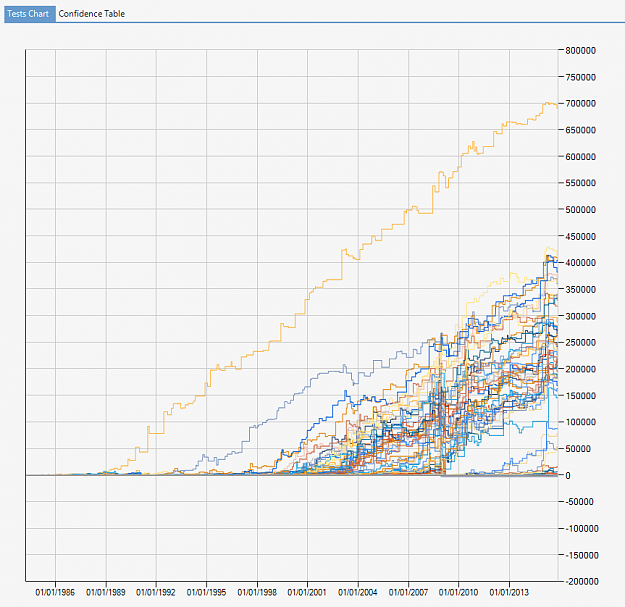
Here is the Monte Carlo, needless to say I will not be able to retire on this one. lol
Forex Strategy Builder Professional
- Blaiserboy replied Nov 15, 2015
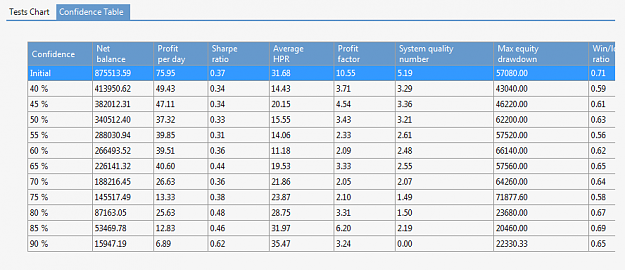
I forgot to add the statistics , here it is
Forex Strategy Builder Professional
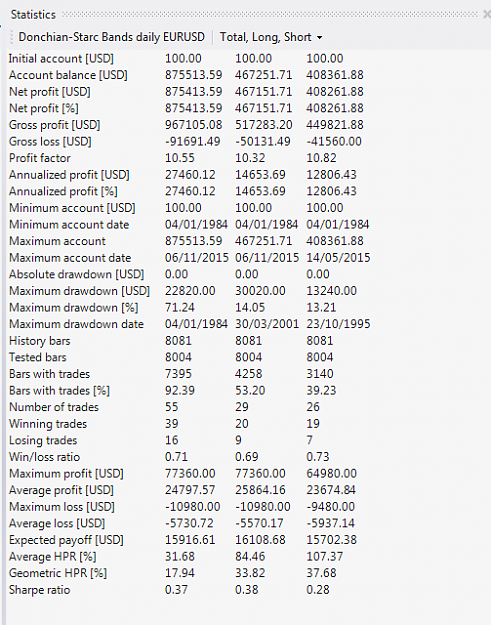
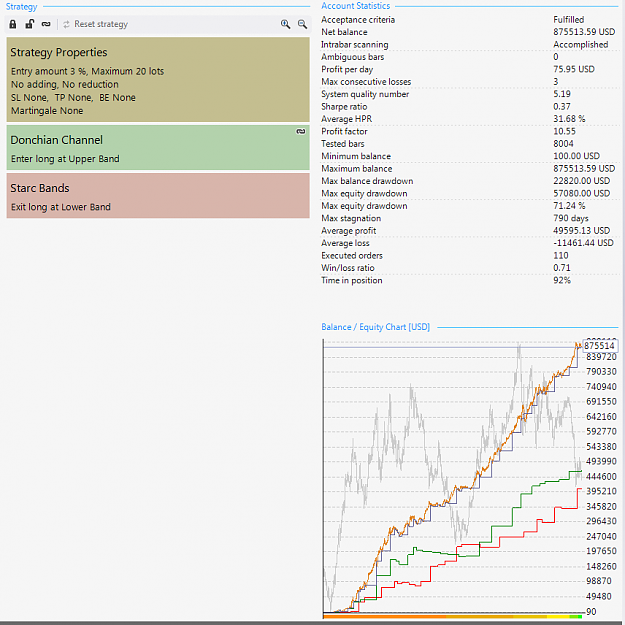
- Blaiserboy replied Nov 15, 2015
Here is a preliminary result from the new Multi Tester. This does not use Stop Loss or Take Profit, it is in the market most of the time. I have been working with moving averages a lot on the daily charts but this application of Donchian Channel is ...
Forex Strategy Builder Professional


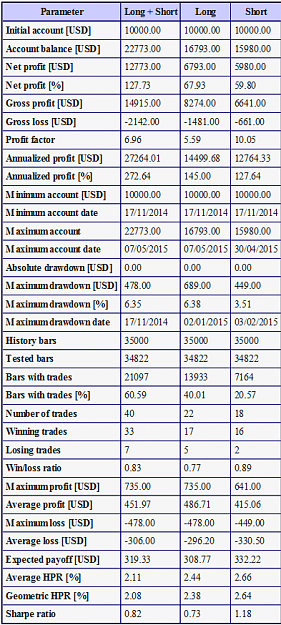
- Blaiserboy replied May 8, 2015
Here is a report on one that I am working on, this is on a 5 minute chart. I used all of the 'Williams' indicators to make this. I also used the feature to 'add' lots for the trades I just used 35,000 bars , I guess that is about a month, and the ...
Forex Strategy Builder Professional
- Blaiserboy replied Apr 24, 2015
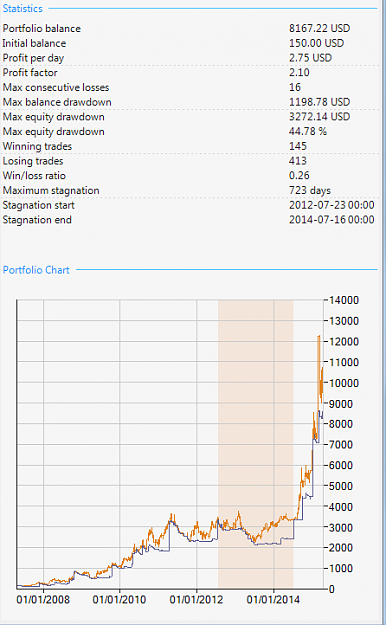
This is a portfolio of expert advisers that I am starting to build. You can see that I am in the very initial stages. These are daily EURUSD Please notice that I have a large period of stagnation..... more than two years. What can I do to reduce ...
Forex Strategy Builder Professional