- Search Metals Mine
- 27 Results
-
 BWforex replied Apr 6, 2021
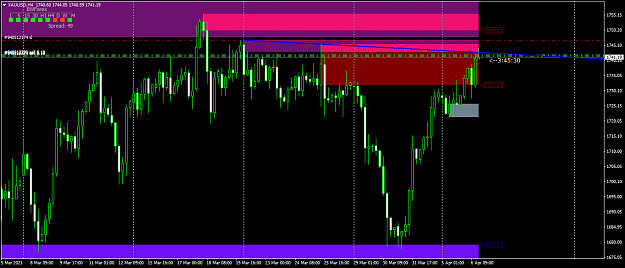
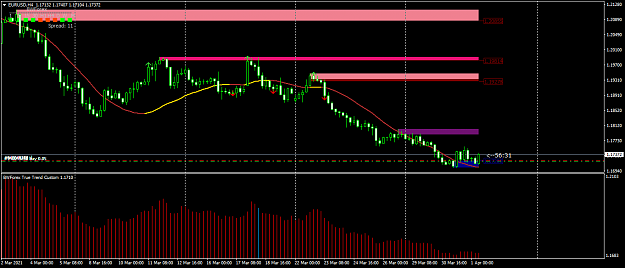
Small Sell on GOLD, this will be real test for my system, Last time it picked GOLD buys perfectly
"AUSSI" my thread and anything I want to put here image
image

- BWforex replied Apr 6, 2021
Trying some small shorts on GOLD because my system rules are all met on H4
One Pattern Trading by BWForex image
- BWforex replied Apr 1, 2021
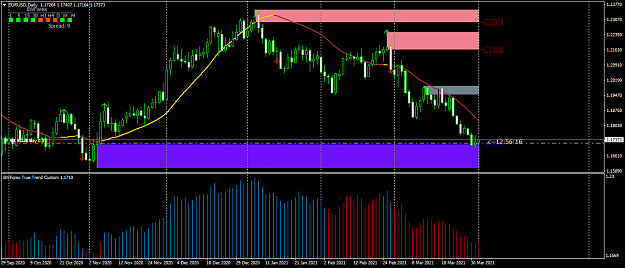
But looking at the H4 and D1 it looks like we still have energy of going up as we have small Demand area on H4 and very Big DOUBLE one on D1, I will just observe image image
"AUSSI" my thread and anything I want to put here

- BWforex replied Apr 1, 2021
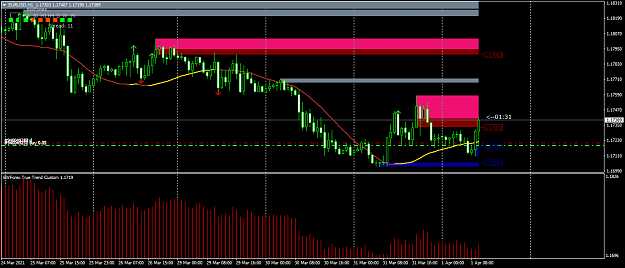
You see how I entered my Entries basing on the direction of HULL Moving average that I use as a Trend Indicator, the Demand was formed on H1 and the next candle I Entered, this way I am avoiding draw downs, This will be very critical on my FTMO ...
"AUSSI" my thread and anything I want to put here
- BWforex replied Apr 1, 2021
But looking at the H4 and D1 it looks like we still have energy of going up as we have small Demand area on H4 and very Big DOUBLE one on D1, I will just observe image image
One Pattern Trading by BWForex

- BWforex replied Apr 1, 2021
You see how I entered my Entries basing on the direction of HULL Moving average that I use as a Trend Indicator, the Demand was formed on H1 and the next candle I Entered, this way I am avoiding draw downs, This will be very critical on my FTMO ...
One Pattern Trading by BWForex

- BWforex replied Mar 30, 2021
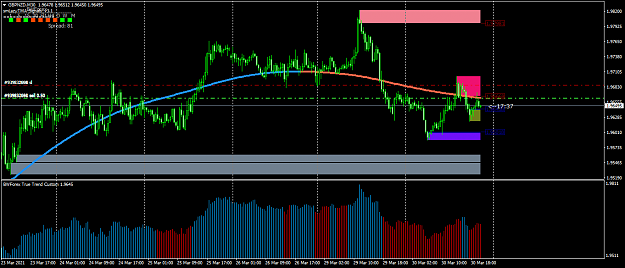
GBPNZD nice Sell scalps there M30 PINK zone being retested along the Trend image
One Pattern Trading by BWForex
- BWforex replied Mar 30, 2021
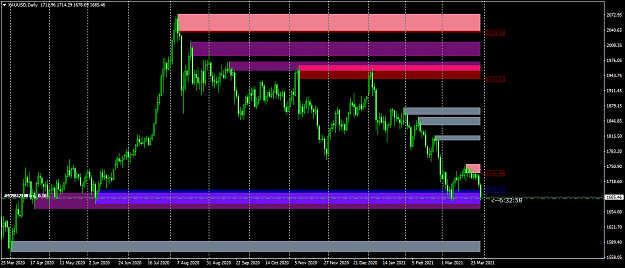
Added Buys at Supply and Demand Daily Chart, Still Trading One Pattern now adding Buys at Blue Zone image
One Pattern Trading by BWForex
- BWforex replied Mar 30, 2021
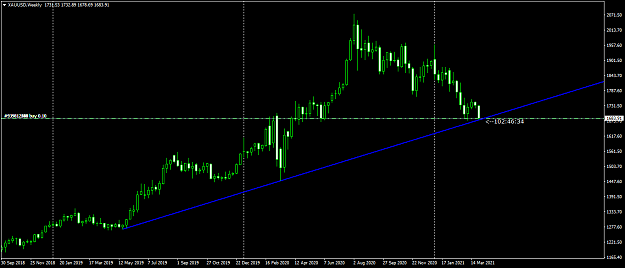
GOLD at weekly UPTrendline built some buys there image
One Pattern Trading by BWForex
- BWforex replied Mar 30, 2021
Supply and Demand Daily Chart image
"AUSSI" my thread and anything I want to put here

- BWforex replied Mar 30, 2021
We are on weekly uptrendline and its is happening at weekly R200. confluence of indicators
"AUSSI" my thread and anything I want to put here image
image

- BWforex replied Mar 25, 2021
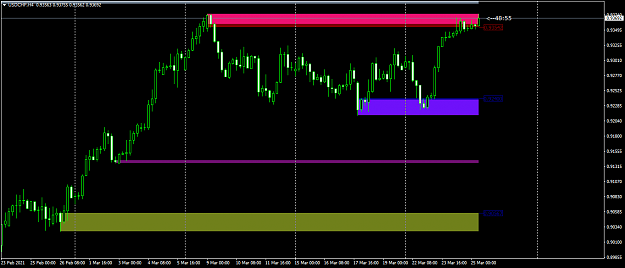
USDCHF entered the PINK zone on M30, H1 and H4 ready for sells image
One Pattern Trading by BWForex
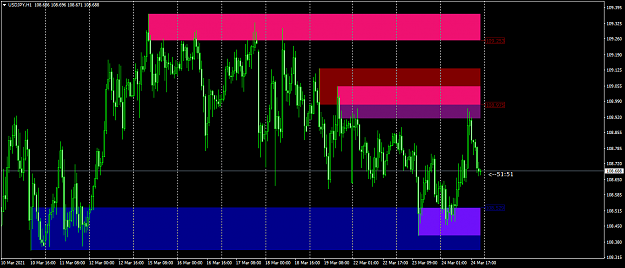
- BWforex replied Mar 25, 2021
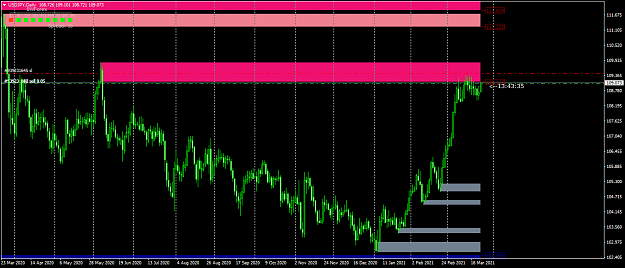
USDJPY is retesting the PINK zone on 30 minutes, 4Hours, Daily and Weekly, that MTF confirms strong signal, sells loaded image
One Pattern Trading by BWForex
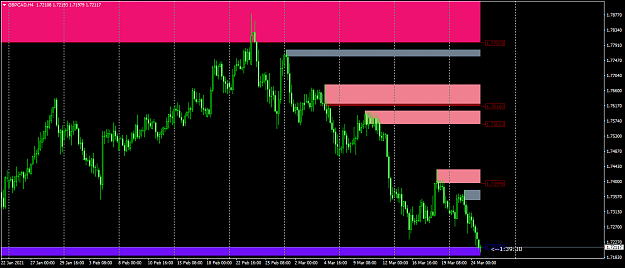
- BWforex replied Mar 24, 2021
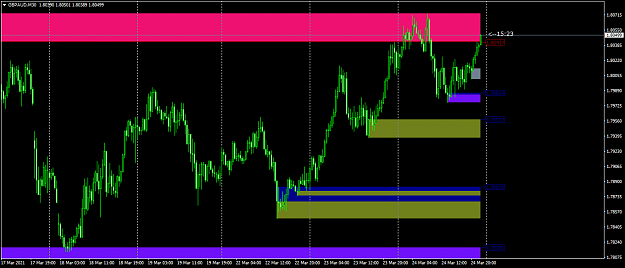
GBPAUD entered the PINK zone ready for sells image
One Pattern Trading by BWForex
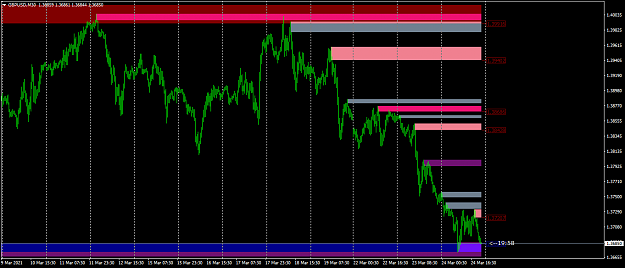
- BWforex replied Mar 24, 2021
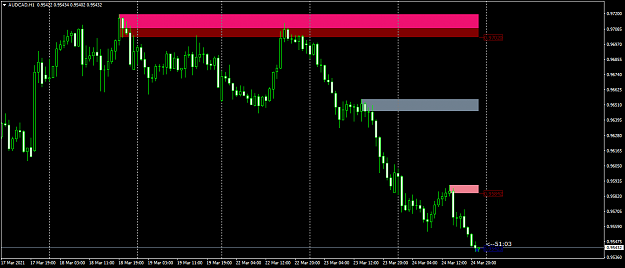
It looks like every time the price retouch the PINK box on the chart it drops. Pink box only happens for shorts trades, it means that I am going to specialize in SELL TRADES only even if anyone can tell me and show me a nice buy setup I am not going ...
One Pattern Trading by BWForex
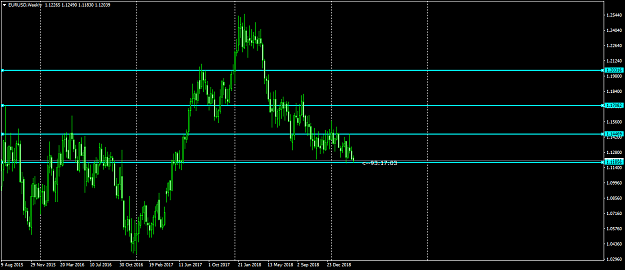
- BWforex replied Apr 2, 2019
I will never know for sure but that is my chart showing my important levels.
EURUSD only
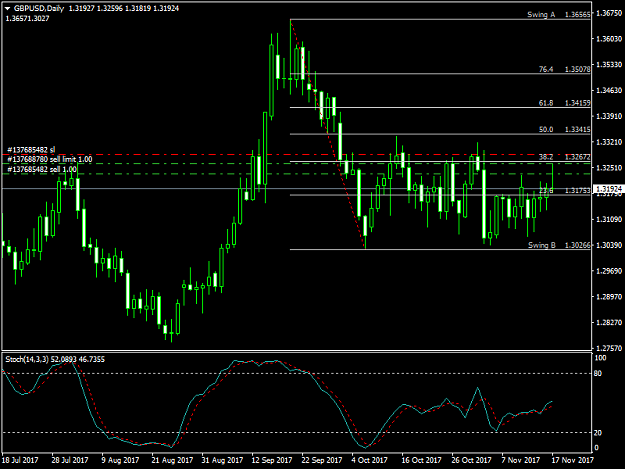
- BWforex replied Nov 17, 2017
The reason is because GBPUSD Day chart was at 38.2, again is because it was a retracement that is happening on a bearish Day Charts, Too much volume on GBPUSD dragged all pairs down, I just new to forex but that is the best I can ...
Dragon Riders GBP/JPY
- BWforex replied Sep 1, 2017
Hello Please may you code and indicator that will show all Fractals that appears between CCI(period 14) 100 and CCI -100. I will like an arrow that will point all Fractals that formed between CCI (period 14) 100 and -100. Example is the attached ...
Free MT4 coding - Indicators, EAs, etc
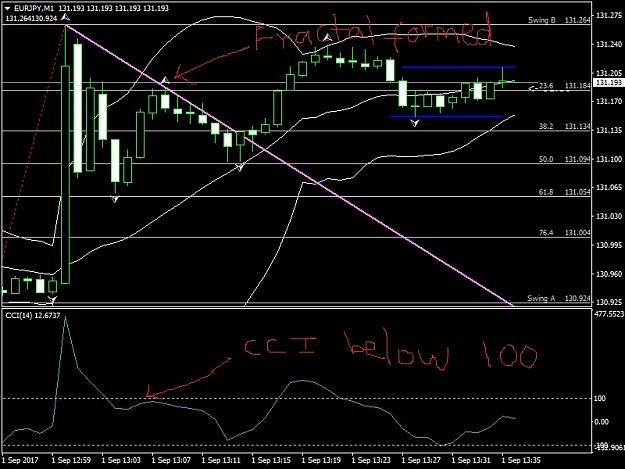
- BWforex replied Sep 1, 2017
Please may you code and indicator that will show all Fractals that appears between CCI(period 14) 100 and CCI -100. I will like an arrow that will point all Fractals that formed between CCI (period 14) 100 and -100. Example is the attached picture ...
I will code your winning strategy